Download to read offline
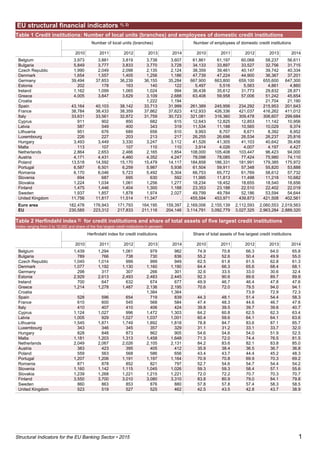


This document contains tables of structural indicators for the EU banking sector from 2010 to 2014. It includes data on the number of local credit institution units and employees in each EU country, concentration levels in the banking sector measured by Herfindahl indexes, and the number and total assets of branches from both EU and non-EU credit institutions operating in each EU country.


![[Challenge:Future] USE THE SOURCES TO OUTSOURCE. A FUTURE COMPETITIVE EASTERN...](https://cdn.slidesharecdn.com/ss_thumbnails/challengefuture-use-the-sources-to-outsource-a-future-competitive-eastern-europe3159-130228015341-phpapp02-thumbnail.jpg?width=640&height=640&fit=bounds)


