More Related Content
Similar to 2016 12 31 - Annual Market Returns - Colour Coded
Similar to 2016 12 31 - Annual Market Returns - Colour Coded (20)
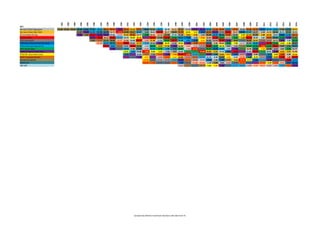
2016 12 31 - Annual Market Returns - Colour Coded
- 1. KEY:
1981
1982
1983
1984
1985
1986
1987
1988
1989
1990
1991
1992
1993
1994
1995
1996
1997
1998
1999
2000
2001
2002
2003
2004
2005
2006
2007
2008
2009
2010
2011
2012
2013
2014
2015
2016
Barclays Global Aggregate 21.85 41.01 34.32 34.68 14.09 77.36 22.24 46.57 84.97 0.52 65.19 45.50 79.21 19.68 41.81 18.36 38.70 41.53 92.70 11.32 15.49 23.13 40.88 17.44 50.46 22.87 37.43 45.08 59.39 22.94 15.57 36.29 43.86 21.88 13.29 36.31
Barclays Global High Yield 11.87 9.68 41.29 17.78 41.35 52.75 -9.72 62.98 43.17 38.07 8.28 38.63 16.70 28.17 38.89 71.79 10.56 5.51 9.25 40.54 14.15 37.95 16.75 19.47 12.81 57.67 22.07 6.43 15.55 36.54 20.76 13.16 33.55
DJ Euro Stoxx 50 Cap 9.05 5.94 27.23 15.82 34.34 47.66 -19.03 51.02 37.35 33.77 0.09 24.14 12.10 27.24 27.16 71.58 9.01 4.96 5.34 35.69 13.07 36.16 16.30 15.02 9.58 41.92 21.28 3.89 14.35 29.93 13.86 12.99 33.12
FTSE All Share 13.14 8.44 26.64 36.09 -21.65 34.78 36.04 28.58 -0.25 23.85 11.98 23.56 21.68 55.61 7.61 4.25 -5.86 28.06 12.84 24.49 15.75 9.45 1.24 30.12 18.68 2.87 13.42 26.90 11.29 9.83 29.86
FTSE Asia Pacific 5.20 -25.07 21.15 34.49 -23.97 21.60 32.68 28.39 -2.09 21.46 11.56 20.01 13.77 53.48 6.91 3.05 -8.54 26.82 11.14 22.04 8.38 8.60 -1.25 28.85 18.43 -0.50 12.37 24.73 9.62 7.25 29.59
FTSE British Government All Stocks -31.33 15.77 25.71 -25.25 20.80 30.44 27.75 -2.53 20.58 8.40 18.25 12.45 32.61 3.09 0.20 -15.02 23.93 9.90 20.64 6.54 7.88 -12.77 25.28 16.90 -2.29 12.30 22.36 9.10 5.38 26.01
FTSE Small Cap Index (ex IT) 11.53 8.47 -30.92 19.87 20.49 18.30 -4.28 20.53 6.92 17.36 4.55 31.69 -0.66 -9.56 -17.24 20.86 8.22 20.18 3.21 7.64 -17.20 19.64 16.28 -3.46 11.83 20.81 6.97 4.91 24.62
FTSE World Index 2.84 -45.75 18.50 19.88 17.94 -5.31 15.83 2.72 8.80 3.41 30.06 -1.93 -13.29 -18.75 20.42 6.60 18.96 1.57 6.36 -18.18 14.36 14.83 -4.30 11.46 9.72 6.84 4.34 21.77
Halifax Property Index (NSA) 17.51 4.93 13.86 -5.85 8.58 2.35 7.94 3.01 24.95 -4.07 -13.92 -22.68 19.09 5.53 17.33 0.69 5.32 -18.89 12.60 14.51 -5.79 10.91 7.89 6.23 2.91 21.30
HFRI FOF: Diversified Index 8.25 -7.78 12.83 -8.02 2.34 -3.80 4.32 -5.88 24.20 -5.90 -15.48 -26.83 17.27 4.94 15.85 -0.27 5.27 -20.07 5.57 8.86 -12.22 4.59 6.48 4.29 2.45 19.36
MSCI Emerging Markets -3.46 -9.18 1.24 -8.47 -1.42 -4.82 -8.04 -6.54 14.00 -22.03 -18.50 -27.77 15.73 3.39 14.03 -3.36 3.72 -23.00 3.20 8.79 -14.14 2.70 5.33 1.18 1.89 16.75
Nasdaq Composite -11.35 -1.82 -17.16 -24.68 -9.72 13.64 -25.13 -19.86 -29.58 2.10 1.89 7.93 -3.38 1.43 -29.93 -0.76 7.20 -15.16 2.60 -3.94 -0.54 0.98 12.54
Nikkei 225 -12.44 -4.48 -21.43 -26.83 -26.17 0.00 -29.59 -21.68 -31.62 1.18 1.84 6.82 -6.46 -6.81 -35.18 -1.16 -3.44 -17.57 0.20 -4.08 -2.11 0.57 10.10
S&P 500 -2.11 -34.12 -31.60 -37.74 0.20 -0.06 5.53 -7.10 -17.92 -48.32 -4.80 -5.67 -18.15 -0.26 -4.41 -2.68 -9.65 6.73
Compiled by Wellian Investment Solutions with data from FE