Download as PDF, PPTX
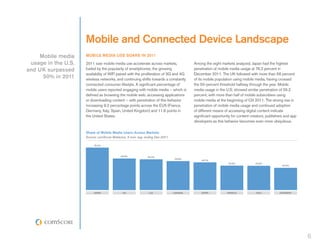
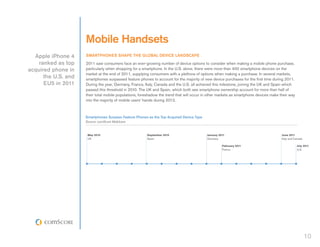
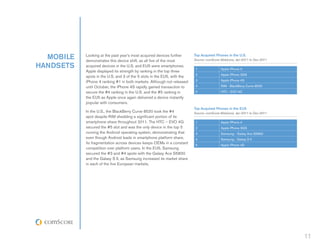
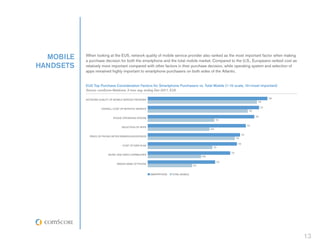
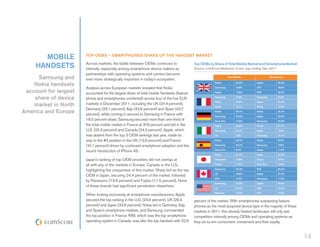
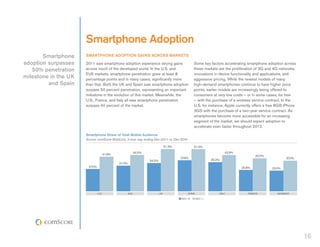
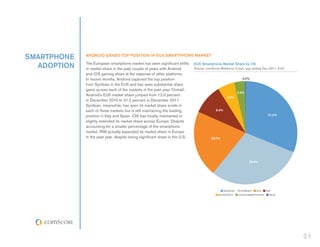
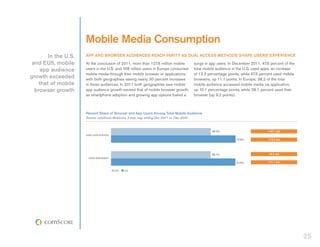
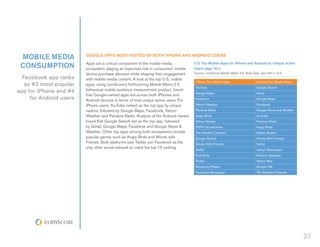

In 2011, smartphones surpassed feature phones as the top acquired mobile device type in several major markets including the US, UK, Germany, France, Italy, and Canada. The iPhone 4 was the top acquired phone in both the US and EU5 markets in 2011. All five of the most acquired phones in the US and three of the top five in the EU5 were Apple smartphones, demonstrating the company's strength in the mobile market. The rise of smartphones drove increased mobile media usage, which surpassed 50% penetration in many markets.


![5G Explained! A High Level Overview [Introduction]](https://cdn.slidesharecdn.com/ss_thumbnails/5gexplainedahighleveloverview-260119165306-cc137a3e-thumbnail.jpg?width=640&height=640&fit=bounds)


