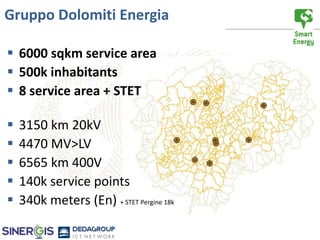
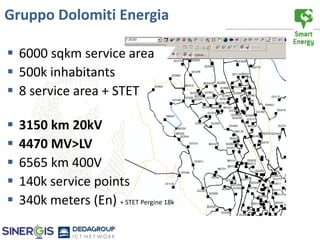
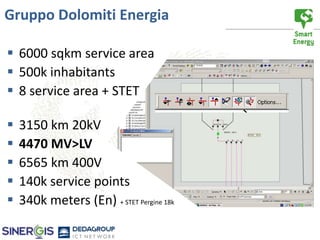
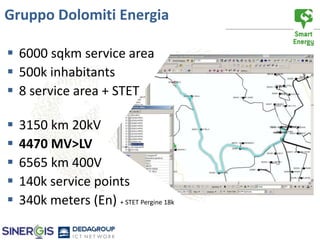
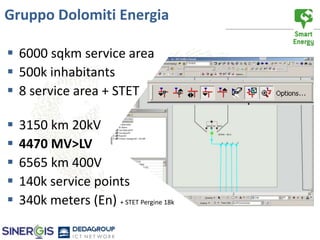
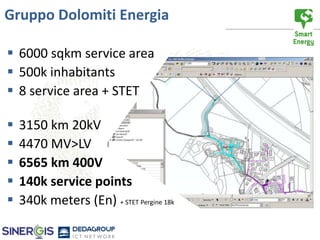
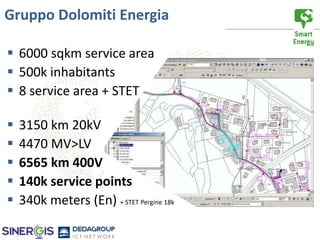
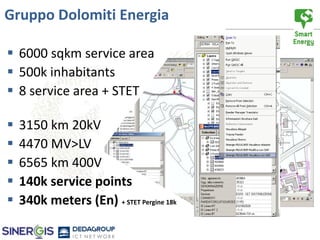
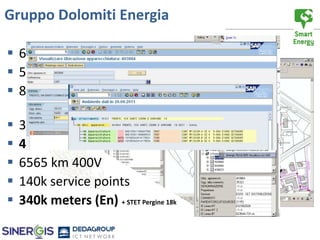
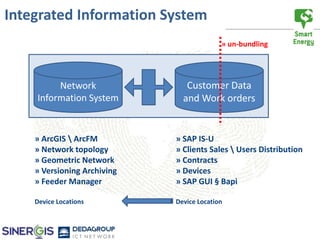
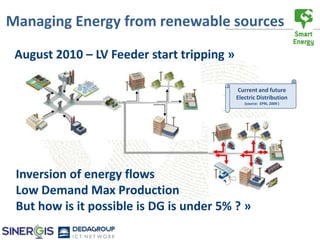
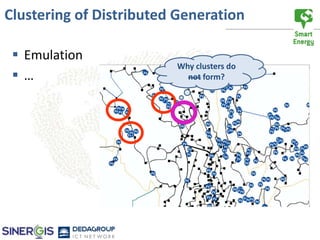
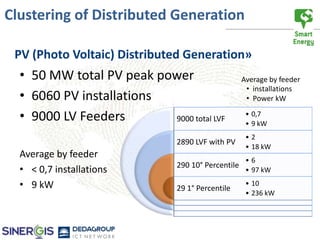
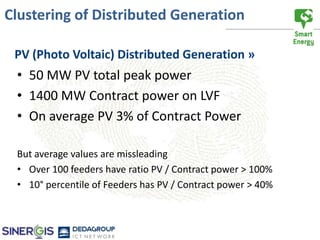
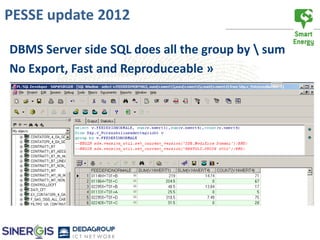
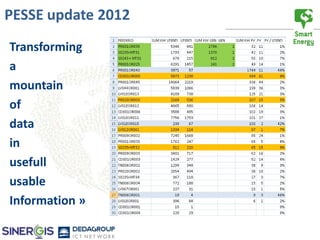
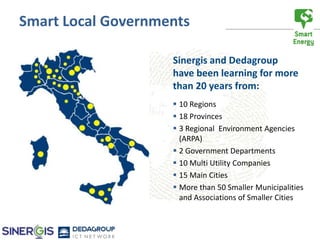
The impact of Distributed
Generation on network security
ESRI EUC Madrid, 27 October 2011, Tomaso Bertoli
Network Security and DG?


  How Distributed Generation impacts network
  security? »
   Gruppo Dolomiti Energia
    Network Security of Low Voltage Feeders
   STET Pergine
    PESSE review 2012
Gruppo Dolomiti Energia

 6000 sqkm service area
 500k inhabitants
 8 service area + STET

   3150 km 20kV
   4470 MV>LV
   6565 km 400V
   140k service points
   340k meters (En) + STET Pergine 18k
Gruppo Dolomiti Energia

 6000 sqkm service area
 500k inhabitants
 8 service area + STET

   3150 km 20kV
   4470 MV>LV
   6565 km 400V
   140k service points
   340k meters (En) + STET Pergine 18k
Gruppo Dolomiti Energia

 6000 sqkm service area
 500k inhabitants
 8 service area + STET

   3150 km 20kV
   4470 MV>LV
   6565 km 400V
   140k service points
   340k meters (En) + STET Pergine 18k
Gruppo Dolomiti Energia

 6000 sqkm service area
 500k inhabitants
 8 service area + STET

   3150 km 20kV
   4470 MV>LV
   6565 km 400V
   140k service points
   340k meters (En) + STET Pergine 18k
Gruppo Dolomiti Energia

 6000 sqkm service area
 500k inhabitants
 8 service area + STET

   3150 km 20kV
   4470 MV>LV
   6565 km 400V
   140k service points
   340k meters (En) + STET Pergine 18k
Gruppo Dolomiti Energia

 6000 sqkm service area
 500k inhabitants
 8 service area + STET

   3150 km 20kV
   4470 MV>LV
   6565 km 400V
   140k service points
   340k meters (En) + STET Pergine 18k
Gruppo Dolomiti Energia

 6000 sqkm service area
 500k inhabitants
 8 service area + STET

   3150 km 20kV
   4470 MV>LV
   6565 km 400V
   140k service points
   340k meters (En) + STET Pergine 18k
Gruppo Dolomiti Energia

 6000 sqkm service area
 500k inhabitants
 8 service area + STET

   3150 km 20kV
   4470 MV>LV
   6565 km 400V
   140k service points
   340k meters (En) + STET Pergine 18k
Gruppo Dolomiti Energia

 6000 sqkm service area
 500k inhabitants
 8 service area + STET

   3150 km 20kV
   4470 MT>BT
   6565 km 400V
   140k service points
   340k meters (En) + STET Pergine 18k
Integrated Information System
                                           » un-bundling


         Network                Customer Data
    Information System         and Work orders


    » ArcGIS  ArcFM         » SAP IS-U
    » Network topology       » Clients Sales  Users Distribution
    » Geometric Network      » Contracts
    » Versioning Archiving   » Devices
    » Feeder Manager         » SAP GUI § Bapi

    Device Locations         Device Location
Network security for Low Voltage feeders

  Like at home when the meter “trips” because
  oven and dryier and … are used together »
Electric Analysis LV – V1 (2008)

• Trace Geometric Network return tree topology
• Current Contract
  Loads from SAP
• Test Loads from
  design


• Design Version
Electric Analysis LV – V1 (2008)

• Parameters
  • Contract Voltage
  • % of safe use
  • Power …
     • Paid for
     • Current contract
     • Available
• Probability concurrence
• Probability  Acceptable
  Risk of black-out
Electric Analysis LV– V1 (2008)

• Output XLS
  •   Max Current
  •   Voltage Drop
  •   Available power
  •   Losses
  •   Short Circuit Current
Managing Energy from renewable sources

 August 2010 – LV Feeder start tripping »

                                             Current and future
                                            Electric Distribution
                                               (source: EPRI, 2009 )


 Inversion of energy flows
 Low Demand Max Production
 But how is it possible is DG is under 5% ? »
Clustering of Distributed Generation

  Emulation
                         Why clusters do
 …                        not form?
Clustering of Distributed Generation

 PV (Photo Voltaic) Distributed Generation»
  • 50 MW total PV peak power                       Average by feeder
                                                     • installations
  • 6060 PV installations                            • Power kW

  • 9000 LV Feeders       9000 total LVF
                                                     • 0,7
                                                     • 9 kW
                                                     •2
                               2890 LVF with PV
                                                     • 18 kW
  Average by feeder
                                                     •6
                               290 10° Percentile
  • < 0,7 installations                              • 97 kW

  • 9 kW                       29 1° Percentile
                                                     • 10
                                                     • 236 kW
Clustering of Distributed Generation

 PV (Photo Voltaic) Distributed Generation »
 • 50 MW PV total peak power
 • 1400 MW Contract power on LVF
 • On average PV 3% of Contract Power

 But average values are missleading
 • Over 100 feeders have ratio PV / Contract power > 100%
 • 10° percentile of Feeders has PV / Contract power > 40%
Electric Analysis LV BT – V2 (2011)

• Generators
   • SAP IS-U
   • design
• Parameters
   • Power Modulation
   • Generation Modulation

Usual scenarios:
• Late afternoon workday Winter
• Weekend noon Summer
STET Pergine – PESSE review 2012

 “small” multi utility
  in side valley
 18k Electric meters
 WaterWasteWater
 Gas
 Garbage
 Street Lighting
PESSE – What ? Why ?

 PESSE, Emergency Plan for the safety of
         Electric System
 Under the coordination of Terna (HV transmission)
 Distribution companies disconnect load in a
 planned and selective way, in order to avoid un-
 controlled black outs.

                               28 september 2003
PESSE – How it works?
PESSE – How it works ?

 All residential and commercial customers are
 divided in groups
 For each group a rolling outage is planned for up
 to 1,5 hours per day.
PESSE Update 2012


 Optimize the groups »
  “domestic customers with life saving
   equipment are excluded from the planned
   outages”
  Distributed Generation – not only PV
PESSE Update 2012

GeoDataBase Versions to simulate
different PESSE plans  groups »
PESSE Update 2012

ArcFM Feeder Manager
Recalculates MV and LV feeder »
PESSE update 2012

DBMS Server side SQL does all the group by  sum
No Export, Fast and Reproduceable »
PESSE update 2012
Transforming
a
mountain
of
data
in
usefull
usable
Information »
3 key factors to “do more with less”


                                Robust                Competent
      Data &
                                Flexible              People on
     Processes
   data is trust worthy        Software             Processes & Sw
       (updated and         AEEG releases each
                                                       dedication and
    complete) only as             year new
                                                       (self)training to
  long as it is produced    rules, positive feed-
                                                    exploit all the power
   or used by a primary      back on processes
                                                    in Sw (old and new)
    company process        that can be managed
                                                    of the tech pyramid
                               and optimized
Thank you for the attention
Tomaso Bertoli
Solution Manager Utilities
Coordinator of Multi Utility User Group
For more info: www.gismart.eu


                                                              Special thanks to
                                          Mariano Fronza, Dolomiti Reti (GDE)
                                          Stefano Silvestri, Dolomiti Reti (GDE)
                                                Dario Dallepiatte, STET Pergine


                                                    www.sinergis.it | info@sinergis.it


                                              www.dedagroup.it | info@dedagroup.it
To be Smart...
Smart Local Governments


              Local Governments
              Using GIS-based Tax Solutions to be
              very effective in collecting real estate
              taxes and to fight tax elusion
Smart Multi Utilities


                 Multiutilities
                 Using GIS-based Solutions in order to
                 better run the distribution
                 network, reduce and manage power
                 downwtime
Smart Provinces And Regions


               Province e Regioni
               Soluzioni per il monitoraggio e il
               controllo permettono una gestione
               più efficace del traffico e una migliore
               manutenzione delle infrastrutture
               stradali
Smart Local Governments

                    Sinergis and Dedagroup
                    have been learning for more
                    than 20 years from:
                     10 Regions
                     18 Provinces
                     3 Regional Environment Agencies
                      (ARPA)
                     2 Government Departments
                     10 Multi Utility Companies
                     15 Main Cities
                     More than 50 Smaller Municipalities
                      and Associations of Smaller Cities
Thank you for the attention


For more info: tomaso.bertoli@sinergis.it

20111027 esri euc bertoli smart energy

  • 1.
    The impact ofDistributed Generation on network security ESRI EUC Madrid, 27 October 2011, Tomaso Bertoli
  • 2.
    Network Security andDG? How Distributed Generation impacts network security? »  Gruppo Dolomiti Energia Network Security of Low Voltage Feeders  STET Pergine PESSE review 2012
  • 3.
    Gruppo Dolomiti Energia 6000 sqkm service area  500k inhabitants  8 service area + STET  3150 km 20kV  4470 MV>LV  6565 km 400V  140k service points  340k meters (En) + STET Pergine 18k
  • 4.
    Gruppo Dolomiti Energia 6000 sqkm service area  500k inhabitants  8 service area + STET  3150 km 20kV  4470 MV>LV  6565 km 400V  140k service points  340k meters (En) + STET Pergine 18k
  • 5.
    Gruppo Dolomiti Energia 6000 sqkm service area  500k inhabitants  8 service area + STET  3150 km 20kV  4470 MV>LV  6565 km 400V  140k service points  340k meters (En) + STET Pergine 18k
  • 6.
    Gruppo Dolomiti Energia 6000 sqkm service area  500k inhabitants  8 service area + STET  3150 km 20kV  4470 MV>LV  6565 km 400V  140k service points  340k meters (En) + STET Pergine 18k
  • 7.
    Gruppo Dolomiti Energia 6000 sqkm service area  500k inhabitants  8 service area + STET  3150 km 20kV  4470 MV>LV  6565 km 400V  140k service points  340k meters (En) + STET Pergine 18k
  • 8.
    Gruppo Dolomiti Energia 6000 sqkm service area  500k inhabitants  8 service area + STET  3150 km 20kV  4470 MV>LV  6565 km 400V  140k service points  340k meters (En) + STET Pergine 18k
  • 9.
    Gruppo Dolomiti Energia 6000 sqkm service area  500k inhabitants  8 service area + STET  3150 km 20kV  4470 MV>LV  6565 km 400V  140k service points  340k meters (En) + STET Pergine 18k
  • 10.
    Gruppo Dolomiti Energia 6000 sqkm service area  500k inhabitants  8 service area + STET  3150 km 20kV  4470 MV>LV  6565 km 400V  140k service points  340k meters (En) + STET Pergine 18k
  • 11.
    Gruppo Dolomiti Energia 6000 sqkm service area  500k inhabitants  8 service area + STET  3150 km 20kV  4470 MT>BT  6565 km 400V  140k service points  340k meters (En) + STET Pergine 18k
  • 12.
    Integrated Information System » un-bundling Network Customer Data Information System and Work orders » ArcGIS ArcFM » SAP IS-U » Network topology » Clients Sales Users Distribution » Geometric Network » Contracts » Versioning Archiving » Devices » Feeder Manager » SAP GUI § Bapi Device Locations Device Location
  • 13.
    Network security forLow Voltage feeders Like at home when the meter “trips” because oven and dryier and … are used together »
  • 14.
    Electric Analysis LV– V1 (2008) • Trace Geometric Network return tree topology • Current Contract Loads from SAP • Test Loads from design • Design Version
  • 15.
    Electric Analysis LV– V1 (2008) • Parameters • Contract Voltage • % of safe use • Power … • Paid for • Current contract • Available • Probability concurrence • Probability Acceptable Risk of black-out
  • 16.
    Electric Analysis LV–V1 (2008) • Output XLS • Max Current • Voltage Drop • Available power • Losses • Short Circuit Current
  • 17.
    Managing Energy fromrenewable sources August 2010 – LV Feeder start tripping » Current and future Electric Distribution (source: EPRI, 2009 ) Inversion of energy flows Low Demand Max Production But how is it possible is DG is under 5% ? »
  • 18.
    Clustering of DistributedGeneration  Emulation Why clusters do … not form?
  • 19.
    Clustering of DistributedGeneration PV (Photo Voltaic) Distributed Generation» • 50 MW total PV peak power Average by feeder • installations • 6060 PV installations • Power kW • 9000 LV Feeders 9000 total LVF • 0,7 • 9 kW •2 2890 LVF with PV • 18 kW Average by feeder •6 290 10° Percentile • < 0,7 installations • 97 kW • 9 kW 29 1° Percentile • 10 • 236 kW
  • 20.
    Clustering of DistributedGeneration PV (Photo Voltaic) Distributed Generation » • 50 MW PV total peak power • 1400 MW Contract power on LVF • On average PV 3% of Contract Power But average values are missleading • Over 100 feeders have ratio PV / Contract power > 100% • 10° percentile of Feeders has PV / Contract power > 40%
  • 21.
    Electric Analysis LVBT – V2 (2011) • Generators • SAP IS-U • design • Parameters • Power Modulation • Generation Modulation Usual scenarios: • Late afternoon workday Winter • Weekend noon Summer
  • 22.
    STET Pergine –PESSE review 2012  “small” multi utility in side valley  18k Electric meters  WaterWasteWater  Gas  Garbage  Street Lighting
  • 23.
    PESSE – What? Why ? PESSE, Emergency Plan for the safety of Electric System Under the coordination of Terna (HV transmission) Distribution companies disconnect load in a planned and selective way, in order to avoid un- controlled black outs. 28 september 2003
  • 24.
    PESSE – Howit works?
  • 25.
    PESSE – Howit works ? All residential and commercial customers are divided in groups For each group a rolling outage is planned for up to 1,5 hours per day.
  • 26.
    PESSE Update 2012 Optimize the groups »  “domestic customers with life saving equipment are excluded from the planned outages”  Distributed Generation – not only PV
  • 27.
    PESSE Update 2012 GeoDataBaseVersions to simulate different PESSE plans groups »
  • 28.
    PESSE Update 2012 ArcFMFeeder Manager Recalculates MV and LV feeder »
  • 29.
    PESSE update 2012 DBMSServer side SQL does all the group by sum No Export, Fast and Reproduceable »
  • 30.
  • 31.
    3 key factorsto “do more with less” Robust Competent Data & Flexible People on Processes data is trust worthy Software Processes & Sw (updated and AEEG releases each dedication and complete) only as year new (self)training to long as it is produced rules, positive feed- exploit all the power or used by a primary back on processes in Sw (old and new) company process that can be managed of the tech pyramid and optimized
  • 32.
    Thank you forthe attention Tomaso Bertoli Solution Manager Utilities Coordinator of Multi Utility User Group For more info: www.gismart.eu Special thanks to Mariano Fronza, Dolomiti Reti (GDE) Stefano Silvestri, Dolomiti Reti (GDE) Dario Dallepiatte, STET Pergine www.sinergis.it | info@sinergis.it www.dedagroup.it | info@dedagroup.it
  • 33.
  • 34.
    Smart Local Governments Local Governments Using GIS-based Tax Solutions to be very effective in collecting real estate taxes and to fight tax elusion
  • 35.
    Smart Multi Utilities Multiutilities Using GIS-based Solutions in order to better run the distribution network, reduce and manage power downwtime
  • 36.
    Smart Provinces AndRegions Province e Regioni Soluzioni per il monitoraggio e il controllo permettono una gestione più efficace del traffico e una migliore manutenzione delle infrastrutture stradali
  • 37.
    Smart Local Governments Sinergis and Dedagroup have been learning for more than 20 years from:  10 Regions  18 Provinces  3 Regional Environment Agencies (ARPA)  2 Government Departments  10 Multi Utility Companies  15 Main Cities  More than 50 Smaller Municipalities and Associations of Smaller Cities
  • 38.
    Thank you forthe attention For more info: tomaso.bertoli@sinergis.it