Evraz presented its investor presentation for June 2010. Some key points include:
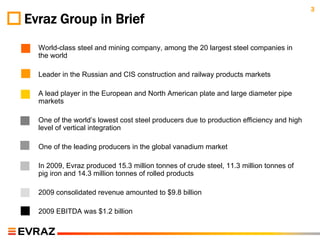
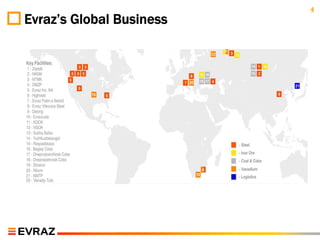
- Evraz is a leading global steel and mining company with operations across Russia, Europe, North America and Asia.
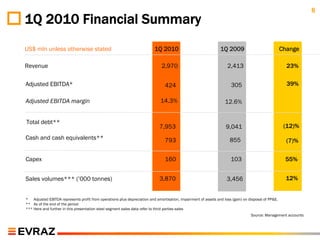
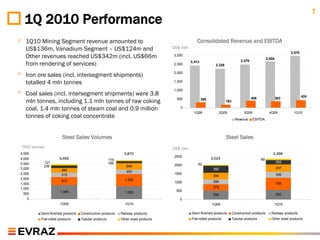
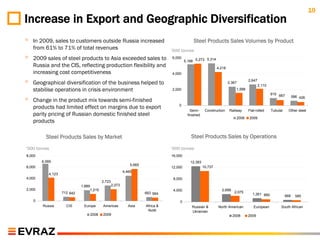
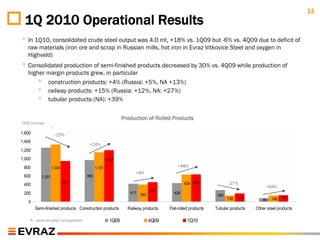
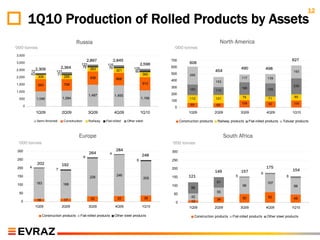
- In the first quarter of 2010, Evraz saw increases in revenue, EBITDA, sales volumes and production compared to the prior year period.
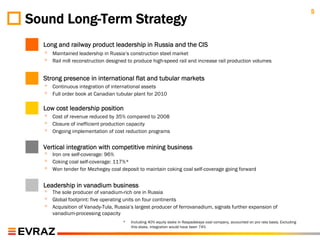
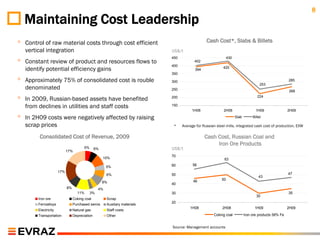
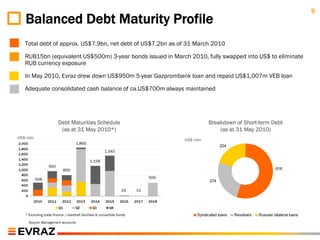
- Evraz maintains a strong balance sheet with manageable debt maturity profile and adequate cash balances. The company focuses on cost leadership through vertical integration and efficiency.