2009_IS
•
0 likes•144 views
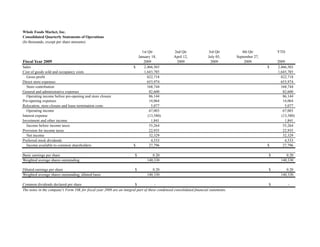
Whole Foods Market reported $2.46 billion in sales for the first quarter of fiscal year 2009. After costs, the company reported an operating income of $67 million and net income of $32 million. Basic and diluted earnings per share were $0.20.
Report
Share
Report
Share
Download to read offline
Recommended
New Ka Ad
This document is an advertisement for the Kool Ka vehicle from Lifestyle Ford. It provides the on the road price of £8335, monthly payments of £179 over 36 months with a £179 deposit. It lists other financial details like the total charge for credit and guaranteed minimum future value. It also includes brief specifications about the vehicle like ABS and a CD player. Contact details are provided for Lifestyle Ford locations.
Passport to success solutions level 1 book keeping
Here are the journal entries for the transactions:
Purchases
20X7 £
October 07 Cash 179
Motor Vehicle
20X7 £
October 21 Bank 1 990
9
Question 6
(a) Bought goods for resale on credit from J Singh:
Debit - Purchases
Credit - J Singh
(b) Sold goods to A Patel on credit:
Debit - A Patel
Credit - Sales
(c) Paid J Singh by cheque:
Debit - J Singh
Credit - Bank
(d) A Patel returned some goods:
Debit
MHK_Annual_Rpt_FINAL_08
Mohawk Industries is one of the world's leading flooring companies. It produces a full line of flooring products including carpet, rugs, ceramic tile, laminate, stone, wood, resilient and carpet cushion. In 2007, Mohawk acquired Columbia Flooring and its hardwood flooring plants, expanding Mohawk's capabilities in that category. While the US flooring industry faced challenges in 2007 from a slowing housing market, high material costs and energy prices, Mohawk delivered solid financial results including $7.6 billion in net sales and $706.8 million in net earnings through its diverse product portfolio and operations in both North America and Europe. Mohawk aims to maintain investments in its brands and pursue further expansion opportunities
C:\Fakepath\17255final Old Sugg Paper June09 1
This document summarizes the key details from a multi-part question regarding the amalgamation of two companies, Agni Ltd. and Bayu Ltd, into a new holding company called Chandrama Ltd.
The summary provides:
1) A statement of purchase consideration showing the calculation of amounts owed to Agni Ltd. and Bayu Ltd. shareholders based on profits and net assets.
2) A balance sheet for the new holding company Chandrama Ltd. after acquiring Agni Ltd. and Bayu Ltd., showing shares issued as consideration.
3) Several working notes providing adjustments made to Bayu Ltd.'s financials to make them comparable to Agni Ltd., and calculations of net profits and assets
47246781 2006-lcci-level-3-series-2 answer
Here are the key points from the information provided:
- Fixed assets have decreased due to depreciation exceeding additions
- Investments have increased
- Stock, debtors and bank have all increased significantly indicating higher activity levels
- Creditors have increased in line with higher activity
- Net current assets have increased substantially
- Retained earnings have increased substantially, indicating good profitability
- Share capital and share premium have increased due to a rights issue
So in summary, the company appears to be growing its operations and investments, experiencing higher activity levels and improving profitability based on the increase in retained earnings. The rights issue also indicates they are financing this growth internally for now. Overall the financial position of the company appears stronger based
A garments accessories company in Bangladesh and it's accounting system.
Bhai Bhai Trading Corporation is a garments and accessories company located in Dhaka, Bangladesh. The document discusses Bhai Bhai's business plan, which includes obtaining a bond-license, purchasing new machines, and replacing its current accounting system. It then examines Bhai Bhai's current accounting system, noting that it does not utilize double-entry bookkeeping. Finally, the document reflects on the group's work experience studying Bhai Bhai's operations.
104145957 47246781-2006-lcci-level-3-series-2answer-120418031555-phpapp02
1. Thackley Ltd's current assets and net current assets have significantly increased from 2005 to 2006, while fixed assets have decreased slightly.
2. Retained earnings have nearly tripled from 2005 to 2006, indicating strong profitability.
3. Ordinary share capital and share premium have increased to help finance the growth in assets and retained earnings.
4. Creditors due after one year (debentures) have decreased slightly from 2005 to 2006.
To analyze the changes, calculate key ratios such as current ratio, acid test ratio, gearing, return on capital employed and earnings per share for 2005 and 2006. This will
Wipro Q3 results financial statements -US GAAP
This document contains the unaudited condensed consolidated financial statements of Wipro Limited and its subsidiaries as of December 31, 2007 and 2008. It includes a balance sheet showing assets, liabilities, and stockholders' equity. As of December 31, 2008, the company had total current assets of $154.99 billion rupees, total assets of $193.50 billion rupees, total current liabilities of $46.16 billion rupees including short term bank borrowings, accounts payable, and accrued expenses, and total stockholders' equity of $147.34 billion rupees.
hollycorp.annualreport.2001
Holly Corporation is an independent petroleum refiner that produces gasoline, diesel fuel, and jet fuel. It owns two refineries - the Navajo Refinery in New Mexico with a capacity of 60,000 barrels per day, and the Montana Refinery near Great Falls, Montana with a capacity of 7,000 barrels per day. These refineries process high sulfur crude oils and serve markets in the southwestern U.S., northern Mexico, and Montana. In fiscal year 2001, Holly Corporation achieved record levels of revenue, earnings, and cash flow due to high industry margins and initiatives to improve efficiency and expand marketing efforts.
jacobs_ar01
This document is Jacobs' 2001 annual report. It summarizes that Jacobs had record revenues of $4 billion and net income of $87.8 million in 2001. It also had a backlog of $5.9 billion, up $500 million from 2000. The report discusses Jacobs' strategic acquisitions in Europe that expanded its international operations and discusses its commitment to safety and satisfied clients.
supervalu annual report 2002
This annual report summarizes SUPERVALU's financial performance for fiscal year 2002. Net sales decreased from the previous year due to exiting unprofitable stores and relationships. However, pre-tax income increased due to restructuring efforts. The report highlights that retail operations now represent the majority of sales and profits, and that distribution networks were made more efficient through consolidation. Going forward, the company intends to continue growing its retail segment through new store openings and remodels, focusing on the expanding Save-A-Lot brand.
Midterm solutions
The document contains a summary of transactions from July 1 to July 26 for an accounting period. It records debits and credits to various accounts including cash, inventory, accounts payable, accounts receivable, and others. It also includes income statements and balance sheets for Joseph's Vacuum Cleaners as of December 31, 2012 showing assets, liabilities, equity, revenues and expenses.
xto energy annual reports 1998
The document summarizes the history of Fort Worth, Texas from its origins as a frontier Army post in 1849 through its evolution into a modern city. It discusses how Fort Worth was shaped by strong individuals with big dreams who helped build the community through industries like cattle, railroads, oil, and entertainment. The annual report is dedicated to the diverse people who contributed to Fort Worth's growth and character. It also provides background on Cross Timbers Oil Company, the company publishing the report, and the forests they are named after.
Problemset c questions
The document provides financial information for several hypothetical companies and instructions to calculate various financial ratios based on the information provided. Specifically:
- It presents income statements, balance sheets, and other financial data for multiple companies including Starbucks, Graham Corporation, Barnette Enterprises, Batman Corporation, Spiderman Corporation, and Howard Company.
- For each company, it provides calculations or financial statement preparation tasks to analyze profitability, liquidity, and solvency based on ratios such as net income, earnings per share, working capital, current ratio, debt-to-assets ratio, and free cash flow.
- It also provides condensed financial information for Janzan Corporation and instructs the calculation and interpretation of liquidity,
ppg industries 3Q2007EARNINGSTABLES
PPG Industries reported financial results for the third quarter and first nine months of 2007. Net sales increased 13% to $2.8 billion for the quarter compared to the prior year. Income from continuing operations increased significantly to $215 million for the quarter from $70 million in the prior year. For the first nine months, net sales increased 13% to $8.3 billion and income from continuing operations increased 24% to $622 million compared to the same period in 2006.
xto energy annual reports 1996
This annual report summarizes Cross Timbers Oil Company's financial and operational performance in 1996. Some key highlights include:
- Record revenues of $161.4 million, up 43% from 1995. Record earnings of $19.8 million and operating cash flow of $68.3 million, both up significantly from 1995.
- Acquisition of over $100 million in producing properties in the Green River Basin in Wyoming and Permian Basin in Texas, expanding the company's reserve base.
- Plans to spend $120 million in capital expenditures in 1997 focused on drilling 173 wells and further developing its core areas.
- Goals to increase proved reserves to 5.4 BOE per share and cash
Assessment of the ANZ-RBS Merger in Asia Pacific
The proposed merger involves ANZ acquiring RBS's retail banking assets in Asia, including its operations in Taiwan, Hong Kong, Singapore, Indonesia, Philippines and Vietnam. Key details of the proposed deal include ANZ acquiring a customer base of over 2 million and assets valued at $3.6 billion. The acquisition is part of ANZ's strategy to expand its presence in Asia and will be an all-cash transaction funded by a recent capital raising. The deal is expected to be earnings accretive for ANZ within two years of completion.
staples Annual Report 1997
Staples had another year of strong growth and performance in fiscal year 1997. Key points:
- Sales exceeded $5 billion, a 31% increase over the previous year.
- 129 new stores were opened in North America.
- Major investments were made to support continued growth, including a new distribution center, national advertising campaign, and agreements surrounding the new Staples Center sports arena in Los Angeles.
- International operations, while not yet profitable, showed signs of improved performance and Staples remains committed to investing in their long-term growth.
- Overall, the company is well positioned for continued strong earnings growth in the future through ongoing store expansion and improvements across its business segments.
alltel 1q 07_highlights
- ALLTEL reported increases in key financial metrics for the first quarter of 2007 compared to the same period in 2006. Service revenues grew 14% and wireless operating income increased 21%.
- On a non-GAAP basis, which excludes certain items, operating income from current businesses grew 17% and net income increased 34% compared to the first quarter of 2006. Equity free cash flow grew 36%.
- Total assets decreased 27% compared to the end of 2006, largely due to the sale of ALLTEL's wireline business in 2006.
fr07_is-nongaap
Whole Foods Market reported sales of $1.51 billion for the quarter, up 13% from the previous year. Net income was $49.1 million compared to $53.9 million last year. Earnings per share were $0.35 compared to $0.37 in the previous year. On a non-GAAP basis, excluding one-time natural disaster costs, net income was also $49.1 million and earnings per share remained $0.35.
4Q07EarningsReleaseTABLESPDF
- PPG Industries reported net sales of $2.87 billion for the quarter and $11.2 billion for the year, up compared to the same periods in 2006. Net income was $200 million for the quarter and $834 million for the year.
- By business segment, Performance Coatings and Industrial Coatings experienced the largest sales increases both for the quarter and full year.
- Total current assets at the end of 2007 were $7.14 billion, up from $4.86 billion at the end of 2006, mainly due to increases in cash, short-term investments, and receivables.
whole food market fr08_scf
Whole Foods Market saw an increase in net income over the four quarters from $39 million in Q1 to $113 million for the full year. However, cash flows from operating activities decreased in Q3 as accounts receivable and inventory increased. The company invested heavily in new store development, equipment, and acquisitions, using cash flows from operations and financing activities like long-term borrowing. By the end of the year, cash and cash equivalents had declined to $24.9 million as cash was used for investing activities.
Grant clinic, inc
Grant Clinic, Inc. presented a financial plan with the following key points:
1) A SWOT analysis found strengths in the clinic's profits, working capital, and credit line, but weaknesses in external pressures like rising costs and regulations.
2) External pressures over the next three years include increasing costs, staffing shortages, and regulatory changes. Preventive measures include fundraising, cost control, and strategic planning.
3) The clinic needs 393 additional patients to break even based on its current cost structure and patient volume. A capital budget proposes new equipment purchases.
fr05_scf
Whole Foods Market reported $136 million in net income for the 2005 fiscal year. Cash provided by operating activities was $411 million, which was used to fund $207 million in new store development costs and $116 million in other property and equipment. Cash used in investing activities was $322 million. The company paid out $55 million in dividends to shareholders and used $6 million to repay debt. Cash provided by financing activities was $25 million, resulting in a $114 million increase in total cash and cash equivalents during the year.
Q1 2007 Earnings Release Financial Tables
Motorola reported financial results for Q1 2007, with net sales of $9.4 billion, down slightly from $9.6 billion in Q1 2006. Gross margin declined to $2.5 billion from $2.9 billion. The company had an operating loss of $366 million compared to operating earnings of $849 million in the prior year. On a segment basis, Mobile Devices sales fell 15% while Networks and Enterprise rose 20% and Connected Home Solutions increased 42%. Mobile Devices had an operating loss of $260 million versus earnings of $702 million in 2006.
fr08_scf
Whole Foods Market saw net income of $113 million in 2008 with cash provided by operating activities of $267 million. They invested $282 million in new store development and $110 million in other property and equipment. Total cash used in investing activities was $252 million. They paid $81 million in dividends and received $174 million from long-term borrowings, with cash provided by financing activities of $9 million and an overall increase in cash of $25 million for the year.
sales visual design 3
This document summarizes three GPS cycling computers from Garmin: the Edge Touring Plus, Edge 1000, and Edge 200. It provides details on the battery life, screen size and resolution, water resistance level, and included features of each. Pricing information is also given, including the manufacturer's suggested retail price and price to retailers. Background information on Garmin is presented, noting it was founded in 1989 in Lenexa, Kansas by Gary Burrell and Min Kao and is currently led by CEO Clifton A. Pemble. A reminder is given to contact sales representatives for more information on GPS products or to check or edit orders online.
אלעד גולדנברג: שנקר - 3 נובמבר 2013 - מיליארד קליקים לא טועים - שירות לקוחות ...
מיליארד קליקים לא טועים
שירות לקוחות באונליין
למה צריך שירות לקוחות
מדוע אנשים נוטשים את עגלת הקניות באונליין
שירות לקוחות כחלק מהמודל העסקי
Pre-Sale
Post-Sale
מושגי ליבה באיקומרס
Checkout Process
Payment Gateway
Authentication
fr06_is-nongaap
Whole Foods Market reported higher sales and net income in 2006 compared to 2005 on a non-GAAP basis. Sales increased 20% to $5.6 billion in 2006 from $4.7 billion in 2005. Net income grew 25% to $201.8 million in 2006 from $160.7 million in 2005, driven by sales growth partially offset by higher operating expenses. Earnings per share increased on both a basic and diluted basis for 2006 compared to 2005 on a non-GAAP basis.
אלעד גולדנברג: עולם וירטואלי, מסחר ממשי - מהפכת הקניות בקליק מתרחשת לנגד עיני...
האיקומרס כבר מזמן כאן והוא צובר תאוצה בשנים האחרונות בארץ ובעולם
יותר ויותר עסקים, יצרנים, קמעונאים, קטנים כגדולים מעוניין לפתח אפיק מכירה גלובלי באונליין
1 - עולם האיקומרס היום
2 - הטרנדים החמים במסחר האלקטרוני
3 - מוכרים ישראלים, סיפורי הצלחה
4 - טיפים להצלחה באיקומרס
מתוך כנס מכירות באמצעות האינטרנט
קרן שמש
מרץ 19 2014
סינמטק תל-אביב
More Related Content
What's hot
hollycorp.annualreport.2001
Holly Corporation is an independent petroleum refiner that produces gasoline, diesel fuel, and jet fuel. It owns two refineries - the Navajo Refinery in New Mexico with a capacity of 60,000 barrels per day, and the Montana Refinery near Great Falls, Montana with a capacity of 7,000 barrels per day. These refineries process high sulfur crude oils and serve markets in the southwestern U.S., northern Mexico, and Montana. In fiscal year 2001, Holly Corporation achieved record levels of revenue, earnings, and cash flow due to high industry margins and initiatives to improve efficiency and expand marketing efforts.
jacobs_ar01
This document is Jacobs' 2001 annual report. It summarizes that Jacobs had record revenues of $4 billion and net income of $87.8 million in 2001. It also had a backlog of $5.9 billion, up $500 million from 2000. The report discusses Jacobs' strategic acquisitions in Europe that expanded its international operations and discusses its commitment to safety and satisfied clients.
supervalu annual report 2002
This annual report summarizes SUPERVALU's financial performance for fiscal year 2002. Net sales decreased from the previous year due to exiting unprofitable stores and relationships. However, pre-tax income increased due to restructuring efforts. The report highlights that retail operations now represent the majority of sales and profits, and that distribution networks were made more efficient through consolidation. Going forward, the company intends to continue growing its retail segment through new store openings and remodels, focusing on the expanding Save-A-Lot brand.
Midterm solutions
The document contains a summary of transactions from July 1 to July 26 for an accounting period. It records debits and credits to various accounts including cash, inventory, accounts payable, accounts receivable, and others. It also includes income statements and balance sheets for Joseph's Vacuum Cleaners as of December 31, 2012 showing assets, liabilities, equity, revenues and expenses.
xto energy annual reports 1998
The document summarizes the history of Fort Worth, Texas from its origins as a frontier Army post in 1849 through its evolution into a modern city. It discusses how Fort Worth was shaped by strong individuals with big dreams who helped build the community through industries like cattle, railroads, oil, and entertainment. The annual report is dedicated to the diverse people who contributed to Fort Worth's growth and character. It also provides background on Cross Timbers Oil Company, the company publishing the report, and the forests they are named after.
Problemset c questions
The document provides financial information for several hypothetical companies and instructions to calculate various financial ratios based on the information provided. Specifically:
- It presents income statements, balance sheets, and other financial data for multiple companies including Starbucks, Graham Corporation, Barnette Enterprises, Batman Corporation, Spiderman Corporation, and Howard Company.
- For each company, it provides calculations or financial statement preparation tasks to analyze profitability, liquidity, and solvency based on ratios such as net income, earnings per share, working capital, current ratio, debt-to-assets ratio, and free cash flow.
- It also provides condensed financial information for Janzan Corporation and instructs the calculation and interpretation of liquidity,
ppg industries 3Q2007EARNINGSTABLES
PPG Industries reported financial results for the third quarter and first nine months of 2007. Net sales increased 13% to $2.8 billion for the quarter compared to the prior year. Income from continuing operations increased significantly to $215 million for the quarter from $70 million in the prior year. For the first nine months, net sales increased 13% to $8.3 billion and income from continuing operations increased 24% to $622 million compared to the same period in 2006.
xto energy annual reports 1996
This annual report summarizes Cross Timbers Oil Company's financial and operational performance in 1996. Some key highlights include:
- Record revenues of $161.4 million, up 43% from 1995. Record earnings of $19.8 million and operating cash flow of $68.3 million, both up significantly from 1995.
- Acquisition of over $100 million in producing properties in the Green River Basin in Wyoming and Permian Basin in Texas, expanding the company's reserve base.
- Plans to spend $120 million in capital expenditures in 1997 focused on drilling 173 wells and further developing its core areas.
- Goals to increase proved reserves to 5.4 BOE per share and cash
Assessment of the ANZ-RBS Merger in Asia Pacific
The proposed merger involves ANZ acquiring RBS's retail banking assets in Asia, including its operations in Taiwan, Hong Kong, Singapore, Indonesia, Philippines and Vietnam. Key details of the proposed deal include ANZ acquiring a customer base of over 2 million and assets valued at $3.6 billion. The acquisition is part of ANZ's strategy to expand its presence in Asia and will be an all-cash transaction funded by a recent capital raising. The deal is expected to be earnings accretive for ANZ within two years of completion.
staples Annual Report 1997
Staples had another year of strong growth and performance in fiscal year 1997. Key points:
- Sales exceeded $5 billion, a 31% increase over the previous year.
- 129 new stores were opened in North America.
- Major investments were made to support continued growth, including a new distribution center, national advertising campaign, and agreements surrounding the new Staples Center sports arena in Los Angeles.
- International operations, while not yet profitable, showed signs of improved performance and Staples remains committed to investing in their long-term growth.
- Overall, the company is well positioned for continued strong earnings growth in the future through ongoing store expansion and improvements across its business segments.
alltel 1q 07_highlights
- ALLTEL reported increases in key financial metrics for the first quarter of 2007 compared to the same period in 2006. Service revenues grew 14% and wireless operating income increased 21%.
- On a non-GAAP basis, which excludes certain items, operating income from current businesses grew 17% and net income increased 34% compared to the first quarter of 2006. Equity free cash flow grew 36%.
- Total assets decreased 27% compared to the end of 2006, largely due to the sale of ALLTEL's wireline business in 2006.
fr07_is-nongaap
Whole Foods Market reported sales of $1.51 billion for the quarter, up 13% from the previous year. Net income was $49.1 million compared to $53.9 million last year. Earnings per share were $0.35 compared to $0.37 in the previous year. On a non-GAAP basis, excluding one-time natural disaster costs, net income was also $49.1 million and earnings per share remained $0.35.
4Q07EarningsReleaseTABLESPDF
- PPG Industries reported net sales of $2.87 billion for the quarter and $11.2 billion for the year, up compared to the same periods in 2006. Net income was $200 million for the quarter and $834 million for the year.
- By business segment, Performance Coatings and Industrial Coatings experienced the largest sales increases both for the quarter and full year.
- Total current assets at the end of 2007 were $7.14 billion, up from $4.86 billion at the end of 2006, mainly due to increases in cash, short-term investments, and receivables.
whole food market fr08_scf
Whole Foods Market saw an increase in net income over the four quarters from $39 million in Q1 to $113 million for the full year. However, cash flows from operating activities decreased in Q3 as accounts receivable and inventory increased. The company invested heavily in new store development, equipment, and acquisitions, using cash flows from operations and financing activities like long-term borrowing. By the end of the year, cash and cash equivalents had declined to $24.9 million as cash was used for investing activities.
Grant clinic, inc
Grant Clinic, Inc. presented a financial plan with the following key points:
1) A SWOT analysis found strengths in the clinic's profits, working capital, and credit line, but weaknesses in external pressures like rising costs and regulations.
2) External pressures over the next three years include increasing costs, staffing shortages, and regulatory changes. Preventive measures include fundraising, cost control, and strategic planning.
3) The clinic needs 393 additional patients to break even based on its current cost structure and patient volume. A capital budget proposes new equipment purchases.
fr05_scf
Whole Foods Market reported $136 million in net income for the 2005 fiscal year. Cash provided by operating activities was $411 million, which was used to fund $207 million in new store development costs and $116 million in other property and equipment. Cash used in investing activities was $322 million. The company paid out $55 million in dividends to shareholders and used $6 million to repay debt. Cash provided by financing activities was $25 million, resulting in a $114 million increase in total cash and cash equivalents during the year.
Q1 2007 Earnings Release Financial Tables
Motorola reported financial results for Q1 2007, with net sales of $9.4 billion, down slightly from $9.6 billion in Q1 2006. Gross margin declined to $2.5 billion from $2.9 billion. The company had an operating loss of $366 million compared to operating earnings of $849 million in the prior year. On a segment basis, Mobile Devices sales fell 15% while Networks and Enterprise rose 20% and Connected Home Solutions increased 42%. Mobile Devices had an operating loss of $260 million versus earnings of $702 million in 2006.
What's hot (17)
Viewers also liked
fr08_scf
Whole Foods Market saw net income of $113 million in 2008 with cash provided by operating activities of $267 million. They invested $282 million in new store development and $110 million in other property and equipment. Total cash used in investing activities was $252 million. They paid $81 million in dividends and received $174 million from long-term borrowings, with cash provided by financing activities of $9 million and an overall increase in cash of $25 million for the year.
sales visual design 3
This document summarizes three GPS cycling computers from Garmin: the Edge Touring Plus, Edge 1000, and Edge 200. It provides details on the battery life, screen size and resolution, water resistance level, and included features of each. Pricing information is also given, including the manufacturer's suggested retail price and price to retailers. Background information on Garmin is presented, noting it was founded in 1989 in Lenexa, Kansas by Gary Burrell and Min Kao and is currently led by CEO Clifton A. Pemble. A reminder is given to contact sales representatives for more information on GPS products or to check or edit orders online.
אלעד גולדנברג: שנקר - 3 נובמבר 2013 - מיליארד קליקים לא טועים - שירות לקוחות ...
מיליארד קליקים לא טועים
שירות לקוחות באונליין
למה צריך שירות לקוחות
מדוע אנשים נוטשים את עגלת הקניות באונליין
שירות לקוחות כחלק מהמודל העסקי
Pre-Sale
Post-Sale
מושגי ליבה באיקומרס
Checkout Process
Payment Gateway
Authentication
fr06_is-nongaap
Whole Foods Market reported higher sales and net income in 2006 compared to 2005 on a non-GAAP basis. Sales increased 20% to $5.6 billion in 2006 from $4.7 billion in 2005. Net income grew 25% to $201.8 million in 2006 from $160.7 million in 2005, driven by sales growth partially offset by higher operating expenses. Earnings per share increased on both a basic and diluted basis for 2006 compared to 2005 on a non-GAAP basis.
אלעד גולדנברג: עולם וירטואלי, מסחר ממשי - מהפכת הקניות בקליק מתרחשת לנגד עיני...
האיקומרס כבר מזמן כאן והוא צובר תאוצה בשנים האחרונות בארץ ובעולם
יותר ויותר עסקים, יצרנים, קמעונאים, קטנים כגדולים מעוניין לפתח אפיק מכירה גלובלי באונליין
1 - עולם האיקומרס היום
2 - הטרנדים החמים במסחר האלקטרוני
3 - מוכרים ישראלים, סיפורי הצלחה
4 - טיפים להצלחה באיקומרס
מתוך כנס מכירות באמצעות האינטרנט
קרן שמש
מרץ 19 2014
סינמטק תל-אביב
aci.online
ACI Services, Inc. is an expert in reciprocating compressor products and services located in Cambridge, Ohio. They offer custom compressor cylinder design and manufacturing, performance control devices, mechanical field services, spare parts, and compressor performance software. Their products and services are designed to improve compressor performance, minimize costs, and solve operational problems for customers.
CuatroPasos de la INTEGRIDAD DE LA TUBERÍA
TDW ofrece varios productos y servicios para la limpieza, inspección, evaluación no destructiva y aislamiento/reparación de tuberías. Estos incluyen esferas de limpieza, inspección en línea, tecnologías de evaluación como partículas magnéticas y ultrasonido, y perforación en caliente remota y aislamiento doble en bloque para reparaciones. TDW puede ayudar a identificar y mitigar riesgos de integridad, extender la vida útil de los activos y cumplir con estándares a través del
Viewers also liked (7)
אלעד גולדנברג: שנקר - 3 נובמבר 2013 - מיליארד קליקים לא טועים - שירות לקוחות ...
אלעד גולדנברג: שנקר - 3 נובמבר 2013 - מיליארד קליקים לא טועים - שירות לקוחות ...
אלעד גולדנברג: עולם וירטואלי, מסחר ממשי - מהפכת הקניות בקליק מתרחשת לנגד עיני...
אלעד גולדנברג: עולם וירטואלי, מסחר ממשי - מהפכת הקניות בקליק מתרחשת לנגד עיני...
Similar to 2009_IS
Q3 2005 Earnings Release Financial Tables
Motorola reported higher net earnings for the quarter and nine months ended October 1, 2005 compared to the same periods in 2004, driven by increased net sales and gains on sales of investments. Net sales increased 25% for the quarter and 17% for the nine months with growth in all reportable segments, especially mobile devices which grew 41%. Earnings from continuing operations increased 311% for the quarter and 123% for the nine months.
Q1 2006 Earnings Release Financial Tables
Motorola's net sales increased 23% to $10.01 billion in the first quarter of 2006 compared to $8.16 billion in the same period in 2005. Gross margin improved to $3.02 billion in 2006 from $2.66 billion previously. Overall earnings from continuing operations were $686 million in 2006, nearly flat compared to $692 million in 2005. Mobile Devices segment sales grew 45% and operating earnings increased 60% year-over-year.
Q2 2006 Earnings Release Financial Tables
- Motorola reported net earnings of $1.384 billion for Q2 2006, up from $933 million in Q2 2005, with net sales rising 29% to $10.876 billion. Net earnings for the first six months of 2006 were $2.070 billion, up from $1.625 billion in the same period in 2005.
- Mobile device sales increased 46% in Q2 2006 compared to Q2 2005, contributing to a 28% rise in total segment sales. Operating earnings also increased across all segments except networks and enterprise.
- The financial results demonstrated strong growth in Motorola's key metrics compared to the previous year, driven primarily by a large increase in mobile device sales and earnings.
Q1 2005 Earnings Release Financial Tables
- Motorola reported net earnings of $692 million for the quarter ended April 2, 2005, up from $609 million in the previous year. Net sales increased 10% to $8.161 billion.
- Gross margin was $2.67 billion compared to $2.366 billion in 2004. Operating earnings increased to $865 million from $685 million the previous year.
- The Mobile Devices segment saw a 6% increase in net sales and operating earnings of $440 million compared to $406 million in 2004.
Q2 2005 Earnings Release Financial Tables
- Motorola reported net earnings of $933 million for Q2 2005 compared to a net loss of $203 million in Q2 2004, driven by higher sales and gains on investments.
- Net sales increased 17% to $8.825 billion in Q2 2005 from $7.541 billion in Q2 2004, with mobile devices sales growing 24%.
- Earnings per share for continuing operations were $0.38 in Q2 2005 compared to $0.26 in Q2 2004.
el paso 160DAEF8-9761-4AE9-925F-15301F29A4B9_2008_Summary_Report
This document is El Paso Corporation's 2008 annual report which summarizes the company's financial and operating highlights for 2008. It discusses declines in operating income and earnings compared to previous years due to a $2.7 billion non-cash ceiling test charge in its Exploration & Production segment. However, it notes the Pipeline segment placed seven growth projects into service and increased its backlog of committed growth projects to $8 billion. The report provides an overview of accomplishments in 2008 and challenges faced by the company in a difficult market environment.
el paso 160DAEF8-9761-4AE9-925F-15301F29A4B9_2008_Summary_Report
This document summarizes the financial and operating highlights for El Paso Corporation for the years 2008, 2007, and 2006. Some key points include:
- In 2008, El Paso reported a net loss of $860 million compared to net income of $1.073 billion in 2007. Operating revenues were $5.363 billion in 2008.
- Significant non-cash charges in 2008 included $2.7 billion in ceiling test charges for its Exploration & Production segment and a $125 million impairment related to its investment in Four Star.
- Pipeline throughput volumes across El Paso's owned and equity systems increased slightly from 2007 to 2008 but were up overall from 2006 levels. Exploration and production of natural gas declined slightly from
Financial Statements
Microsoft Corporation reported financial results for the quarter and fiscal year ended June 30, 2004. Revenue increased 15% to $9.3 billion for the quarter and 14% to $36.8 billion for the fiscal year. Net income increased 82% to $2.7 billion for the quarter and 9% to $8.2 billion for the fiscal year. Earnings per share increased 79% to $0.25 for the quarter and 9% to $0.76 for the fiscal year. The company's largest segments by revenue were Client, Server and Tools, and Information Worker.
smurfit stone container 2003annual
The document is Smurfit-Stone Container Corporation's 2003 annual report. It summarizes the company's financial performance for 2003, including a net loss of $198 million compared to net income of $59 million in 2002. It also discusses the company's CustomerONE operating philosophy of focusing on customer satisfaction, quality, safety, and environmental responsibility. Smurfit-Stone led the packaging industry in safety performance for the third consecutive year in 2003. However, overall trends in the domestic manufacturing sector depressed demand for packaging in 2003.
smurfit stone container 2003annual
The annual report summarizes Smurfit-Stone Container Corporation's 2003 financial results and business activities. It reports a net loss of $208 million compared to net income of $54 million in 2002, due to pricing pressures, costs increases, and restructuring charges. It discusses steps taken to reduce costs and debt, integrate acquisitions, and adapt marketing strategies to changing customer and retail trends. The report expresses confidence that Smurfit-Stone is well-positioned for 2004 with a focus on sales, marketing, production improvements, and debt reduction.
Class4
Hutchison Whampoa reported a 12% rise in net profit to HK$14.17 billion in 2009, despite a 14% drop in revenue to HK$300.55 billion. Gains from property and asset sales offset losses in its energy and 3G businesses. While losses in 3G operations fell 67%, the division is still dragging on earnings. However, results from property completions and asset sales boosted profits.
allstate Financial Section 2001
Allstate operates a Property-Liability business and a Allstate Financial business. The Property-Liability business saw a decrease in operating income to $1.05 billion due to higher claims expenses, lower investment income, and higher restructuring costs, partially offset by higher premiums and lower catastrophe losses. Net income for Allstate's overall business declined to $1.16 billion due to realized capital losses compared to gains the previous year and the decrease in operating income. Revenues declined slightly to $28.87 billion due to realized capital losses, though this was offset by increased premiums and investment income.
Q4 2005 Earnings Release Financial Tables
Motorola reported higher net sales, earnings, and segment net sales in the fourth quarter and full year of 2005 compared to the same periods in 2004. Net earnings for the fourth quarter of 2005 were $1.202 billion compared to $647 million in 2004. For the full year, net earnings reached $4.578 billion in 2005, up from $1.532 billion in 2004. Mobile Devices and Government & Enterprise Mobility Solutions experienced the strongest sales growth across all segments.
allstate Financial Section 1999
Allstate's revenues increased 4% to $27 billion in 1999. Operating income decreased 19% to $2.1 billion due to higher costs and charges from acquisitions and restructuring. Net income fell 17% to $2.7 billion. Investments grew 5% to $69.6 billion. In Property-Liability, premiums written rose 5% to $20.4 billion and underwriting income decreased 60% to $527 million due to increased losses and expenses.
HENRY SCHEIN 2002AnnualReport
Henry Schein is the largest distributor of healthcare products and services to office-based healthcare practitioners in North America and Europe. In 2002, Henry Schein achieved record financial results with net sales of $2.8 billion, operating income of $196 million, and net income of $117 million. The company expects continued growth through increasing penetration of existing customers, gaining new customers, and cross-selling between its business groups that serve the dental, medical, veterinary, and technology markets.
FirstEnergy Consolidated_Statements_of_Income
Revenues increased from $11.5 billion in 2006 to $12.8 billion in 2007 primarily due to higher electric utility revenues. Operating income increased from $2.6 billion to $2.8 billion between 2006 and 2007. Net income increased from $1.25 billion in 2006 to $1.31 billion in 2007, while basic earnings per share increased from $3.84 to $4.27 over the same period.
whole food market fr08_is
Whole Foods Market reported sales of $6.16 billion for fiscal year 2008 with gross profit of $2.11 billion. Operating income was $213.7 million. Net income for the year was $113 million, or $0.81 per diluted share. The company paid dividends of $0.60 per share for the year.
Similar to 2009_IS (20)
el paso 160DAEF8-9761-4AE9-925F-15301F29A4B9_2008_Summary_Report
el paso 160DAEF8-9761-4AE9-925F-15301F29A4B9_2008_Summary_Report
el paso 160DAEF8-9761-4AE9-925F-15301F29A4B9_2008_Summary_Report
el paso 160DAEF8-9761-4AE9-925F-15301F29A4B9_2008_Summary_Report
el paso 160DAEF8-9761-4AE9-925F-15301F29A4B9_2008_Summary_Report
el paso 160DAEF8-9761-4AE9-925F-15301F29A4B9_2008_Summary_Report
el paso 160DAEF8-9761-4AE9-925F-15301F29A4B9_2008_Summary_Report
el paso 160DAEF8-9761-4AE9-925F-15301F29A4B9_2008_Summary_Report
More from finance44
oshkosh Q106_Presentation
Robert G. Bohn, Chairman, President and CEO of Oshkosh Truck Corporation, and Charles L. Szews, Executive VP and CFO, reported record financial results for the first quarter of fiscal year 2006. Sales increased 22.5% to $790.3 million and operating income grew 28.6% to $87 million. EPS increased 28.6% to $0.72. For fiscal year 2006, the company estimates sales between $3.3-3.4 billion, operating income between $316.5-329 million, and EPS between $2.55-2.65, representing growth of 17-21.6%.
oshkosh Q206_Earnings_Presentation
1) Oshkosh reported record second quarter fiscal year 2006 results with sales up 25.6% and operating income up 27.3% driven by strong performance in the defense segment.
2) The defense segment results nearly doubled compared to the previous year due to growth in remanufactured and new truck sales, however challenges remain in locating used vehicle carcasses for remanufacturing.
3) The fire and emergency segment saw a temporary dip in earnings as anticipated due to heavily weighted airport product sales in the second half of the year and two component issues that delayed revenue recognition.
oshkosh Q306_Presentation
Robert G. Bohn, Chairman, President and CEO of Oshkosh Truck Corporation, discussed the company's strong third quarter fiscal year 2006 results and provided an outlook for fiscal years 2006 and 2007. Some highlights included record sales and operating income for Q3 2006. The company also announced two acquisitions, AK Specialty Vehicles and Iowa Mold Tooling, expected to be accretive to earnings in fiscal 2007. For fiscal 2006, Oshkosh estimates sales growth of 14.9-16.6% and EPS growth of 24-26%. Fiscal 2007 estimates include sales of $3.65-$3.75 billion and EPS of $3.05-$3.15.
OSK_101606
Oshkosh Truck Corporation presented an investor presentation on its proposed acquisition of JLG Industries, Inc. The presentation discussed Oshkosh's track record of successful acquisitions and shareholder value creation. It also outlined the objectives of acquiring JLG to support growth above 15%, diversify into the fast-growing aerial work platform market, and execute its long-term acquisition strategy. Finally, the presentation provided an overview of Oshkosh Truck Corporation and its proven strategy of new product leadership, operational excellence, and strategic acquisitions that have fueled strong sales and earnings growth.
Oshkosh
Robert Bohn, Chairman of Oshkosh Truck Corporation, discussed the company's strong fiscal 2006 financial results and outlook for fiscal 2007. Key points include:
1) Fiscal 2006 sales increased 15.8% and operating income grew 22%, with EPS up 26.6%.
2) The acquisition of JLG Industries was announced, which will diversify the company and support growth of over 15%.
3) Fiscal 2007 stand-alone estimates include sales of $3.65-$3.75 billion and EPS of $3.05-$3.15, with the JLG acquisition expected to be modestly accretive.
oshkosh Q107_Slides
In this earnings call, Oshkosh Truck Corporation discusses its first quarter 2007 results. Sales increased 27.4% to $1.01 billion due to the acquisition of JLG Industries. Operating income decreased 3.9% to $83.6 million and EPS decreased 23.6% to $0.55. The company increased its full-year 2007 EPS estimate range to $3.15 to $3.25 per share. JLG is meeting expectations and integration is progressing well. Defense sales were lower compared to strong prior year results while fire and emergency and commercial saw strong performance.
oshkosh Q207_Slides
This document summarizes an earnings conference call for Oshkosh Truck Corporation for the second quarter of fiscal year 2007. Sales increased 96.6% to $1.66 billion and operating income grew 69.1% to $134.8 million. For fiscal year 2007, the company estimates sales of $6.1-6.2 billion and operating income of $568-580 million. It also provides segment-level results and highlights for access equipment, defense, fire & emergency, and commercial.
oshkosh Q32007slides
1) Oshkosh reported strong third quarter 2007 results with sales increasing 108% to $1.85 billion and operating income up 133% to $192.7 million.
2) Access equipment and defense led the growth in sales and operating income. The acquisition of JLG was accretive to EPS by $0.35 per share.
3) For fiscal year 2007, Oshkosh estimates sales between $6.3-6.35 billion and EPS between $3.35-3.40, and for fiscal year 2008 estimates sales between $7-7.2 billion and EPS between $4.15-4.35.
oshkosh Q407_Earnings
The document summarizes Oshkosh Truck Corporation's fourth quarter fiscal 2007 earnings conference call. It discusses record sales and operating income for fiscal 2007. Projections are provided for fiscal 2008, estimating sales between $7.1-7.3 billion and operating income between $690-715 million. Segment performances are reviewed, with access equipment and defense highlighted as key growth drivers. Estimates are also given for interest expense, tax rates, capital expenditures and debt levels for fiscal 2008.
oshkosh Q108_earnings_slides
Oshkosh Corporation held an earnings conference call to discuss its first quarter fiscal year 2008 results. Sales increased 49% to $1.5 billion due to strong growth in access equipment and defense, while earnings per share declined 9.1% to $0.50. For fiscal year 2008, the company estimates revenue of $7.1-7.3 billion, operating income of $675-700 million, and earnings per share of $4.15-4.35. Challenging economic conditions are impacting commercial and fire & emergency segments, but global initiatives and cost reductions will support the full-year outlook.
oshkosh Q208_Slides
The document summarizes Oshkosh Corporation's earnings conference call for the second quarter of fiscal year 2008. Key highlights include sales increasing 6.7% to $1.8 billion and operating income rising 24.8% to $168.2 million. EPS grew 42.6% to $0.97. While access equipment and defense saw strong demand, commercial and fire & emergency faced challenging market conditions. The company maintained its fiscal year 2008 EPS estimate range of $4.15 to $4.35.
oshkosh Q308_Slides
The document summarizes Oshkosh Corporation's earnings conference call for the third quarter of fiscal year 2008. It discusses increases in sales revenue but decreases in operating income and earnings per share compared to the previous year. Several initiatives are mentioned to manage costs and cash flow in changing market conditions. Business segment results are provided, with strength in access equipment and defense but challenges in commercial and fire & emergency sectors.
OSK_Q4_2008_Earnings_Release_Slides
This document is the transcript from Oshkosh Corporation's earnings conference call for the fourth quarter of fiscal year 2008. It discusses Oshkosh's financial results for Q4 and fiscal year 2008, including sales, operating income, earnings per share, and debt reduction. It also provides an outlook for fiscal year 2009, estimating revenues of $6.3-6.7 billion, operating income of $350-400 million, and EPS of $1.65-2.05. The transcript reviews performance and outlook for each of Oshkosh's business segments and discusses its financing plans.
oshkosh Goldman_110508
Robert Bohn and David Sagehorn of Oshkosh Corporation gave a presentation at the Goldman Sachs Conference in November 2008. They discussed Oshkosh's strong financial position and actions taken to reduce costs and debt. While market conditions were volatile due to the economic downturn, Oshkosh was well positioned with backlogs in defense, fire, and refuse collection vehicles. The presentation outlined Oshkosh's segments and strategies to manage through the difficult economy.
oshkosh Baird_111208
1) The document is from a presentation given by Oshkosh executives Charles Szews and David Sagehorn at the R.W. Baird Industrial Conference on November 12, 2008.
2) Oshkosh reported sales increased 13.2% to $7.1 billion in fiscal 2008, with international sales reaching $2.1 billion. However, operating income decreased 1.5% and EPS decreased 5.9% due to non-cash impairment charges.
3) Oshkosh recently secured multiple defense contracts and sees opportunities in the domestic refuse collection vehicle market, but the current market volatility and credit crisis make fiscal 2009 projections difficult given exposure to construction and municipal spending.
oshkosh B9FAB733-F810-4AE7-A95B-4388C6B08318_Cowen_020509
Charles Szews, President and COO of Oshkosh Corporation, presented at the Cowen and Company Aerospace & Defense Conference on February 5, 2009. He discussed Oshkosh's business segments, products, competitive advantages, challenges, and actions taken in response to the economic downturn. Key points included reduced revenues and earnings in Q1 2009, cost reduction efforts, and focus on core businesses with strong backlogs like defense and fire apparatus that have gained market share.
oshkosh Q108_earnings_slides
Oshkosh Corporation held an earnings conference call to discuss its first quarter fiscal year 2008 results. Sales increased 49% to $1.5 billion due to strong growth in access equipment and defense, while earnings per share declined 9.1% to $0.50. For fiscal year 2008, the company estimates revenue of $7.1-7.3 billion, operating income of $675-700 million, and earnings per share of $4.15-4.35. Challenging economic conditions are impacting commercial and fire & emergency segments, but global initiatives and cost reductions will support the full-year outlook.
oshkosh Q208_Slides
The document summarizes Oshkosh Corporation's earnings conference call for the second quarter of fiscal year 2008. Key highlights include sales increasing 6.7% to $1.8 billion and operating income rising 24.8% to $168.2 million. EPS grew 42.6% to $0.97. While access equipment and defense saw strong demand, commercial and fire & emergency faced challenging market conditions. The company maintained its fiscal year 2008 EPS estimate range of $4.15 to $4.35.
oshkosh Q308_Slides
This document contains the transcript from Oshkosh Corporation's earnings conference call for the third quarter of fiscal year 2008. Key highlights include a 6.6% increase in quarterly sales to $1.97 billion but a 5.9% decrease in operating income to $181.2 million. EPS for the quarter decreased 1.7% to $1.19. Oshkosh revised its estimate for full year 2008 EPS to a range of $3.15 to $3.30.
oshkosh OSK_Q4_2008_Earnings_Release_Slides
This document summarizes an earnings conference call for Oshkosh Corporation for the fourth quarter of fiscal year 2008. It discusses the company's financial results including a 5.8% increase in sales to $1.9 billion but a 32% decrease in operating income to $122 million. The document also provides an overview of Oshkosh's fiscal year 2008 results and discusses challenges faced in various business segments due to economic conditions. It notes actions taken by the company to reduce costs and debt. An outlook is given for fiscal year 2009 noting market volatility and a plan to drive over $500 million in debt reduction. Business segment results and outlooks are also summarized.
More from finance44 (20)
oshkosh B9FAB733-F810-4AE7-A95B-4388C6B08318_Cowen_020509
oshkosh B9FAB733-F810-4AE7-A95B-4388C6B08318_Cowen_020509
Recently uploaded
How to Invest in Cryptocurrency for Beginners: A Complete Guide
Cryptocurrency is digital money that operates independently of a central authority, utilizing cryptography for security. Unlike traditional currencies issued by governments (fiat currencies), cryptocurrencies are decentralized and typically operate on a technology called blockchain. Each cryptocurrency transaction is recorded on a public ledger, ensuring transparency and security.
Cryptocurrencies can be used for various purposes, including online purchases, investment opportunities, and as a means of transferring value globally without the need for intermediaries like banks.
Exploring-Madhya-Pradesh-Culture-Heritage-and-Land-Records.pptx
Madhya Pradesh, the "Heart of India," boasts a rich tapestry of culture and heritage, from ancient dynasties to modern developments. Explore its land records, historical landmarks, and vibrant traditions. From agricultural expanses to urban growth, Madhya Pradesh offers a unique blend of the ancient and modern.
Pension Playpen - TAS300 v2 maths and governance resets pension strategies (3...
C-Suite Pension PlayPen presentation
Chapter 25: Economic Growth Summary from Samuelson and Nordhaus
akdlajdljalkdjklajdklajlsdjlasjdlajdslajldjaldjalsjdlkajskldaldkj
What Lessons Can New Investors Learn from Newman Leech’s Success?
Newman Leech's success in the real estate industry is based on key lessons and principles, offering practical advice for new investors and serving as a blueprint for building a successful career.
Singapore 2024 Sustainability Reporting and Accountancy Education Slides
Singapore 2024 Sustainability Reporting and Accountancy Education SlidesInternational Federation of Accountants
Singapore 2024 Sustainability Reporting and Accountancy Education Slides一比一原版(cwu毕业证书)美国中央华盛顿大学毕业证如何办理
原版一模一样【微信:741003700 】【(cwu毕业证书)美国中央华盛顿大学毕业证成绩单】【微信:741003700 】学位证,留信认证(真实可查,永久存档)原件一模一样纸张工艺/offer、雅思、外壳等材料/诚信可靠,可直接看成品样本,帮您解决无法毕业带来的各种难题!外壳,原版制作,诚信可靠,可直接看成品样本。行业标杆!精益求精,诚心合作,真诚制作!多年品质 ,按需精细制作,24小时接单,全套进口原装设备。十五年致力于帮助留学生解决难题,包您满意。
本公司拥有海外各大学样板无数,能完美还原。
1:1完美还原海外各大学毕业材料上的工艺:水印,阴影底纹,钢印LOGO烫金烫银,LOGO烫金烫银复合重叠。文字图案浮雕、激光镭射、紫外荧光、温感、复印防伪等防伪工艺。材料咨询办理、认证咨询办理请加学历顾问Q/微741003700
【主营项目】
一.毕业证【q微741003700】成绩单、使馆认证、教育部认证、雅思托福成绩单、学生卡等!
二.真实使馆公证(即留学回国人员证明,不成功不收费)
三.真实教育部学历学位认证(教育部存档!教育部留服网站永久可查)
四.办理各国各大学文凭(一对一专业服务,可全程监控跟踪进度)
如果您处于以下几种情况:
◇在校期间,因各种原因未能顺利毕业……拿不到官方毕业证【q/微741003700】
◇面对父母的压力,希望尽快拿到;
◇不清楚认证流程以及材料该如何准备;
◇回国时间很长,忘记办理;
◇回国马上就要找工作,办给用人单位看;
◇企事业单位必须要求办理的
◇需要报考公务员、购买免税车、落转户口
◇申请留学生创业基金
留信网认证的作用:
1:该专业认证可证明留学生真实身份
2:同时对留学生所学专业登记给予评定
3:国家专业人才认证中心颁发入库证书
4:这个认证书并且可以归档倒地方
5:凡事获得留信网入网的信息将会逐步更新到个人身份内,将在公安局网内查询个人身份证信息后,同步读取人才网入库信息
6:个人职称评审加20分
7:个人信誉贷款加10分
8:在国家人才网主办的国家网络招聘大会中纳入资料,供国家高端企业选择人才
办理(cwu毕业证书)美国中央华盛顿大学毕业证【微信:741003700 】外观非常简单,由纸质材料制成,上面印有校徽、校名、毕业生姓名、专业等信息。
办理(cwu毕业证书)美国中央华盛顿大学毕业证【微信:741003700 】格式相对统一,各专业都有相应的模板。通常包括以下部分:
校徽:象征着学校的荣誉和传承。
校名:学校英文全称
授予学位:本部分将注明获得的具体学位名称。
毕业生姓名:这是最重要的信息之一,标志着该证书是由特定人员获得的。
颁发日期:这是毕业正式生效的时间,也代表着毕业生学业的结束。
其他信息:根据不同的专业和学位,可能会有一些特定的信息或章节。
办理(cwu毕业证书)美国中央华盛顿大学毕业证【微信:741003700 】价值很高,需要妥善保管。一般来说,应放置在安全、干燥、防潮的地方,避免长时间暴露在阳光下。如需使用,最好使用复印件而不是原件,以免丢失。
综上所述,办理(cwu毕业证书)美国中央华盛顿大学毕业证【微信:741003700 】是证明身份和学历的高价值文件。外观简单庄重,格式统一,包括重要的个人信息和发布日期。对持有人来说,妥善保管是非常重要的。
Accounting Information Systems (AIS).pptx
An accounting information system (AIS) refers to tools and systems designed for the collection and display of accounting information so accountants and executives can make informed decisions.
Governor Olli Rehn: Inflation down and recovery supported by interest rate cu...
Governor Olli Rehn
Bank of Finland
Press conference on the outlook for the Finnish economy
Helsinki, 11 June 2024
13 Jun 24 ILC Retirement Income Summit - slides.pptx
ILC's Retirement Income Summit was hosted by M&G and supported by Canada Life. The event brought together key policymakers, influencers and experts to help identify policy priorities for the next Government and ensure more of us have access to a decent income in retirement.
Contributors included:
Jo Blanden, Professor in Economics, University of Surrey
Clive Bolton, CEO, Life Insurance M&G Plc
Jim Boyd, CEO, Equity Release Council
Molly Broome, Economist, Resolution Foundation
Nida Broughton, Co-Director of Economic Policy, Behavioural Insights Team
Jonathan Cribb, Associate Director and Head of Retirement, Savings, and Ageing, Institute for Fiscal Studies
Joanna Elson CBE, Chief Executive Officer, Independent Age
Tom Evans, Managing Director of Retirement, Canada Life
Steve Groves, Chair, Key Retirement Group
Tish Hanifan, Founder and Joint Chair of the Society of Later life Advisers
Sue Lewis, ILC Trustee
Siobhan Lough, Senior Consultant, Hymans Robertson
Mick McAteer, Co-Director, The Financial Inclusion Centre
Stuart McDonald MBE, Head of Longevity and Democratic Insights, LCP
Anusha Mittal, Managing Director, Individual Life and Pensions, M&G Life
Shelley Morris, Senior Project Manager, Living Pension, Living Wage Foundation
Sarah O'Grady, Journalist
Will Sherlock, Head of External Relations, M&G Plc
Daniela Silcock, Head of Policy Research, Pensions Policy Institute
David Sinclair, Chief Executive, ILC
Jordi Skilbeck, Senior Policy Advisor, Pensions and Lifetime Savings Association
Rt Hon Sir Stephen Timms, former Chair, Work & Pensions Committee
Nigel Waterson, ILC Trustee
Jackie Wells, Strategy and Policy Consultant, ILC Strategic Advisory Board
Budgeting as a Control Tool in Govt Accounting in Nigeria Prof Oyedokun.pptx
Budgeting as a Control Tool in Govt Accounting in Nigeria Prof Oyedokun.pptxGodwin Emmanuel Oyedokun MBA MSc PhD FCA FCTI FCNA CFE FFAR
Budgeting as a Control Tool in Government Accounting in Nigeria
Being a Paper Presented at the Nigerian Maritime Administration and Safety Agency (NIMASA) Budget Office Staff at Sojourner Hotel, GRA, Ikeja Lagos on Saturday 8th June, 2024.
Enhanced metrics to measure the Regulatory impact
A proposal to enhance metric used when calculating business compliance costs
Seeman_Fiintouch_LLP_Newsletter_Jun_2024.pdf
The Impact of the 2024 Indian
Election Beyond Borders
01. Investment Gyan
02. Market Update
03. Inspiration investment story
Navigating Your Financial Future: Comprehensive Planning with Mike Baumann
Learn how financial planner Mike Baumann helps individuals and families articulate their financial aspirations and develop tailored plans. This presentation delves into budgeting, investment strategies, retirement planning, tax optimization, and the importance of ongoing plan adjustments.
Poonawalla Fincorp’s Strategy to Achieve Industry-Leading NPA Metrics
Poonawalla Fincorp Limited, under the leadership of Managing Director Abhay Bhutada, has achieved industry-leading Gross Non-Performing Assets (GNPA) below 1% and Net Non-Performing Assets (NNPA) below 0.5% as of May 31, 2024. This success is attributed to a strategic vision focusing on prudent credit policies, robust risk management, and digital transformation. Bhutada's leadership has driven the company to exceed its targets ahead of schedule, emphasizing rigorous credit assessment, advanced risk management, and enhanced collection efficiency. By prioritizing customer-centric solutions, leveraging digital innovation, and maintaining strong financial performance, Poonawalla Fincorp sets new benchmarks in the industry. With a continued focus on asset quality, digital enhancement, and exploring growth opportunities, the company is well-positioned for sustained success in the future.
KYC Compliance: A Cornerstone of Global Crypto Regulatory Frameworks
This presentation explores the pivotal role of KYC compliance in shaping and enforcing global regulations within the dynamic landscape of cryptocurrencies. Dive into the intricate connection between KYC practices and the evolving legal frameworks governing the crypto industry.
Recently uploaded (20)
How to Invest in Cryptocurrency for Beginners: A Complete Guide
How to Invest in Cryptocurrency for Beginners: A Complete Guide
Exploring-Madhya-Pradesh-Culture-Heritage-and-Land-Records.pptx
Exploring-Madhya-Pradesh-Culture-Heritage-and-Land-Records.pptx
Pension Playpen - TAS300 v2 maths and governance resets pension strategies (3...
Pension Playpen - TAS300 v2 maths and governance resets pension strategies (3...
Chapter 25: Economic Growth Summary from Samuelson and Nordhaus
Chapter 25: Economic Growth Summary from Samuelson and Nordhaus
What Lessons Can New Investors Learn from Newman Leech’s Success?
What Lessons Can New Investors Learn from Newman Leech’s Success?
The-National-Commission-for-Culture-and-the-Arts.ppt
The-National-Commission-for-Culture-and-the-Arts.ppt
Singapore 2024 Sustainability Reporting and Accountancy Education Slides
Singapore 2024 Sustainability Reporting and Accountancy Education Slides
Governor Olli Rehn: Inflation down and recovery supported by interest rate cu...
Governor Olli Rehn: Inflation down and recovery supported by interest rate cu...
13 Jun 24 ILC Retirement Income Summit - slides.pptx
13 Jun 24 ILC Retirement Income Summit - slides.pptx
Presentation on recent trends in financial system .pptx
Presentation on recent trends in financial system .pptx
Budgeting as a Control Tool in Govt Accounting in Nigeria Prof Oyedokun.pptx
Budgeting as a Control Tool in Govt Accounting in Nigeria Prof Oyedokun.pptx
Navigating Your Financial Future: Comprehensive Planning with Mike Baumann
Navigating Your Financial Future: Comprehensive Planning with Mike Baumann
Poonawalla Fincorp’s Strategy to Achieve Industry-Leading NPA Metrics
Poonawalla Fincorp’s Strategy to Achieve Industry-Leading NPA Metrics
KYC Compliance: A Cornerstone of Global Crypto Regulatory Frameworks
KYC Compliance: A Cornerstone of Global Crypto Regulatory Frameworks
2009_IS
- 1. Whole Foods Market, Inc. Consolidated Quarterly Statements of Operations (In thousands, except per share amounts) 1st Qtr 2nd Qtr 3rd Qtr 4th Qtr YTD January 18, April 12, July 05, September 27, Fiscal Year 2009 2009 2009 2009 2009 2009 Sales $ 2,466,503 $ 2,466,503 Cost of goods sold and occupancy costs 1,643,785 1,643,785 Gross profit 822,718 822,718 Direct store expenses 653,974 653,974 Store contribution 168,744 168,744 General and administrative expenses 82,600 82,600 Operating income before pre-opening and store closure 86,144 86,144 Pre-opening expenses 14,064 14,064 Relocation, store closure and lease termination costs 5,077 5,077 Operating income 67,003 67,003 Interest expense (13,580) (13,580) Investment and other income 1,841 1,841 Income before income taxes 55,264 55,264 Provision for income taxes 22,935 22,935 Net income 32,329 32,329 Preferred stock dividends 4,533 4,533 Income available to common shareholders $ 27,796 $ 27,796 Basic earnings per share $ 0.20 $ 0.20 Weighted average shares outstanding 140,330 140,330 Diluted earnings per share $ 0.20 $ 0.20 Weighted average shares outstanding, diluted basis 140,330 140,330 Common dividends declared per share $ - $ - The notes in the company's Form 10K for fiscal year 2008 are an integral part of these condensed consolidated financial statements.