![Availability of Electronic Usage Data is Still Limited (DBS 2007) Compiled from Data downloaded from: http://www.bibliotheksstatistik.de/eingabe/dynrep/index.php [2009-04-15]](https://image.slidesharecdn.com/2009eusagestats-libmeterzbw-hhworkshop-091118052856-phpapp01/85/2009-E-Usage-Stats-LibMeter-Zbw-Hh-Workshop-14-320.jpg)
![VarB: Comparing and Visualizing Annual Stats Changes between Library Types Author‘s own Meta-Statistics Research Experimental Framework (Excerpt) Source: Author‘s Calculation Framework; anonymized data 3,6% 10,7% 10,5% Median Change Variablitiy 2,4% 0,46 2,4% 10,3% 0,39 10,1% Average Change of Median 1 18% 0,33 +13% 5 11% 0,35 +10% Indicator K 1% 0,67 +2% -18% 0,64 -29% Indicator J -2% 0,46 -2% 3 16% 0,36 +14% Indicator I 4 10% 0,53 +11% 4 15% 0,50 +19% Indicator H Dimension III 2 13% 0,38 +11% 1 23% 0,42 +25% Indicator G 3 11% 0,40 +9% -4% 0,44 -5% Indicator F -2% 0,54 -2% 7% 0,32 +6% Indicator E Dimension II -3% 0,09 -1% 5% 0,07 +1% Indicator D 6% 0,62 +7% 10% 0,60 +15% Indicator C -1% 0,59 -2% 11% 0,40 +11% Indicator B 5 7% 0,60 +9% 11% 0,39 +11% Indicator A Dimension I Dyna-mic-Rank Trend Indi- cator cf. Def. Var Coeff [VC] 2009 Trend- Par. A Median Chng.% [MÄ-A] Dyna-mic-Rank Trend Indi- cator cf. Def. Var Coeff [VC] 2009 Trend- Par. A Median Chng % [MÄ-A] Library Indicator Medians Change from Year n to Year n+1 Dimension Dynamics Lib Group Y Dynamics Lib Group X](https://image.slidesharecdn.com/2009eusagestats-libmeterzbw-hhworkshop-091118052856-phpapp01/85/2009-E-Usage-Stats-LibMeter-Zbw-Hh-Workshop-18-320.jpg)
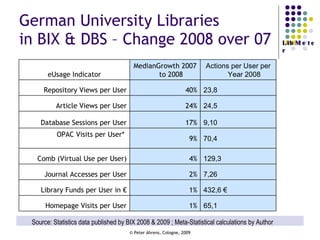
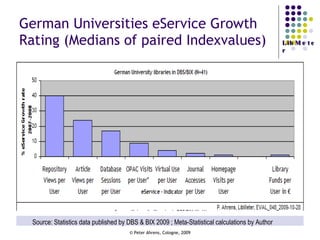
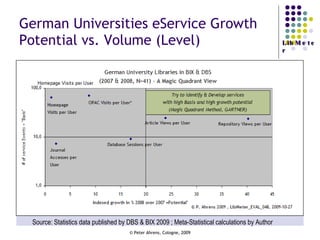
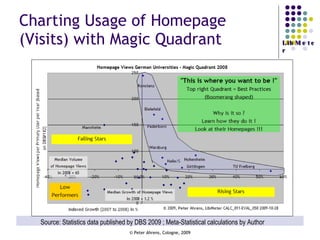
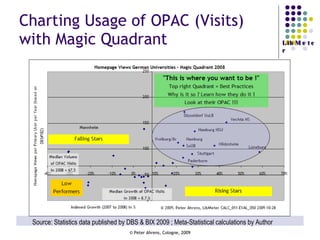
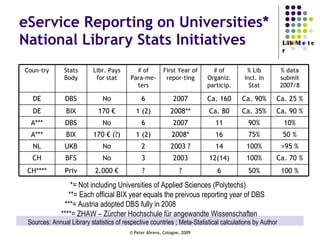
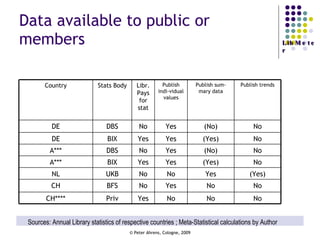
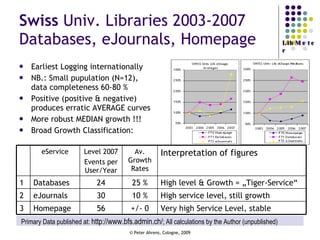
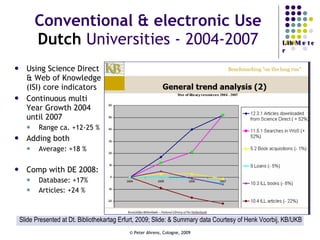

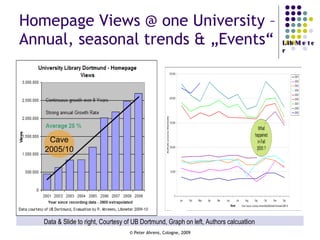
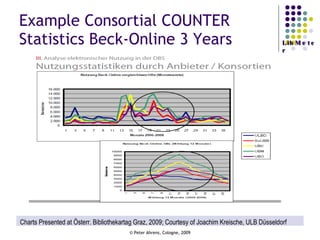
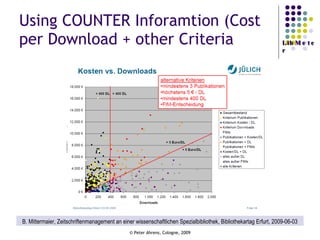
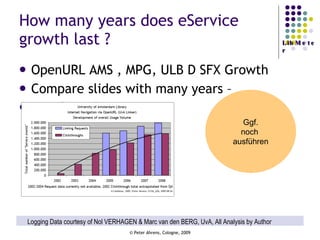
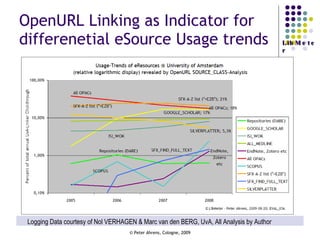
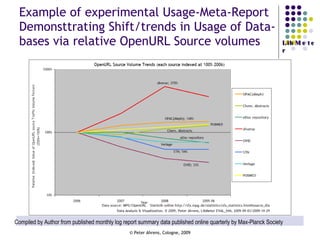
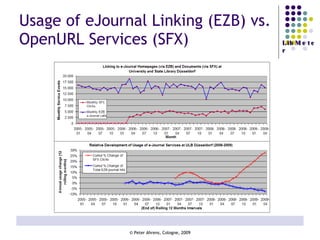
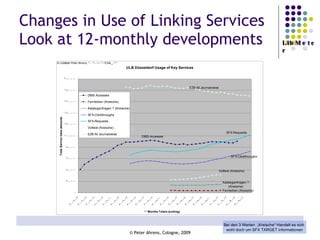

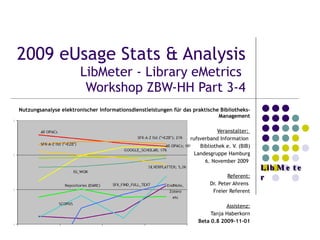
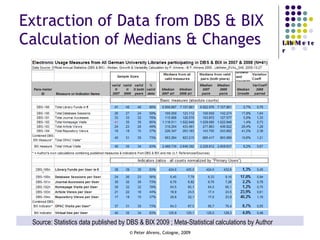
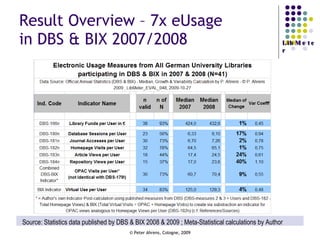
The document provides an analysis of electronic usage statistics in libraries, highlighting trends in user engagement with various digital services from 2007 to 2008. It focuses on the methodological challenges of data collection and interpretation, specifically in the context of measuring usage parameters like homepage visits, database sessions, and article accesses. The findings aim to stimulate further research and discussion on the effectiveness of electronic information services in university settings.


