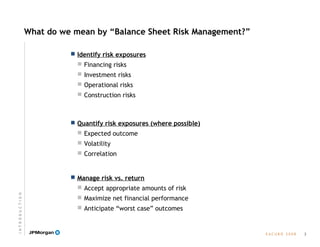
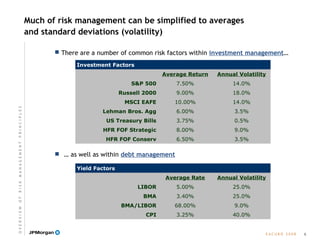
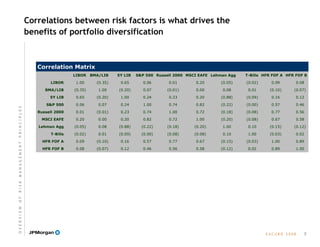
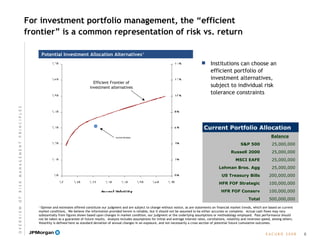
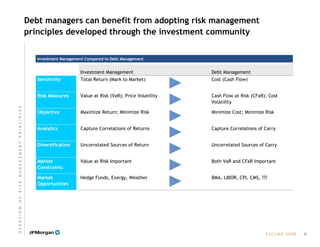
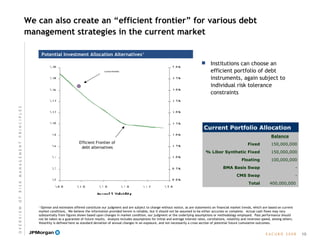
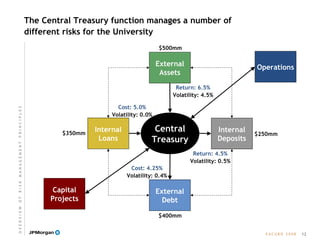
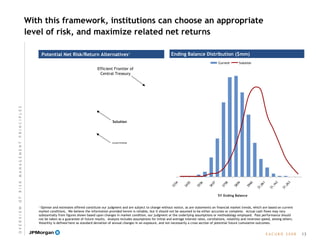
SlideShare a Scribd company logo
M A R C H   2 0 0 8
C R E A T I N G   S U P E R I O R   B A L A N C E   S H E E T   R I S K   M A N A G E M E N T   S O L U T I O N S
2008 EACUBO Annual Workshop
S T R I C T L Y  P R I V A T E  A N D  C O N F I D E N T I A L
E A C U B O   2 0 0 8
l
This presentation was prepared exclusively for the benefit and internal use of the JPMorgan client to whom it is directly addressed and delivered (including
such client’s subsidiaries, the “Company”) in order to assist the Company in evaluating, on a preliminary basis, the feasibility of a possible transaction or
transactions and does not carry any right of publication or disclosure, in whole or in part, to any other party. This presentation is for discussion purposes
only and is incomplete without reference to, and should be viewed solely in conjunction with, the oral briefing provided by JPMorgan. Neither this
presentation nor any of its contents may be disclosed or used for any other purpose without the prior written consent of JPMorgan.
The information in this presentation is based upon any management forecasts supplied to us and reflects prevailing conditions and our views as of this date,
all of which are accordingly subject to change. JPMorgan’s opinions and estimates constitute JPMorgan’s judgment and should be regarded as indicative,
preliminary and for illustrative purposes only. In preparing this presentation, we have relied upon and assumed, without independent verification, the
accuracy and completeness of all information available from public sources or which was provided to us by or on behalf of the Company or which was
otherwise reviewed by us. In addition, our analyses are not and do not purport to be appraisals of the assets, stock, or business of the Company or any
other entity. JPMorgan makes no representations as to the actual value which may be received in connection with a transaction nor the legal, tax or
accounting effects of consummating a transaction. Unless expressly contemplated hereby, the information in this presentation does not take into account
the effects of a possible transaction or transactions involving an actual or potential change of control, which may have significant valuation and other
effects.
Notwithstanding anything herein to the contrary, the Company and each of its employees, representatives or other agents may disclose to any and all
persons, without limitation of any kind, the U.S. federal and state income tax treatment and the U.S. federal and state income tax structure of the
transactions contemplated hereby and all materials of any kind (including opinions or other tax analyses) that are provided to the Company relating to such
tax treatment and tax structure insofar as such treatment and/or structure relates to a U.S. federal or state income tax strategy provided to the Company
by JPMorgan.
JPMorgan’s policies prohibit employees from offering, directly or indirectly, a favorable research rating or specific price target, or offering to change a
rating or price target, to a subject company as consideration or inducement for the receipt of business or for compensation. JPMorgan also prohibits its
research analysts from being compensated for involvement in investment banking transactions except to the extent that such participation is intended to
benefit investors.
IRS Circular 230 Disclosure: JPMorgan Chase & Co. and its affiliates do not provide tax advice. Accordingly, any discussion of U.S. tax matters
included herein (including any attachments) is not intended or written to be used, and cannot be used, in connection with the promotion, marketing
or recommendation by anyone not affiliated with JPMorgan Chase & Co. of any of the matters addressed herein or for the purpose of avoiding U.S.
tax-related penalties.
JPMorgan is a marketing name for investment banking businesses of JPMorgan Chase & Co. and its subsidiaries worldwide. Securities, syndicated loan
arranging, financial advisory and other investment banking activities are performed by a combination of J.P. Morgan Securities Inc., J.P. Morgan plc,
J.P. Morgan Securities Ltd. and the appropriately licensed subsidiaries of JPMorgan Chase & Co. in Asia-Pacific, and lending, derivatives and other
commercial banking activities are performed by JPMorgan Chase Bank, N.A. JPMorgan deal team members may be employees of any of the foregoing
entities.
This presentation does not constitute a commitment by any JPMorgan entity to underwrite, subscribe for or place any securities or to extend or arrange
credit or to provide any other services.
C R E A T I N G  S U P E R I O R  B A L A N C E  S H E E T  R I S K  M A N A G E M E N T  S O L U T I O N S
Agenda
Page
E A C U B O   2 0 0 8
Treasury Management at University of Pennsylvania
Internal Bank Management at University of Virginia
Overview of Risk Management Principles
Introduction
1
1
5
15
24
C R E A T I N G  S U P E R I O R  B A L A N C E  S H E E T  R I S K  M A N A G E M E N T  S O L U T I O N S
E A C U B O   2 0 0 8
Today’s panelists
Helen Kreider, University of Pennsylvania
 INSERT BRIEF BIO
Jim Matteo, University of Virginia
 Director of Treasury Operations since August 2005, responsible for debt
management, banking & cash management, investment portfolio oversight, liquidity
& interest rate management
Charlie Giffin, JPMorgan
 Co-Head of Issuer Solutions group within Tax Exempt Capital Markets, with specialty
in enterprise risk management, market analytics, and integrated solutions across
different markets
2
I N T R O D U C T I O N
E A C U B O   2 0 0 8
What do we mean by “Balance Sheet Risk Management?”
 Identify risk exposures
 Financing risks
 Investment risks
 Operational risks
 Construction risks
 Quantify risk exposures (where possible)
 Expected outcome
 Volatility
 Correlation
 Manage risk vs. return
 Accept appropriate amounts of risk
 Maximize net financial performance
 Anticipate “worst case” outcomes
3
I N T R O D U C T I O N
E A C U B O   2 0 0 8
The danger of what we don’t yet know
“With these advances in technology, lenders have taken advantage of credit-scoring
models and other techniques for efficiently extending credit to a broader spectrum
of consumers. …Where once more-marginal applicants would simply have been
denied credit, lenders are now able to quite efficiently judge the risk posed by
individual applicants and to price that risk appropriately. These improvements
have led to rapid growth in subprime mortgage lending; indeed, today subprime
mortgages account for roughly 10 percent of the number of all mortgages
outstanding, up from just 1 or 2 percent in the early 1990s.”
- Alan Greenspan, April 5, 2005
“We are all wrong so often that it amazes me that we can have any conviction at all
over the direction of things to come. But we must.”
- Jim Cramer, CNBC
“It's tough to make predictions, especially about the future.”
- Yogi Berra
4
I N T R O D U C T I O N
Agenda
Page
E A C U B O   2 0 0 8
Treasury Management at University of Pennsylvania
Internal Bank Management at University of Virginia
Overview of Risk Management Principles
Introduction
5
1
5
15
24
C R E A T I N G  S U P E R I O R  B A L A N C E  S H E E T  R I S K  M A N A G E M E N T  S O L U T I O N S
E A C U B O   2 0 0 8
Much of risk management can be simplified to averages
and standard deviations (volatility)
 There are a number of common risk factors within investment management…
Investment Factors
Average Return Annual Volatility
S&P 500 7.50% 14.0%
Russell 2000 9.00% 18.0%
MSCI EAFE 10.00% 14.0%
Lehman Bros. Agg 6.00% 3.5%
US Treasury Bills 3.75% 0.5%
HFR FOF Strategic 8.00% 9.0%
HFR FOF Conserv 6.50% 3.5%
Yield Factors
Average Rate Annual Volatility
LIBOR 5.00% 25.0%
BMA 3.40% 25.0%
BMA/LIBOR 68.00% 9.0%
CPI 3.25% 40.0%
 … as well as within debt management
6
O V E R V I E W  O F  R I S K  M A N A G E M E N T  P R I N C I P L E S
E A C U B O   2 0 0 8
Correlations between risk factors is what drives the
benefits of portfolio diversification
Correlation Matrix
LIBOR BMA/LIB 5Y LIB S&P 500 Russell 2000 MSCI EAFE Lehman Agg T-Bills HFR FOF A HFR FOF B
LIBOR 1.00 (0.35) 0.65 0.06 0.01 0.20 (0.05) (0.02) 0.09 0.08
BMA/LIB (0.35) 1.00 (0.20) 0.07 (0.01) 0.00 0.08 0.01 (0.10) (0.07)
5Y LIB 0.65 (0.20) 1.00 0.24 0.23 0.20 (0.88) (0.09) 0.16 0.12
S&P 500 0.06 0.07 0.24 1.00 0.74 0.82 (0.22) (0.00) 0.57 0.46
Russell 2000 0.01 (0.01) 0.23 0.74 1.00 0.72 (0.18) (0.08) 0.77 0.56
MSCI EAFE 0.20 0.00 0.20 0.82 0.72 1.00 (0.20) (0.08) 0.67 0.58
Lehman Agg (0.05) 0.08 (0.88) (0.22) (0.18) (0.20) 1.00 0.10 (0.15) (0.12)
T-Bills (0.02) 0.01 (0.09) (0.00) (0.08) (0.08) 0.10 1.00 (0.03) 0.02
HFR FOF A 0.09 (0.10) 0.16 0.57 0.77 0.67 (0.15) (0.03) 1.00 0.89
HFR FOF B 0.08 (0.07) 0.12 0.46 0.56 0.58 (0.12) 0.02 0.89 1.00
7
O V E R V I E W  O F  R I S K  M A N A G E M E N T  P R I N C I P L E S
E A C U B O   2 0 0 8
For investment portfolio management, the “efficient
frontier” is a common representation of risk vs. return
Potential Investment Allocation Alternatives1Potential Investment Allocation Alternatives1
1
Opinion and estimates offered constitute our judgment and are subject to change without notice, as are statements on financial market trends, which are based on current
market conditions. We believe the information provided herein is reliable, but it should not be assumed to be either accurate or complete. Actual cash flows may vary
substantially from figures shown based upon changes in market condition, our judgment or the underlying assumptions or methodology employed. Past performance should
not be taken as a guarantee of future results. Analysis includes assumptions for initial and average interest rates, correlations, volatility and reversion speed, among others.
Volatility is defined here as standard deviation of annual changes in an exposure, and not necessarily a cross section of potential future cumulative outcomes.
Current Portfolio
Efficient Frontier of
investment alternatives
Current Portfolio Allocation
Balance
S&P 500 25,000,000
Russell 2000 25,000,000
MSCI EAFE 25,000,000
Lehman Bros. Agg 25,000,000
US Treasury Bills 200,000,000
HFR FOF Strategic 100,000,000
HFR FOF Conserv 100,000,000
Total 500,000,000
 Institutions can choose an
efficient portfolio of
investment alternatives,
subject to individual risk
tolerance constraints
8
O V E R V I E W  O F  R I S K  M A N A G E M E N T  P R I N C I P L E S
E A C U B O   2 0 0 8
Debt managers can benefit from adopting risk management
principles developed through the investment community
Investment Management Debt Management
Sensitivity Total Return (Mark to Market) Cost (Cash Flow)
Risk Measures Value at Risk (VaR); Price Volatility Cash Flow at Risk (CFaR); Cost
Volatility
Objective Maximize Return; Minimize Risk Minimize Cost; Minimize Risk
Analytics Capture Correlations of Returns Capture Correlations of Carry
Diversification Uncorrelated Sources of Return Uncorrelated Sources of Carry
Market
Constraints
Value at Risk Important Both VaR and CFaR Important
Market
Opportunities
Hedge Funds, Energy, Weather BMA, LIBOR, CPI, CMS, ???
Investment Management Compared to Debt Management
9
O V E R V I E W  O F  R I S K  M A N A G E M E N T  P R I N C I P L E S
E A C U B O   2 0 0 8
We can also create an “efficient frontier” for various debt
management strategies in the current market
Potential Investment Allocation Alternatives1Potential Investment Allocation Alternatives1
1
Opinion and estimates offered constitute our judgment and are subject to change without notice, as are statements on financial market trends, which are based on current
market conditions. We believe the information provided herein is reliable, but it should not be assumed to be either accurate or complete. Actual cash flows may vary
substantially from figures shown based upon changes in market condition, our judgment or the underlying assumptions or methodology employed. Past performance should
not be taken as a guarantee of future results. Analysis includes assumptions for initial and average interest rates, correlations, volatility and reversion speed, among others.
Volatility is defined here as standard deviation of annual changes in an exposure, and not necessarily a cross section of potential future cumulative outcomes.
Current Portfolio
Efficient Frontier of
debt alternatives
Current Portfolio Allocation
Balance
Fixed 150,000,000
% Libor Synthetic Fixed 150,000,000
Floating 100,000,000
BMA Basis Swap -
CMS Swap -
Total 400,000,000
 Institutions can choose an
efficient portfolio of debt
instruments, again subject to
individual risk tolerance
constraints
10
O V E R V I E W  O F  R I S K  M A N A G E M E N T  P R I N C I P L E S
E A C U B O   2 0 0 8
Finally, we can also incorporate operational exposures that
are specific to each institution
 Institutions have a number of potential operational risk exposures:
 Changes in top line revenue
 Changes in expenses
 Changes in Endowment distribution
 Other potential sources of risk:
 Healthcare related income / expenses
 Royalties
 State contributions
11
O V E R V I E W  O F  R I S K  M A N A G E M E N T  P R I N C I P L E S
E A C U B O   2 0 0 8
The Central Treasury function manages a number of
different risks for the University
Internal
Loans
Internal
Deposits
Return: 4.5%
Volatility: 0.5%
Cost: 5.0%
Volatility: 0.0%
Capital
Projects
Operations
$250mm
Central
Treasury
External
Assets
External
Debt
Return: 6.5%
Volatility: 4.5%
Cost: 4.25%
Volatility: 0.4%
$500mm
$400mm
$350mm
12
O V E R V I E W  O F  R I S K  M A N A G E M E N T  P R I N C I P L E S
E A C U B O   2 0 0 8
With this framework, institutions can choose an appropriate
level of risk, and maximize related net returns
Potential Net Risk/Return Alternatives1Potential Net Risk/Return Alternatives1
Current Portfolio
Efficient Frontier of
Central Treasury
1
Opinion and estimates offered constitute our judgment and are subject to change without notice, as are statements on financial market trends, which are based on current
market conditions. We believe the information provided herein is reliable, but it should not be assumed to be either accurate or complete. Actual cash flows may vary
substantially from figures shown based upon changes in market condition, our judgment or the underlying assumptions or methodology employed. Past performance should
not be taken as a guarantee of future results. Analysis includes assumptions for initial and average interest rates, correlations, volatility and reversion speed, among others.
Volatility is defined here as standard deviation of annual changes in an exposure, and not necessarily a cross section of potential future cumulative outcomes.
$354
$455
$556
$657
$758
$859
$960
$1,061
$1,162
$1,263
5Y Ending Balance
Current Solution
Ending Balance Distribution ($mm)Ending Balance Distribution ($mm)
Solution
13
O V E R V I E W  O F  R I S K  M A N A G E M E N T  P R I N C I P L E S
E A C U B O   2 0 0 8
Better understanding of risk exposures leads to superior
balance sheet risk management
 Measures of annual risk exposure
 Annual external debt portfolio volatility of $4 million
 Annual external investment volatility of $22 million
 Annual net balance sheet volatility of $23 million
 Size appropriate reserves
 95% confidence level reserve: $55 million
 Determine appropriate liquidity requirements
 A liquidity strategy is essential to anticipate sources of risk that cannot
be wholly quantified
14
O V E R V I E W  O F  R I S K  M A N A G E M E N T  P R I N C I P L E S
Agenda
Page
E A C U B O   2 0 0 8
Treasury Management at University of Pennsylvania
Internal Bank Management at University of Virginia
Overview of Risk Management Principles
Introduction
15
1
5
15
24
C R E A T I N G  S U P E R I O R  B A L A N C E  S H E E T  R I S K  M A N A G E M E N T  S O L U T I O N S
E A C U B O   2 0 0 8
University of Virginia Overview
 Public University Founded by Thomas Jefferson in 1819
 Ranked #2 among public universities and #23 among all universities in U.S. News and
World Report’s 2008 Rankings
 Fall 2007 - 20,834 students enrolled in 10 Schools on Main Grounds
 FY 2007 Financial Data
 Net Assets = $5.4b
 Total Revenue = $2.8b
 Debt Outstanding = $573m
 Endowment Value = $4.4b
 AAA ratings from Moody’s, S&P, and Fitch
 Operates the University of Virginia Medical Center
 Recognized among Solucient’s Top 100 Hospitals every year since 1998
 Responsible for 31% of University’s FY07 Total Revenue
16
I N T E R N A L  B A N K  M A N A G E M E N T  A T  U N I V E R S I T Y  O F  V I R G I N I A
E A C U B O   2 0 0 8
University of Virginia Treasury Department Overview
 Debt Management
 Fixed and Variable Rate Bonds
 Commercial Paper
 Interest Rate Derivatives
 Investment Management
 ST Investment Management
 Oversight of LT Investments in Endowment
 Oversight of Other Financial Assets (Securities, Trusts, etc.)
 Cash Management
 Bank Account Management
 Cash Forecasting
 Internal Bank Management
 Internal Loan Program
 Internal Investment Program
 Quasi-endowment Administration
17
I N T E R N A L  B A N K  M A N A G E M E N T  A T  U N I V E R S I T Y  O F  V I R G I N I A
E A C U B O   2 0 0 8
Dual Goals of Treasury
 University-wide Goals
 Optimize risk/return profile for financial assets and liabilities
 Provide for sufficient liquidity
 Manage the cash flow volatility
 Treasury Internal Bank Goals
 Manage Budgetary Volatility
 Manage Allocation of Financial Resources
 Manage Margins
18
I N T E R N A L  B A N K  M A N A G E M E N T  A T  U N I V E R S I T Y  O F  V I R G I N I A
E A C U B O   2 0 0 8
Internal Bank Model
19
I N T E R N A L  B A N K  M A N A G E M E N T  A T  U N I V E R S I T Y  O F  V I R G I N I A
E A C U B O   2 0 0 8
Scope of Identified Risk Exposures
19
I N T E R N A L  B A N K  M A N A G E M E N T  A T  U N I V E R S I T Y  O F  V I R G I N I A
University-wide Internal Bank
Investment
Activities
External Investments External Investments
Internal Loans to Units
Financing Activities External Borrowing External Borrowing
Internal Investments by
Units
Operating Activities University Operating Cash Flow
University Non-Financial Capital
Flows
Cash Flow Managed by
Treasury
E A C U B O   2 0 0 8
Treasury Internal Bank Balance Sheet
20
I N T E R N A L  B A N K  M A N A G E M E N T  A T  U N I V E R S I T Y  O F  V I R G I N I A
Assets
Cash 27,232
Short Term Investments 98,393
Internal Borrowing Program Receivable 321,521
Long Term Investments (LTP) 539,822
Total Assets 986,968
Liabilities
Short Term Debt - Commercial Paper and Other 84,900
Long Term Debt - Bonds 505,151
Bond Premium/Discount 17,779
Internal Investment Program (IIP) Deposits 358,859
Deposits Due To/(From) Departments (9,218)
Total Liabilities 957,471
Retained Earnings 29,868
Net Assets Designated to Budget Office (372)
Net Assets 29,496
Total Net Assets and Liabilities 986,968
Internal Bank Balance Sheet – December 31, 2007 ($000’s)
E A C U B O   2 0 0 8
Initial Internal Bank risk assessment
Internal Bank Risk Factors ($ in mm) – FYE 12/30
21
I N T E R N A L  B A N K  M A N A G E M E N T  A T  U N I V E R S I T Y  O F  V I R G I N I A
E A C U B O   2 0 0 8
Pursuing the Efficient Frontier
Potential Internal Bank Alternatives1Potential Internal Bank Alternatives1
1
Opinion and estimates offered constitute our judgment and are subject to change without notice, as are statements on financial market trends, which are based on current
market conditions. We believe the information provided herein is reliable, but it should not be assumed to be either accurate or complete. Actual cash flows may vary
substantially from figures shown based upon changes in market condition, our judgment or the underlying assumptions or methodology employed. Past performance should
not be taken as a guarantee of future results. Analysis includes assumptions for initial and average interest rates, correlations, volatility and reversion speed, among others.
Volatility is defined here as standard deviation of annual changes in an exposure, and not necessarily a cross section of potential future cumulative outcomes.
 UVA can choose a desirable risk level and implement changes to any number of the
underlying risk factors
 External investments
 External debt
 Internal debt
 Internal deposits
Current Portfolio
Efficient Frontier of portfolio
combinations
22
I N T E R N A L  B A N K  M A N A G E M E N T  A T  U N I V E R S I T Y  O F  V I R G I N I A
E A C U B O   2 0 0 8
Developing a Planning Horizon
 INSERT
23
I N T E R N A L  B A N K  M A N A G E M E N T  A T  U N I V E R S I T Y  O F  V I R G I N I A
E A C U B O   2 0 0 8
Optimizing the Portfolio
23
I N T E R N A L  B A N K  M A N A G E M E N T  A T  U N I V E R S I T Y  O F  V I R G I N I A
E A C U B O   2 0 0 8
Next Steps on Balance Sheet Management
 Education and Buy-in
 Drawing from the Endowment Model
 Making it manageable
 Setting Priorities between External and Internal Goals
 Implementation
18
I N T E R N A L  B A N K  M A N A G E M E N T  A T  U N I V E R S I T Y  O F  V I R G I N I A
Agenda
Page
E A C U B O   2 0 0 8
Treasury Management at University of Pennsylvania
Internal Bank Management at University of Virginia
Overview of Risk Management Principles
Introduction
24
1
5
15
24
C R E A T I N G  S U P E R I O R  B A L A N C E  S H E E T  R I S K  M A N A G E M E N T  S O L U T I O N S
E A C U B O   2 0 0 8
University overview & background
 Academic Component
 12 Schools
 Health System
 3 Hospitals
 19 Clinical Practices
 Revenues of $4.8 billion
 55% Health System
 15% Research; 13% Tuition; 6% Investment income; 10% Other
 Expenses of $4.4 Billion
 53% Health System
 47% Academic
 $7.3 Billion Investments
 $6.6 billion Endowment
 $1.3 Billion Debt
25
T R E A S U R Y  M A N A G E M E N T  A T  U N I V E R S I T Y  O F  P E N N S Y L V A N I A
E A C U B O   2 0 0 8
Overview of treasury structure
 $705 Million Working Capital at December 31,2007
 $340 Million money market investment
— Recent in depth review of all money market funds in conjunction with our
Investment Office
 $320 Million invested in the University’s endowment
 $45 Million in Stafford loans
 $570 Million Debt
 $228 Million variable rate
— $123 Million in auction market
— $62 Million in VRDO market
— $43 Million in private placements, bank loans
 $342 Million fixed rate debt
 $200 Million Projected Borrowing Needs
 $100 Million forward starting fixed rate swap
26
T R E A S U R Y  M A N A G E M E N T  A T  U N I V E R S I T Y  O F  P E N N S Y L V A N I A
E A C U B O   2 0 0 8
Management goals & objectives
 Optimize investment return within acceptable risk parameters
 Primary object for working capital is preservation of capital
 Competitive real return
— Cash return (benchmarked at tbill) supports operating budget
— Excess return funds a reserve and supports President’s initiatives
 Stable return
— Reserve fund created
— Currently 5% of equity fund
— Target 10% of equities
 Optimize debt service cost within acceptable risk parameters
 Debt policy
— Consider the hedge between cash and variable debt
— May choose to issue fixed rate in historically low environments to preserve
variable capacity
 Derivatives policy
— May be used to reduce costs or hedge exposures
— Review broker exposures relative to market value of derivatives
27
T R E A S U R Y  M A N A G E M E N T  A T  U N I V E R S I T Y  O F  P E N N S Y L V A N I A
E A C U B O   2 0 0 8
Scope of identified risk exposures
 Investment activities
 Return volatility
 Call on cash from schools
 Capital expenditures
 Financing activities
 Variable Rate exposure
— SIFMA vs LIBOR
— Health System risk
 Operational activities
 Business continuity
— Identified critical procedures
— Contract for off campus facilities in emergency
28
T R E A S U R Y  M A N A G E M E N T  A T  U N I V E R S I T Y  O F  P E N N S Y L V A N I A
E A C U B O   2 0 0 8
Sample analysis of alternative investment portfolios for
working capital
Opinion and estimates offered constitute our judgment and are subject to change without notice, as are statements on financial market
trends, which are based on current market conditions. We believe the information provided herein is reliable, but it should not be assumed
to be either accurate or complete. Actual cash flows may vary substantially from figures shown based upon changes in market condition,
our judgment or the underlying assumptions or methodology employed. Past performance should not be taken as a guarantee of future
results.
Alternative Investment Analysis ($inMM)  
Current 
Portfolio
More 
Endowment
More Fixed 
Income
More 
Alternatives
Cash         430          310          100            80 
ML 1-3           -              -            180            75 
Lehman Agg           -              -            150            50 
S&P 500           -              -              -              -   
Russell 2000           -              -              -              -   
HFR FOF 
Conserv.           -              -              -            150 
HFR FOF 
Strategic           -              -              -              75 
Penn Endowment         330          450          330          330 
        760          760          760          760 
Expected Return 6.30% 7.15% 6.93% 7.59%
Volatility 3.63% 4.92% 4.02% 4.12%
Average Annual 
NFI        56.0         66.4         57.3         67.4 
95% Worst Case 
NFI       (38.0)       (64.9)       (47.0)       (43.5)
29
T R E A S U R Y  M A N A G E M E N T  A T  U N I V E R S I T Y  O F  P E N N S Y L V A N I A
E A C U B O   2 0 0 8
In closing…
 INSERT
30
T R E A S U R Y  M A N A G E M E N T  A T  U N I V E R S I T Y  O F  P E N N S Y L V A N I A

More Related Content

What's hot

Daily sgx-report-20-feb
Daily sgx-report-20-febDaily sgx-report-20-feb
Daily sgx-report-20-feb
Epic Research Singapore
 
Daily sgx-report by epic research singapore 10 dec 2013
Daily sgx-report by epic research singapore 10 dec 2013Daily sgx-report by epic research singapore 10 dec 2013
Daily sgx-report by epic research singapore 10 dec 2013
Epic Research Singapore
 
Daily sgx-report by epic research singapore 24 dec 2013
Daily sgx-report by epic research singapore 24 dec 2013Daily sgx-report by epic research singapore 24 dec 2013
Daily sgx-report by epic research singapore 24 dec 2013
Epic Research Singapore
 
Traders choice dlf
Traders choice   dlfTraders choice   dlf
Traders choice dlf
choice broking
 
Daily klse malaysia report by epic research malaysia 23rd july 2014
Daily klse malaysia report by epic research malaysia  23rd july 2014Daily klse malaysia report by epic research malaysia  23rd july 2014
Daily klse malaysia report by epic research malaysia 23rd july 2014
Epic Research Pte. Ltd.
 
Traders choice ioc
Traders choice   iocTraders choice   ioc
Traders choice ioc
Choice Equity
 
Daily sgx-report by epic research singapore 12 dec 2013
Daily sgx-report by epic research singapore 12 dec 2013Daily sgx-report by epic research singapore 12 dec 2013
Daily sgx-report by epic research singapore 12 dec 2013
Epic Research Singapore
 
Daily sgx-report by epic research singapore 16th sep 13
Daily sgx-report by epic research singapore 16th sep 13Daily sgx-report by epic research singapore 16th sep 13
Daily sgx-report by epic research singapore 16th sep 13
Epic Research Singapore
 
Daily sgx-report-04-02
Daily sgx-report-04-02Daily sgx-report-04-02
Daily sgx-report-04-02
Epic Research Singapore
 
Traders choice suryalaxmi
Traders choice   suryalaxmiTraders choice   suryalaxmi
Traders choice suryalaxmi
Choice Equity
 
Daily sgx-report by epic research singapore 29th oct 2013
Daily sgx-report by epic research singapore 29th oct 2013Daily sgx-report by epic research singapore 29th oct 2013
Daily sgx-report by epic research singapore 29th oct 2013
Epic Research Singapore
 
Daily sgx-report by epic research singapore 12 sep 2013
Daily sgx-report by epic research singapore 12 sep 2013Daily sgx-report by epic research singapore 12 sep 2013
Daily sgx-report by epic research singapore 12 sep 2013
Epic Research Singapore
 
Daily sgx-report-24-feb
Daily sgx-report-24-febDaily sgx-report-24-feb
Daily sgx-report-24-feb
Epic Research Singapore
 
Daily sgx-report by epic research singapore 15 jan 2014
Daily sgx-report by epic research singapore 15 jan 2014Daily sgx-report by epic research singapore 15 jan 2014
Daily sgx-report by epic research singapore 15 jan 2014
Epic Research Singapore
 
Traders choice smlisuzu
Traders choice   smlisuzuTraders choice   smlisuzu
Traders choice smlisuzu
Choice Equity
 
Daily sgx report by epic research singapore 05th march 2014
Daily sgx  report by epic research singapore 05th march 2014Daily sgx  report by epic research singapore 05th march 2014
Daily sgx report by epic research singapore 05th march 2014
Epic Research Singapore
 
Daily klse malaysia report by epic research malaysia 25th july 2014
Daily klse malaysia report by epic research malaysia  25th july 2014Daily klse malaysia report by epic research malaysia  25th july 2014
Daily klse malaysia report by epic research malaysia 25th july 2014
Epic Research Pte. Ltd.
 
Traders choice tataelxsi
Traders choice   tataelxsiTraders choice   tataelxsi
Traders choice tataelxsi
choice broking
 
Daily sgx-report by epic research singapore 30 jan 2014
Daily sgx-report by epic research singapore 30 jan 2014Daily sgx-report by epic research singapore 30 jan 2014
Daily sgx-report by epic research singapore 30 jan 2014
Epic Research Singapore
 
Techno buy srt
Techno buy srtTechno buy srt
Techno buy srt
Choice Equity
 

What's hot (20)

Daily sgx-report-20-feb
Daily sgx-report-20-febDaily sgx-report-20-feb
Daily sgx-report-20-feb
 
Daily sgx-report by epic research singapore 10 dec 2013
Daily sgx-report by epic research singapore 10 dec 2013Daily sgx-report by epic research singapore 10 dec 2013
Daily sgx-report by epic research singapore 10 dec 2013
 
Daily sgx-report by epic research singapore 24 dec 2013
Daily sgx-report by epic research singapore 24 dec 2013Daily sgx-report by epic research singapore 24 dec 2013
Daily sgx-report by epic research singapore 24 dec 2013
 
Traders choice dlf
Traders choice   dlfTraders choice   dlf
Traders choice dlf
 
Daily klse malaysia report by epic research malaysia 23rd july 2014
Daily klse malaysia report by epic research malaysia  23rd july 2014Daily klse malaysia report by epic research malaysia  23rd july 2014
Daily klse malaysia report by epic research malaysia 23rd july 2014
 
Traders choice ioc
Traders choice   iocTraders choice   ioc
Traders choice ioc
 
Daily sgx-report by epic research singapore 12 dec 2013
Daily sgx-report by epic research singapore 12 dec 2013Daily sgx-report by epic research singapore 12 dec 2013
Daily sgx-report by epic research singapore 12 dec 2013
 
Daily sgx-report by epic research singapore 16th sep 13
Daily sgx-report by epic research singapore 16th sep 13Daily sgx-report by epic research singapore 16th sep 13
Daily sgx-report by epic research singapore 16th sep 13
 
Daily sgx-report-04-02
Daily sgx-report-04-02Daily sgx-report-04-02
Daily sgx-report-04-02
 
Traders choice suryalaxmi
Traders choice   suryalaxmiTraders choice   suryalaxmi
Traders choice suryalaxmi
 
Daily sgx-report by epic research singapore 29th oct 2013
Daily sgx-report by epic research singapore 29th oct 2013Daily sgx-report by epic research singapore 29th oct 2013
Daily sgx-report by epic research singapore 29th oct 2013
 
Daily sgx-report by epic research singapore 12 sep 2013
Daily sgx-report by epic research singapore 12 sep 2013Daily sgx-report by epic research singapore 12 sep 2013
Daily sgx-report by epic research singapore 12 sep 2013
 
Daily sgx-report-24-feb
Daily sgx-report-24-febDaily sgx-report-24-feb
Daily sgx-report-24-feb
 
Daily sgx-report by epic research singapore 15 jan 2014
Daily sgx-report by epic research singapore 15 jan 2014Daily sgx-report by epic research singapore 15 jan 2014
Daily sgx-report by epic research singapore 15 jan 2014
 
Traders choice smlisuzu
Traders choice   smlisuzuTraders choice   smlisuzu
Traders choice smlisuzu
 
Daily sgx report by epic research singapore 05th march 2014
Daily sgx  report by epic research singapore 05th march 2014Daily sgx  report by epic research singapore 05th march 2014
Daily sgx report by epic research singapore 05th march 2014
 
Daily klse malaysia report by epic research malaysia 25th july 2014
Daily klse malaysia report by epic research malaysia  25th july 2014Daily klse malaysia report by epic research malaysia  25th july 2014
Daily klse malaysia report by epic research malaysia 25th july 2014
 
Traders choice tataelxsi
Traders choice   tataelxsiTraders choice   tataelxsi
Traders choice tataelxsi
 
Daily sgx-report by epic research singapore 30 jan 2014
Daily sgx-report by epic research singapore 30 jan 2014Daily sgx-report by epic research singapore 30 jan 2014
Daily sgx-report by epic research singapore 30 jan 2014
 
Techno buy srt
Techno buy srtTechno buy srt
Techno buy srt
 

Similar to Balance Sheet Risk Management

JP MORGAN DCF AND M&A ANALYSIS
JP MORGAN  DCF AND M&A ANALYSIS JP MORGAN  DCF AND M&A ANALYSIS
JP MORGAN DCF AND M&A ANALYSIS
DAVID CHIKHLADZE
 
Ashok Leyland Q3FY15 Preview: Buy at a CMP of Rs51
 Ashok Leyland Q3FY15 Preview: Buy at a CMP of Rs51 Ashok Leyland Q3FY15 Preview: Buy at a CMP of Rs51
Ashok Leyland Q3FY15 Preview: Buy at a CMP of Rs51
IndiaNotes.com
 
Aod Cunha | Economic Analysis of Brazil & Sao Paulo | Global Cities Initiative
Aod Cunha | Economic Analysis of Brazil & Sao Paulo | Global Cities InitiativeAod Cunha | Economic Analysis of Brazil & Sao Paulo | Global Cities Initiative
Aod Cunha | Economic Analysis of Brazil & Sao Paulo | Global Cities Initiative
Brookings Metropolitan Policy Program
 
Daily equity market news updates by marketmagnify
Daily equity market news updates by marketmagnifyDaily equity market news updates by marketmagnify
Daily equity market news updates by marketmagnify
Self-employed
 
Ashok Leyland: Reports sales volume growth of 16.7% in Aug'14 - Motilal Oswal
Ashok Leyland: Reports sales volume growth of 16.7% in Aug'14 - Motilal OswalAshok Leyland: Reports sales volume growth of 16.7% in Aug'14 - Motilal Oswal
Ashok Leyland: Reports sales volume growth of 16.7% in Aug'14 - Motilal Oswal
IndiaNotes.com
 
How equity investors assess pension risk: Does de-risking a pension scheme af...
How equity investors assess pension risk: Does de-risking a pension scheme af...How equity investors assess pension risk: Does de-risking a pension scheme af...
How equity investors assess pension risk: Does de-risking a pension scheme af...
Confederation of British Industry
 
Tricumen / Rates markets vignettes 160315
Tricumen / Rates markets vignettes 160315Tricumen / Rates markets vignettes 160315
Tricumen / Rates markets vignettes 160315
Tricumen Ltd
 
Paytm_Investor_Presentation_Sep_2023__INR.pdf
Paytm_Investor_Presentation_Sep_2023__INR.pdfPaytm_Investor_Presentation_Sep_2023__INR.pdf
Paytm_Investor_Presentation_Sep_2023__INR.pdf
scodooby6
 
1 h13 hcc_ir_eng
1 h13 hcc_ir_eng1 h13 hcc_ir_eng
1 h13 hcc_ir_eng
Hyundai Finance
 
634953131803473592
634953131803473592634953131803473592
634953131803473592
videoaakash15
 
Daily Equity and Stock Market Report
 Daily Equity and Stock Market Report Daily Equity and Stock Market Report
Daily Equity and Stock Market Report
Self-employed
 
Daily sgx sinagpore report by epic research singapore 23th april 2014
Daily sgx sinagpore report by epic research singapore 23th april 2014Daily sgx sinagpore report by epic research singapore 23th april 2014
Daily sgx sinagpore report by epic research singapore 23th april 2014
Epic Research Singapore
 
FNCE 221 - Project Sukhumvit Final Edition
FNCE 221 - Project Sukhumvit Final EditionFNCE 221 - Project Sukhumvit Final Edition
FNCE 221 - Project Sukhumvit Final Edition
Shaikh Ahmad Mattar
 
Interim Results 2019
Interim Results 2019Interim Results 2019
Interim Results 2019
Anglo American
 
International Banking & Tax Update
International Banking & Tax UpdateInternational Banking & Tax Update
International Banking & Tax Update
Insero & Co. CPAs, LLP
 
research report
research reportresearch report
research report
videoaakash15
 
Anglo American 2017 Results - Presentation
Anglo American 2017 Results - PresentationAnglo American 2017 Results - Presentation
Anglo American 2017 Results - Presentation
Anglo American
 
Summit Coal Pitch (Arame and Joseph) (1) - Copy
Summit Coal Pitch (Arame and Joseph) (1) - CopySummit Coal Pitch (Arame and Joseph) (1) - Copy
Summit Coal Pitch (Arame and Joseph) (1) - Copy
Arame Niang
 
Partners Capital View of the Future of Private Equity Investing
Partners Capital View of the Future of Private Equity InvestingPartners Capital View of the Future of Private Equity Investing
Partners Capital View of the Future of Private Equity Investing
London Business School
 
Mahindra & Mahindra: Auto remains weak, exports drive tractors - Motilal Oswal
Mahindra & Mahindra: Auto remains weak, exports drive tractors - Motilal OswalMahindra & Mahindra: Auto remains weak, exports drive tractors - Motilal Oswal
Mahindra & Mahindra: Auto remains weak, exports drive tractors - Motilal Oswal
IndiaNotes.com
 

Similar to Balance Sheet Risk Management (20)

JP MORGAN DCF AND M&A ANALYSIS
JP MORGAN  DCF AND M&A ANALYSIS JP MORGAN  DCF AND M&A ANALYSIS
JP MORGAN DCF AND M&A ANALYSIS
 
Ashok Leyland Q3FY15 Preview: Buy at a CMP of Rs51
 Ashok Leyland Q3FY15 Preview: Buy at a CMP of Rs51 Ashok Leyland Q3FY15 Preview: Buy at a CMP of Rs51
Ashok Leyland Q3FY15 Preview: Buy at a CMP of Rs51
 
Aod Cunha | Economic Analysis of Brazil & Sao Paulo | Global Cities Initiative
Aod Cunha | Economic Analysis of Brazil & Sao Paulo | Global Cities InitiativeAod Cunha | Economic Analysis of Brazil & Sao Paulo | Global Cities Initiative
Aod Cunha | Economic Analysis of Brazil & Sao Paulo | Global Cities Initiative
 
Daily equity market news updates by marketmagnify
Daily equity market news updates by marketmagnifyDaily equity market news updates by marketmagnify
Daily equity market news updates by marketmagnify
 
Ashok Leyland: Reports sales volume growth of 16.7% in Aug'14 - Motilal Oswal
Ashok Leyland: Reports sales volume growth of 16.7% in Aug'14 - Motilal OswalAshok Leyland: Reports sales volume growth of 16.7% in Aug'14 - Motilal Oswal
Ashok Leyland: Reports sales volume growth of 16.7% in Aug'14 - Motilal Oswal
 
How equity investors assess pension risk: Does de-risking a pension scheme af...
How equity investors assess pension risk: Does de-risking a pension scheme af...How equity investors assess pension risk: Does de-risking a pension scheme af...
How equity investors assess pension risk: Does de-risking a pension scheme af...
 
Tricumen / Rates markets vignettes 160315
Tricumen / Rates markets vignettes 160315Tricumen / Rates markets vignettes 160315
Tricumen / Rates markets vignettes 160315
 
Paytm_Investor_Presentation_Sep_2023__INR.pdf
Paytm_Investor_Presentation_Sep_2023__INR.pdfPaytm_Investor_Presentation_Sep_2023__INR.pdf
Paytm_Investor_Presentation_Sep_2023__INR.pdf
 
1 h13 hcc_ir_eng
1 h13 hcc_ir_eng1 h13 hcc_ir_eng
1 h13 hcc_ir_eng
 
634953131803473592
634953131803473592634953131803473592
634953131803473592
 
Daily Equity and Stock Market Report
 Daily Equity and Stock Market Report Daily Equity and Stock Market Report
Daily Equity and Stock Market Report
 
Daily sgx sinagpore report by epic research singapore 23th april 2014
Daily sgx sinagpore report by epic research singapore 23th april 2014Daily sgx sinagpore report by epic research singapore 23th april 2014
Daily sgx sinagpore report by epic research singapore 23th april 2014
 
FNCE 221 - Project Sukhumvit Final Edition
FNCE 221 - Project Sukhumvit Final EditionFNCE 221 - Project Sukhumvit Final Edition
FNCE 221 - Project Sukhumvit Final Edition
 
Interim Results 2019
Interim Results 2019Interim Results 2019
Interim Results 2019
 
International Banking & Tax Update
International Banking & Tax UpdateInternational Banking & Tax Update
International Banking & Tax Update
 
research report
research reportresearch report
research report
 
Anglo American 2017 Results - Presentation
Anglo American 2017 Results - PresentationAnglo American 2017 Results - Presentation
Anglo American 2017 Results - Presentation
 
Summit Coal Pitch (Arame and Joseph) (1) - Copy
Summit Coal Pitch (Arame and Joseph) (1) - CopySummit Coal Pitch (Arame and Joseph) (1) - Copy
Summit Coal Pitch (Arame and Joseph) (1) - Copy
 
Partners Capital View of the Future of Private Equity Investing
Partners Capital View of the Future of Private Equity InvestingPartners Capital View of the Future of Private Equity Investing
Partners Capital View of the Future of Private Equity Investing
 
Mahindra & Mahindra: Auto remains weak, exports drive tractors - Motilal Oswal
Mahindra & Mahindra: Auto remains weak, exports drive tractors - Motilal OswalMahindra & Mahindra: Auto remains weak, exports drive tractors - Motilal Oswal
Mahindra & Mahindra: Auto remains weak, exports drive tractors - Motilal Oswal
 

Recently uploaded

falcon-invoice-discounting-a-premier-investment-platform-for-superior-returns...
falcon-invoice-discounting-a-premier-investment-platform-for-superior-returns...falcon-invoice-discounting-a-premier-investment-platform-for-superior-returns...
falcon-invoice-discounting-a-premier-investment-platform-for-superior-returns...
Falcon Invoice Discounting
 
Fabular Frames and the Four Ratio Problem
Fabular Frames and the Four Ratio ProblemFabular Frames and the Four Ratio Problem
Fabular Frames and the Four Ratio Problem
Majid Iqbal
 
Detailed power point presentation on compound interest and how it is calculated
Detailed power point presentation on compound interest  and how it is calculatedDetailed power point presentation on compound interest  and how it is calculated
Detailed power point presentation on compound interest and how it is calculated
KishanChaudhary23
 
快速办理(RWTH毕业证书)德国亚琛工业大学毕业证录取通知书一模一样
快速办理(RWTH毕业证书)德国亚琛工业大学毕业证录取通知书一模一样快速办理(RWTH毕业证书)德国亚琛工业大学毕业证录取通知书一模一样
快速办理(RWTH毕业证书)德国亚琛工业大学毕业证录取通知书一模一样
yeuwffu
 
快速办理(美国Fordham毕业证书)福德汉姆大学毕业证学历证书一模一样
快速办理(美国Fordham毕业证书)福德汉姆大学毕业证学历证书一模一样快速办理(美国Fordham毕业证书)福德汉姆大学毕业证学历证书一模一样
快速办理(美国Fordham毕业证书)福德汉姆大学毕业证学历证书一模一样
5spllj1l
 
Upanishads summary with explanations of each upnishad
Upanishads summary with explanations of each upnishadUpanishads summary with explanations of each upnishad
Upanishads summary with explanations of each upnishad
ajaykumarxoxo04
 
Does teamwork really matter? Looking beyond the job posting to understand lab...
Does teamwork really matter? Looking beyond the job posting to understand lab...Does teamwork really matter? Looking beyond the job posting to understand lab...
Does teamwork really matter? Looking beyond the job posting to understand lab...
Labour Market Information Council | Conseil de l’information sur le marché du travail
 
Independent Study - College of Wooster Research (2023-2024) FDI, Culture, Glo...
Independent Study - College of Wooster Research (2023-2024) FDI, Culture, Glo...Independent Study - College of Wooster Research (2023-2024) FDI, Culture, Glo...
Independent Study - College of Wooster Research (2023-2024) FDI, Culture, Glo...
AntoniaOwensDetwiler
 
Money20/20 and EU Networking Event of 20/24!
Money20/20 and EU Networking Event of 20/24!Money20/20 and EU Networking Event of 20/24!
Money20/20 and EU Networking Event of 20/24!
FinTech Belgium
 
1:1制作加拿大麦吉尔大学毕业证硕士学历证书原版一模一样
1:1制作加拿大麦吉尔大学毕业证硕士学历证书原版一模一样1:1制作加拿大麦吉尔大学毕业证硕士学历证书原版一模一样
1:1制作加拿大麦吉尔大学毕业证硕士学历证书原版一模一样
qntjwn68
 
一比一原版(RMIT毕业证)皇家墨尔本理工大学毕业证如何办理
一比一原版(RMIT毕业证)皇家墨尔本理工大学毕业证如何办理一比一原版(RMIT毕业证)皇家墨尔本理工大学毕业证如何办理
一比一原版(RMIT毕业证)皇家墨尔本理工大学毕业证如何办理
k4ncd0z
 
Tdasx: In-Depth Analysis of Cryptocurrency Giveaway Scams and Security Strate...
Tdasx: In-Depth Analysis of Cryptocurrency Giveaway Scams and Security Strate...Tdasx: In-Depth Analysis of Cryptocurrency Giveaway Scams and Security Strate...
Tdasx: In-Depth Analysis of Cryptocurrency Giveaway Scams and Security Strate...
nimaruinazawa258
 
Bridging the gap: Online job postings, survey data and the assessment of job ...
Bridging the gap: Online job postings, survey data and the assessment of job ...Bridging the gap: Online job postings, survey data and the assessment of job ...
Bridging the gap: Online job postings, survey data and the assessment of job ...
Labour Market Information Council | Conseil de l’information sur le marché du travail
 
OAT_RI_Ep20 WeighingTheRisks_May24_Trade Wars.pptx
OAT_RI_Ep20 WeighingTheRisks_May24_Trade Wars.pptxOAT_RI_Ep20 WeighingTheRisks_May24_Trade Wars.pptx
OAT_RI_Ep20 WeighingTheRisks_May24_Trade Wars.pptx
hiddenlevers
 
How to Use Payment Vouchers in Odoo 18.
How to Use Payment Vouchers in  Odoo 18.How to Use Payment Vouchers in  Odoo 18.
How to Use Payment Vouchers in Odoo 18.
FinShe
 
一比一原版美国新罕布什尔大学(unh)毕业证学历认证真实可查
一比一原版美国新罕布什尔大学(unh)毕业证学历认证真实可查一比一原版美国新罕布什尔大学(unh)毕业证学历认证真实可查
一比一原版美国新罕布什尔大学(unh)毕业证学历认证真实可查
taqyea
 
The state of welfare Resolution Foundation Event
The state of welfare Resolution Foundation EventThe state of welfare Resolution Foundation Event
The state of welfare Resolution Foundation Event
ResolutionFoundation
 
Accounting Information Systems (AIS).pptx
Accounting Information Systems (AIS).pptxAccounting Information Systems (AIS).pptx
Accounting Information Systems (AIS).pptx
TIZITAWMASRESHA
 
New Visa Rules for Tourists and Students in Thailand | Amit Kakkar Easy Visa
New Visa Rules for Tourists and Students in Thailand | Amit Kakkar Easy VisaNew Visa Rules for Tourists and Students in Thailand | Amit Kakkar Easy Visa
New Visa Rules for Tourists and Students in Thailand | Amit Kakkar Easy Visa
Amit Kakkar
 
Tdasx: In-Depth Analysis of Cryptocurrency Giveaway Scams and Security Strate...
Tdasx: In-Depth Analysis of Cryptocurrency Giveaway Scams and Security Strate...Tdasx: In-Depth Analysis of Cryptocurrency Giveaway Scams and Security Strate...
Tdasx: In-Depth Analysis of Cryptocurrency Giveaway Scams and Security Strate...
bresciafarid233
 

Recently uploaded (20)

falcon-invoice-discounting-a-premier-investment-platform-for-superior-returns...
falcon-invoice-discounting-a-premier-investment-platform-for-superior-returns...falcon-invoice-discounting-a-premier-investment-platform-for-superior-returns...
falcon-invoice-discounting-a-premier-investment-platform-for-superior-returns...
 
Fabular Frames and the Four Ratio Problem
Fabular Frames and the Four Ratio ProblemFabular Frames and the Four Ratio Problem
Fabular Frames and the Four Ratio Problem
 
Detailed power point presentation on compound interest and how it is calculated
Detailed power point presentation on compound interest  and how it is calculatedDetailed power point presentation on compound interest  and how it is calculated
Detailed power point presentation on compound interest and how it is calculated
 
快速办理(RWTH毕业证书)德国亚琛工业大学毕业证录取通知书一模一样
快速办理(RWTH毕业证书)德国亚琛工业大学毕业证录取通知书一模一样快速办理(RWTH毕业证书)德国亚琛工业大学毕业证录取通知书一模一样
快速办理(RWTH毕业证书)德国亚琛工业大学毕业证录取通知书一模一样
 
快速办理(美国Fordham毕业证书)福德汉姆大学毕业证学历证书一模一样
快速办理(美国Fordham毕业证书)福德汉姆大学毕业证学历证书一模一样快速办理(美国Fordham毕业证书)福德汉姆大学毕业证学历证书一模一样
快速办理(美国Fordham毕业证书)福德汉姆大学毕业证学历证书一模一样
 
Upanishads summary with explanations of each upnishad
Upanishads summary with explanations of each upnishadUpanishads summary with explanations of each upnishad
Upanishads summary with explanations of each upnishad
 
Does teamwork really matter? Looking beyond the job posting to understand lab...
Does teamwork really matter? Looking beyond the job posting to understand lab...Does teamwork really matter? Looking beyond the job posting to understand lab...
Does teamwork really matter? Looking beyond the job posting to understand lab...
 
Independent Study - College of Wooster Research (2023-2024) FDI, Culture, Glo...
Independent Study - College of Wooster Research (2023-2024) FDI, Culture, Glo...Independent Study - College of Wooster Research (2023-2024) FDI, Culture, Glo...
Independent Study - College of Wooster Research (2023-2024) FDI, Culture, Glo...
 
Money20/20 and EU Networking Event of 20/24!
Money20/20 and EU Networking Event of 20/24!Money20/20 and EU Networking Event of 20/24!
Money20/20 and EU Networking Event of 20/24!
 
1:1制作加拿大麦吉尔大学毕业证硕士学历证书原版一模一样
1:1制作加拿大麦吉尔大学毕业证硕士学历证书原版一模一样1:1制作加拿大麦吉尔大学毕业证硕士学历证书原版一模一样
1:1制作加拿大麦吉尔大学毕业证硕士学历证书原版一模一样
 
一比一原版(RMIT毕业证)皇家墨尔本理工大学毕业证如何办理
一比一原版(RMIT毕业证)皇家墨尔本理工大学毕业证如何办理一比一原版(RMIT毕业证)皇家墨尔本理工大学毕业证如何办理
一比一原版(RMIT毕业证)皇家墨尔本理工大学毕业证如何办理
 
Tdasx: In-Depth Analysis of Cryptocurrency Giveaway Scams and Security Strate...
Tdasx: In-Depth Analysis of Cryptocurrency Giveaway Scams and Security Strate...Tdasx: In-Depth Analysis of Cryptocurrency Giveaway Scams and Security Strate...
Tdasx: In-Depth Analysis of Cryptocurrency Giveaway Scams and Security Strate...
 
Bridging the gap: Online job postings, survey data and the assessment of job ...
Bridging the gap: Online job postings, survey data and the assessment of job ...Bridging the gap: Online job postings, survey data and the assessment of job ...
Bridging the gap: Online job postings, survey data and the assessment of job ...
 
OAT_RI_Ep20 WeighingTheRisks_May24_Trade Wars.pptx
OAT_RI_Ep20 WeighingTheRisks_May24_Trade Wars.pptxOAT_RI_Ep20 WeighingTheRisks_May24_Trade Wars.pptx
OAT_RI_Ep20 WeighingTheRisks_May24_Trade Wars.pptx
 
How to Use Payment Vouchers in Odoo 18.
How to Use Payment Vouchers in  Odoo 18.How to Use Payment Vouchers in  Odoo 18.
How to Use Payment Vouchers in Odoo 18.
 
一比一原版美国新罕布什尔大学(unh)毕业证学历认证真实可查
一比一原版美国新罕布什尔大学(unh)毕业证学历认证真实可查一比一原版美国新罕布什尔大学(unh)毕业证学历认证真实可查
一比一原版美国新罕布什尔大学(unh)毕业证学历认证真实可查
 
The state of welfare Resolution Foundation Event
The state of welfare Resolution Foundation EventThe state of welfare Resolution Foundation Event
The state of welfare Resolution Foundation Event
 
Accounting Information Systems (AIS).pptx
Accounting Information Systems (AIS).pptxAccounting Information Systems (AIS).pptx
Accounting Information Systems (AIS).pptx
 
New Visa Rules for Tourists and Students in Thailand | Amit Kakkar Easy Visa
New Visa Rules for Tourists and Students in Thailand | Amit Kakkar Easy VisaNew Visa Rules for Tourists and Students in Thailand | Amit Kakkar Easy Visa
New Visa Rules for Tourists and Students in Thailand | Amit Kakkar Easy Visa
 
Tdasx: In-Depth Analysis of Cryptocurrency Giveaway Scams and Security Strate...
Tdasx: In-Depth Analysis of Cryptocurrency Giveaway Scams and Security Strate...Tdasx: In-Depth Analysis of Cryptocurrency Giveaway Scams and Security Strate...
Tdasx: In-Depth Analysis of Cryptocurrency Giveaway Scams and Security Strate...
 

Balance Sheet Risk Management

  • 1. M A R C H   2 0 0 8 C R E A T I N G   S U P E R I O R   B A L A N C E   S H E E T   R I S K   M A N A G E M E N T   S O L U T I O N S 2008 EACUBO Annual Workshop S T R I C T L Y  P R I V A T E  A N D  C O N F I D E N T I A L
  • 2. E A C U B O   2 0 0 8 l This presentation was prepared exclusively for the benefit and internal use of the JPMorgan client to whom it is directly addressed and delivered (including such client’s subsidiaries, the “Company”) in order to assist the Company in evaluating, on a preliminary basis, the feasibility of a possible transaction or transactions and does not carry any right of publication or disclosure, in whole or in part, to any other party. This presentation is for discussion purposes only and is incomplete without reference to, and should be viewed solely in conjunction with, the oral briefing provided by JPMorgan. Neither this presentation nor any of its contents may be disclosed or used for any other purpose without the prior written consent of JPMorgan. The information in this presentation is based upon any management forecasts supplied to us and reflects prevailing conditions and our views as of this date, all of which are accordingly subject to change. JPMorgan’s opinions and estimates constitute JPMorgan’s judgment and should be regarded as indicative, preliminary and for illustrative purposes only. In preparing this presentation, we have relied upon and assumed, without independent verification, the accuracy and completeness of all information available from public sources or which was provided to us by or on behalf of the Company or which was otherwise reviewed by us. In addition, our analyses are not and do not purport to be appraisals of the assets, stock, or business of the Company or any other entity. JPMorgan makes no representations as to the actual value which may be received in connection with a transaction nor the legal, tax or accounting effects of consummating a transaction. Unless expressly contemplated hereby, the information in this presentation does not take into account the effects of a possible transaction or transactions involving an actual or potential change of control, which may have significant valuation and other effects. Notwithstanding anything herein to the contrary, the Company and each of its employees, representatives or other agents may disclose to any and all persons, without limitation of any kind, the U.S. federal and state income tax treatment and the U.S. federal and state income tax structure of the transactions contemplated hereby and all materials of any kind (including opinions or other tax analyses) that are provided to the Company relating to such tax treatment and tax structure insofar as such treatment and/or structure relates to a U.S. federal or state income tax strategy provided to the Company by JPMorgan. JPMorgan’s policies prohibit employees from offering, directly or indirectly, a favorable research rating or specific price target, or offering to change a rating or price target, to a subject company as consideration or inducement for the receipt of business or for compensation. JPMorgan also prohibits its research analysts from being compensated for involvement in investment banking transactions except to the extent that such participation is intended to benefit investors. IRS Circular 230 Disclosure: JPMorgan Chase & Co. and its affiliates do not provide tax advice. Accordingly, any discussion of U.S. tax matters included herein (including any attachments) is not intended or written to be used, and cannot be used, in connection with the promotion, marketing or recommendation by anyone not affiliated with JPMorgan Chase & Co. of any of the matters addressed herein or for the purpose of avoiding U.S. tax-related penalties. JPMorgan is a marketing name for investment banking businesses of JPMorgan Chase & Co. and its subsidiaries worldwide. Securities, syndicated loan arranging, financial advisory and other investment banking activities are performed by a combination of J.P. Morgan Securities Inc., J.P. Morgan plc, J.P. Morgan Securities Ltd. and the appropriately licensed subsidiaries of JPMorgan Chase & Co. in Asia-Pacific, and lending, derivatives and other commercial banking activities are performed by JPMorgan Chase Bank, N.A. JPMorgan deal team members may be employees of any of the foregoing entities. This presentation does not constitute a commitment by any JPMorgan entity to underwrite, subscribe for or place any securities or to extend or arrange credit or to provide any other services. C R E A T I N G  S U P E R I O R  B A L A N C E  S H E E T  R I S K  M A N A G E M E N T  S O L U T I O N S
  • 3. Agenda Page E A C U B O   2 0 0 8 Treasury Management at University of Pennsylvania Internal Bank Management at University of Virginia Overview of Risk Management Principles Introduction 1 1 5 15 24 C R E A T I N G  S U P E R I O R  B A L A N C E  S H E E T  R I S K  M A N A G E M E N T  S O L U T I O N S
  • 4. E A C U B O   2 0 0 8 Today’s panelists Helen Kreider, University of Pennsylvania  INSERT BRIEF BIO Jim Matteo, University of Virginia  Director of Treasury Operations since August 2005, responsible for debt management, banking & cash management, investment portfolio oversight, liquidity & interest rate management Charlie Giffin, JPMorgan  Co-Head of Issuer Solutions group within Tax Exempt Capital Markets, with specialty in enterprise risk management, market analytics, and integrated solutions across different markets 2 I N T R O D U C T I O N
  • 5. E A C U B O   2 0 0 8 What do we mean by “Balance Sheet Risk Management?”  Identify risk exposures  Financing risks  Investment risks  Operational risks  Construction risks  Quantify risk exposures (where possible)  Expected outcome  Volatility  Correlation  Manage risk vs. return  Accept appropriate amounts of risk  Maximize net financial performance  Anticipate “worst case” outcomes 3 I N T R O D U C T I O N
  • 6. E A C U B O   2 0 0 8 The danger of what we don’t yet know “With these advances in technology, lenders have taken advantage of credit-scoring models and other techniques for efficiently extending credit to a broader spectrum of consumers. …Where once more-marginal applicants would simply have been denied credit, lenders are now able to quite efficiently judge the risk posed by individual applicants and to price that risk appropriately. These improvements have led to rapid growth in subprime mortgage lending; indeed, today subprime mortgages account for roughly 10 percent of the number of all mortgages outstanding, up from just 1 or 2 percent in the early 1990s.” - Alan Greenspan, April 5, 2005 “We are all wrong so often that it amazes me that we can have any conviction at all over the direction of things to come. But we must.” - Jim Cramer, CNBC “It's tough to make predictions, especially about the future.” - Yogi Berra 4 I N T R O D U C T I O N
  • 7. Agenda Page E A C U B O   2 0 0 8 Treasury Management at University of Pennsylvania Internal Bank Management at University of Virginia Overview of Risk Management Principles Introduction 5 1 5 15 24 C R E A T I N G  S U P E R I O R  B A L A N C E  S H E E T  R I S K  M A N A G E M E N T  S O L U T I O N S
  • 8. E A C U B O   2 0 0 8 Much of risk management can be simplified to averages and standard deviations (volatility)  There are a number of common risk factors within investment management… Investment Factors Average Return Annual Volatility S&P 500 7.50% 14.0% Russell 2000 9.00% 18.0% MSCI EAFE 10.00% 14.0% Lehman Bros. Agg 6.00% 3.5% US Treasury Bills 3.75% 0.5% HFR FOF Strategic 8.00% 9.0% HFR FOF Conserv 6.50% 3.5% Yield Factors Average Rate Annual Volatility LIBOR 5.00% 25.0% BMA 3.40% 25.0% BMA/LIBOR 68.00% 9.0% CPI 3.25% 40.0%  … as well as within debt management 6 O V E R V I E W  O F  R I S K  M A N A G E M E N T  P R I N C I P L E S
  • 9. E A C U B O   2 0 0 8 Correlations between risk factors is what drives the benefits of portfolio diversification Correlation Matrix LIBOR BMA/LIB 5Y LIB S&P 500 Russell 2000 MSCI EAFE Lehman Agg T-Bills HFR FOF A HFR FOF B LIBOR 1.00 (0.35) 0.65 0.06 0.01 0.20 (0.05) (0.02) 0.09 0.08 BMA/LIB (0.35) 1.00 (0.20) 0.07 (0.01) 0.00 0.08 0.01 (0.10) (0.07) 5Y LIB 0.65 (0.20) 1.00 0.24 0.23 0.20 (0.88) (0.09) 0.16 0.12 S&P 500 0.06 0.07 0.24 1.00 0.74 0.82 (0.22) (0.00) 0.57 0.46 Russell 2000 0.01 (0.01) 0.23 0.74 1.00 0.72 (0.18) (0.08) 0.77 0.56 MSCI EAFE 0.20 0.00 0.20 0.82 0.72 1.00 (0.20) (0.08) 0.67 0.58 Lehman Agg (0.05) 0.08 (0.88) (0.22) (0.18) (0.20) 1.00 0.10 (0.15) (0.12) T-Bills (0.02) 0.01 (0.09) (0.00) (0.08) (0.08) 0.10 1.00 (0.03) 0.02 HFR FOF A 0.09 (0.10) 0.16 0.57 0.77 0.67 (0.15) (0.03) 1.00 0.89 HFR FOF B 0.08 (0.07) 0.12 0.46 0.56 0.58 (0.12) 0.02 0.89 1.00 7 O V E R V I E W  O F  R I S K  M A N A G E M E N T  P R I N C I P L E S
  • 10. E A C U B O   2 0 0 8 For investment portfolio management, the “efficient frontier” is a common representation of risk vs. return Potential Investment Allocation Alternatives1Potential Investment Allocation Alternatives1 1 Opinion and estimates offered constitute our judgment and are subject to change without notice, as are statements on financial market trends, which are based on current market conditions. We believe the information provided herein is reliable, but it should not be assumed to be either accurate or complete. Actual cash flows may vary substantially from figures shown based upon changes in market condition, our judgment or the underlying assumptions or methodology employed. Past performance should not be taken as a guarantee of future results. Analysis includes assumptions for initial and average interest rates, correlations, volatility and reversion speed, among others. Volatility is defined here as standard deviation of annual changes in an exposure, and not necessarily a cross section of potential future cumulative outcomes. Current Portfolio Efficient Frontier of investment alternatives Current Portfolio Allocation Balance S&P 500 25,000,000 Russell 2000 25,000,000 MSCI EAFE 25,000,000 Lehman Bros. Agg 25,000,000 US Treasury Bills 200,000,000 HFR FOF Strategic 100,000,000 HFR FOF Conserv 100,000,000 Total 500,000,000  Institutions can choose an efficient portfolio of investment alternatives, subject to individual risk tolerance constraints 8 O V E R V I E W  O F  R I S K  M A N A G E M E N T  P R I N C I P L E S
  • 11. E A C U B O   2 0 0 8 Debt managers can benefit from adopting risk management principles developed through the investment community Investment Management Debt Management Sensitivity Total Return (Mark to Market) Cost (Cash Flow) Risk Measures Value at Risk (VaR); Price Volatility Cash Flow at Risk (CFaR); Cost Volatility Objective Maximize Return; Minimize Risk Minimize Cost; Minimize Risk Analytics Capture Correlations of Returns Capture Correlations of Carry Diversification Uncorrelated Sources of Return Uncorrelated Sources of Carry Market Constraints Value at Risk Important Both VaR and CFaR Important Market Opportunities Hedge Funds, Energy, Weather BMA, LIBOR, CPI, CMS, ??? Investment Management Compared to Debt Management Investment Management Compared to Debt Management 9 O V E R V I E W  O F  R I S K  M A N A G E M E N T  P R I N C I P L E S
  • 12. E A C U B O   2 0 0 8 We can also create an “efficient frontier” for various debt management strategies in the current market Potential Investment Allocation Alternatives1Potential Investment Allocation Alternatives1 1 Opinion and estimates offered constitute our judgment and are subject to change without notice, as are statements on financial market trends, which are based on current market conditions. We believe the information provided herein is reliable, but it should not be assumed to be either accurate or complete. Actual cash flows may vary substantially from figures shown based upon changes in market condition, our judgment or the underlying assumptions or methodology employed. Past performance should not be taken as a guarantee of future results. Analysis includes assumptions for initial and average interest rates, correlations, volatility and reversion speed, among others. Volatility is defined here as standard deviation of annual changes in an exposure, and not necessarily a cross section of potential future cumulative outcomes. Current Portfolio Efficient Frontier of debt alternatives Current Portfolio Allocation Balance Fixed 150,000,000 % Libor Synthetic Fixed 150,000,000 Floating 100,000,000 BMA Basis Swap - CMS Swap - Total 400,000,000  Institutions can choose an efficient portfolio of debt instruments, again subject to individual risk tolerance constraints 10 O V E R V I E W  O F  R I S K  M A N A G E M E N T  P R I N C I P L E S
  • 13. E A C U B O   2 0 0 8 Finally, we can also incorporate operational exposures that are specific to each institution  Institutions have a number of potential operational risk exposures:  Changes in top line revenue  Changes in expenses  Changes in Endowment distribution  Other potential sources of risk:  Healthcare related income / expenses  Royalties  State contributions 11 O V E R V I E W  O F  R I S K  M A N A G E M E N T  P R I N C I P L E S
  • 14. E A C U B O   2 0 0 8 The Central Treasury function manages a number of different risks for the University Internal Loans Internal Deposits Return: 4.5% Volatility: 0.5% Cost: 5.0% Volatility: 0.0% Capital Projects Operations $250mm Central Treasury External Assets External Debt Return: 6.5% Volatility: 4.5% Cost: 4.25% Volatility: 0.4% $500mm $400mm $350mm 12 O V E R V I E W  O F  R I S K  M A N A G E M E N T  P R I N C I P L E S
  • 15. E A C U B O   2 0 0 8 With this framework, institutions can choose an appropriate level of risk, and maximize related net returns Potential Net Risk/Return Alternatives1Potential Net Risk/Return Alternatives1 Current Portfolio Efficient Frontier of Central Treasury 1 Opinion and estimates offered constitute our judgment and are subject to change without notice, as are statements on financial market trends, which are based on current market conditions. We believe the information provided herein is reliable, but it should not be assumed to be either accurate or complete. Actual cash flows may vary substantially from figures shown based upon changes in market condition, our judgment or the underlying assumptions or methodology employed. Past performance should not be taken as a guarantee of future results. Analysis includes assumptions for initial and average interest rates, correlations, volatility and reversion speed, among others. Volatility is defined here as standard deviation of annual changes in an exposure, and not necessarily a cross section of potential future cumulative outcomes. $354 $455 $556 $657 $758 $859 $960 $1,061 $1,162 $1,263 5Y Ending Balance Current Solution Ending Balance Distribution ($mm)Ending Balance Distribution ($mm) Solution 13 O V E R V I E W  O F  R I S K  M A N A G E M E N T  P R I N C I P L E S
  • 16. E A C U B O   2 0 0 8 Better understanding of risk exposures leads to superior balance sheet risk management  Measures of annual risk exposure  Annual external debt portfolio volatility of $4 million  Annual external investment volatility of $22 million  Annual net balance sheet volatility of $23 million  Size appropriate reserves  95% confidence level reserve: $55 million  Determine appropriate liquidity requirements  A liquidity strategy is essential to anticipate sources of risk that cannot be wholly quantified 14 O V E R V I E W  O F  R I S K  M A N A G E M E N T  P R I N C I P L E S
  • 17. Agenda Page E A C U B O   2 0 0 8 Treasury Management at University of Pennsylvania Internal Bank Management at University of Virginia Overview of Risk Management Principles Introduction 15 1 5 15 24 C R E A T I N G  S U P E R I O R  B A L A N C E  S H E E T  R I S K  M A N A G E M E N T  S O L U T I O N S
  • 18. E A C U B O   2 0 0 8 University of Virginia Overview  Public University Founded by Thomas Jefferson in 1819  Ranked #2 among public universities and #23 among all universities in U.S. News and World Report’s 2008 Rankings  Fall 2007 - 20,834 students enrolled in 10 Schools on Main Grounds  FY 2007 Financial Data  Net Assets = $5.4b  Total Revenue = $2.8b  Debt Outstanding = $573m  Endowment Value = $4.4b  AAA ratings from Moody’s, S&P, and Fitch  Operates the University of Virginia Medical Center  Recognized among Solucient’s Top 100 Hospitals every year since 1998  Responsible for 31% of University’s FY07 Total Revenue 16 I N T E R N A L  B A N K  M A N A G E M E N T  A T  U N I V E R S I T Y  O F  V I R G I N I A
  • 19. E A C U B O   2 0 0 8 University of Virginia Treasury Department Overview  Debt Management  Fixed and Variable Rate Bonds  Commercial Paper  Interest Rate Derivatives  Investment Management  ST Investment Management  Oversight of LT Investments in Endowment  Oversight of Other Financial Assets (Securities, Trusts, etc.)  Cash Management  Bank Account Management  Cash Forecasting  Internal Bank Management  Internal Loan Program  Internal Investment Program  Quasi-endowment Administration 17 I N T E R N A L  B A N K  M A N A G E M E N T  A T  U N I V E R S I T Y  O F  V I R G I N I A
  • 20. E A C U B O   2 0 0 8 Dual Goals of Treasury  University-wide Goals  Optimize risk/return profile for financial assets and liabilities  Provide for sufficient liquidity  Manage the cash flow volatility  Treasury Internal Bank Goals  Manage Budgetary Volatility  Manage Allocation of Financial Resources  Manage Margins 18 I N T E R N A L  B A N K  M A N A G E M E N T  A T  U N I V E R S I T Y  O F  V I R G I N I A
  • 21. E A C U B O   2 0 0 8 Internal Bank Model 19 I N T E R N A L  B A N K  M A N A G E M E N T  A T  U N I V E R S I T Y  O F  V I R G I N I A
  • 22. E A C U B O   2 0 0 8 Scope of Identified Risk Exposures 19 I N T E R N A L  B A N K  M A N A G E M E N T  A T  U N I V E R S I T Y  O F  V I R G I N I A University-wide Internal Bank Investment Activities External Investments External Investments Internal Loans to Units Financing Activities External Borrowing External Borrowing Internal Investments by Units Operating Activities University Operating Cash Flow University Non-Financial Capital Flows Cash Flow Managed by Treasury
  • 23. E A C U B O   2 0 0 8 Treasury Internal Bank Balance Sheet 20 I N T E R N A L  B A N K  M A N A G E M E N T  A T  U N I V E R S I T Y  O F  V I R G I N I A Assets Cash 27,232 Short Term Investments 98,393 Internal Borrowing Program Receivable 321,521 Long Term Investments (LTP) 539,822 Total Assets 986,968 Liabilities Short Term Debt - Commercial Paper and Other 84,900 Long Term Debt - Bonds 505,151 Bond Premium/Discount 17,779 Internal Investment Program (IIP) Deposits 358,859 Deposits Due To/(From) Departments (9,218) Total Liabilities 957,471 Retained Earnings 29,868 Net Assets Designated to Budget Office (372) Net Assets 29,496 Total Net Assets and Liabilities 986,968 Internal Bank Balance Sheet – December 31, 2007 ($000’s) Internal Bank Balance Sheet – December 31, 2007 ($000’s)
  • 24. E A C U B O   2 0 0 8 Initial Internal Bank risk assessment Internal Bank Risk Factors ($ in mm) – FYE 12/30 Internal Bank Risk Factors ($ in mm) – FYE 12/30 21 I N T E R N A L  B A N K  M A N A G E M E N T  A T  U N I V E R S I T Y  O F  V I R G I N I A
  • 25. E A C U B O   2 0 0 8 Pursuing the Efficient Frontier Potential Internal Bank Alternatives1Potential Internal Bank Alternatives1 1 Opinion and estimates offered constitute our judgment and are subject to change without notice, as are statements on financial market trends, which are based on current market conditions. We believe the information provided herein is reliable, but it should not be assumed to be either accurate or complete. Actual cash flows may vary substantially from figures shown based upon changes in market condition, our judgment or the underlying assumptions or methodology employed. Past performance should not be taken as a guarantee of future results. Analysis includes assumptions for initial and average interest rates, correlations, volatility and reversion speed, among others. Volatility is defined here as standard deviation of annual changes in an exposure, and not necessarily a cross section of potential future cumulative outcomes.  UVA can choose a desirable risk level and implement changes to any number of the underlying risk factors  External investments  External debt  Internal debt  Internal deposits Current Portfolio Efficient Frontier of portfolio combinations 22 I N T E R N A L  B A N K  M A N A G E M E N T  A T  U N I V E R S I T Y  O F  V I R G I N I A
  • 26. E A C U B O   2 0 0 8 Developing a Planning Horizon  INSERT 23 I N T E R N A L  B A N K  M A N A G E M E N T  A T  U N I V E R S I T Y  O F  V I R G I N I A
  • 27. E A C U B O   2 0 0 8 Optimizing the Portfolio 23 I N T E R N A L  B A N K  M A N A G E M E N T  A T  U N I V E R S I T Y  O F  V I R G I N I A
  • 28. E A C U B O   2 0 0 8 Next Steps on Balance Sheet Management  Education and Buy-in  Drawing from the Endowment Model  Making it manageable  Setting Priorities between External and Internal Goals  Implementation 18 I N T E R N A L  B A N K  M A N A G E M E N T  A T  U N I V E R S I T Y  O F  V I R G I N I A
  • 29. Agenda Page E A C U B O   2 0 0 8 Treasury Management at University of Pennsylvania Internal Bank Management at University of Virginia Overview of Risk Management Principles Introduction 24 1 5 15 24 C R E A T I N G  S U P E R I O R  B A L A N C E  S H E E T  R I S K  M A N A G E M E N T  S O L U T I O N S
  • 30. E A C U B O   2 0 0 8 University overview & background  Academic Component  12 Schools  Health System  3 Hospitals  19 Clinical Practices  Revenues of $4.8 billion  55% Health System  15% Research; 13% Tuition; 6% Investment income; 10% Other  Expenses of $4.4 Billion  53% Health System  47% Academic  $7.3 Billion Investments  $6.6 billion Endowment  $1.3 Billion Debt 25 T R E A S U R Y  M A N A G E M E N T  A T  U N I V E R S I T Y  O F  P E N N S Y L V A N I A
  • 31. E A C U B O   2 0 0 8 Overview of treasury structure  $705 Million Working Capital at December 31,2007  $340 Million money market investment — Recent in depth review of all money market funds in conjunction with our Investment Office  $320 Million invested in the University’s endowment  $45 Million in Stafford loans  $570 Million Debt  $228 Million variable rate — $123 Million in auction market — $62 Million in VRDO market — $43 Million in private placements, bank loans  $342 Million fixed rate debt  $200 Million Projected Borrowing Needs  $100 Million forward starting fixed rate swap 26 T R E A S U R Y  M A N A G E M E N T  A T  U N I V E R S I T Y  O F  P E N N S Y L V A N I A
  • 32. E A C U B O   2 0 0 8 Management goals & objectives  Optimize investment return within acceptable risk parameters  Primary object for working capital is preservation of capital  Competitive real return — Cash return (benchmarked at tbill) supports operating budget — Excess return funds a reserve and supports President’s initiatives  Stable return — Reserve fund created — Currently 5% of equity fund — Target 10% of equities  Optimize debt service cost within acceptable risk parameters  Debt policy — Consider the hedge between cash and variable debt — May choose to issue fixed rate in historically low environments to preserve variable capacity  Derivatives policy — May be used to reduce costs or hedge exposures — Review broker exposures relative to market value of derivatives 27 T R E A S U R Y  M A N A G E M E N T  A T  U N I V E R S I T Y  O F  P E N N S Y L V A N I A
  • 33. E A C U B O   2 0 0 8 Scope of identified risk exposures  Investment activities  Return volatility  Call on cash from schools  Capital expenditures  Financing activities  Variable Rate exposure — SIFMA vs LIBOR — Health System risk  Operational activities  Business continuity — Identified critical procedures — Contract for off campus facilities in emergency 28 T R E A S U R Y  M A N A G E M E N T  A T  U N I V E R S I T Y  O F  P E N N S Y L V A N I A
  • 34. E A C U B O   2 0 0 8 Sample analysis of alternative investment portfolios for working capital Opinion and estimates offered constitute our judgment and are subject to change without notice, as are statements on financial market trends, which are based on current market conditions. We believe the information provided herein is reliable, but it should not be assumed to be either accurate or complete. Actual cash flows may vary substantially from figures shown based upon changes in market condition, our judgment or the underlying assumptions or methodology employed. Past performance should not be taken as a guarantee of future results. Alternative Investment Analysis ($inMM)   Current  Portfolio More  Endowment More Fixed  Income More  Alternatives Cash         430          310          100            80  ML 1-3           -              -            180            75  Lehman Agg           -              -            150            50  S&P 500           -              -              -              -    Russell 2000           -              -              -              -    HFR FOF  Conserv.           -              -              -            150  HFR FOF  Strategic           -              -              -              75  Penn Endowment         330          450          330          330          760          760          760          760  Expected Return 6.30% 7.15% 6.93% 7.59% Volatility 3.63% 4.92% 4.02% 4.12% Average Annual  NFI        56.0         66.4         57.3         67.4  95% Worst Case  NFI       (38.0)       (64.9)       (47.0)       (43.5) 29 T R E A S U R Y  M A N A G E M E N T  A T  U N I V E R S I T Y  O F  P E N N S Y L V A N I A
  • 35. E A C U B O   2 0 0 8 In closing…  INSERT 30 T R E A S U R Y  M A N A G E M E N T  A T  U N I V E R S I T Y  O F  P E N N S Y L V A N I A