Download to read offline

![2 | The 300 Club | Managing risk in a complex world | October 2014
1. How risk management changed
Investment life in the early 1990s was easy. The guiding conventional investment
philosophy was to have a portfolio that was simple, transparent, and focused: simple, in
relying primarily on the public markets over time and maintaining a consistent presence in
those markets; transparent, in being relatively easy to understand and explain; and focused,
in concentrating extra efforts on a relatively small number of special strategies that would
have material impacts on the portfolio.
The resulting portfolio’s risk control relied primarily on the transparency of the portfolio
as a whole, and the clear nature of the relationship and behavior to its parts, and only
secondarily on extensive quantitative risk models and systems. It avoided investment
approaches that used significant leverage or non-transparent structures.
As a result, passive indexing of a diversified asset type was the basic investment vehicle.
Portfolios could be constructed using mean-variance models under the assumptions of
proportionate return to risk relationships for major asset types and normal randomness.
Linear models (with the concepts of “alpha,” “beta,” and a number of related risk ratios)
could approximate market and portfolio behavior both for purposes of monitoring risk and
as tools to generally predict portfolio behavior.
Because the style or portfolio is very clear and transparent, with daily and independently
priced securities, activity can easily be monitored contemporaneously. Unexpected behavior,
if it occurs, is instantly clear, and explanations for unexpected behavior can be quickly
determined.
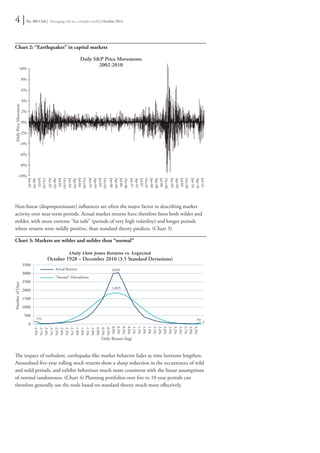
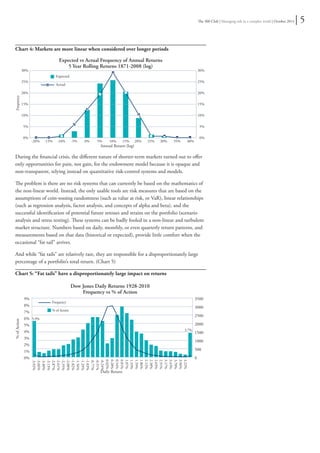
This conventional approach came under severe attack in the late 1990s and 2000s because
of the growing disparity between the long-term views of the capital markets and the shorter-term
behavior of those markets.
In the past decade, the conventional approach moved from being in the mainstream of
multi-billion-dollar investment portfolios to an outlier. The investment world moved on
to a new model of investing, often described as the “endowment model.” This places much
less reliance on major public market exposures and, instead, emphasizes intense active
management, illiquid instruments and vehicles, often embraces leverage, and uses many
detailed and often opportunistic investment strategies.
It tears apart the traditional asset-class categories of equity and fixed income in favor of
supposedly underlying factors, such as “real” returns (commodities, Treasury Inflation-
Protected Securities [TIPS], timberland, real estate), inflation/deflation investments,
credit-based returns (high-yield, equity), quality differentiations, and similar categories
to reorganize the investments in the portfolio. It requires that risk be managed actively
through extensive quantitative models and risk-control systems.](https://image.slidesharecdn.com/300club-bobmaynard-managingriskinacomplexworld2-141109131232-conversion-gate01/85/Managing-Risk-In-A-Complex-World-Bob-Maynard-2-320.jpg)


The document discusses the evolving landscape of risk management in investing, emphasizing the shift from traditional transparent and straightforward models to more complex, opaque systems. It critiques the 'endowment model' adopted in the 2000s for its failure during market crises, asserting that simplicity, transparency, and proper liquidity are key to effective risk control. Ultimately, it advocates for a return to basic principles of risk management that prioritize understanding portfolio behaviors over reliance on complex quantitative models.


