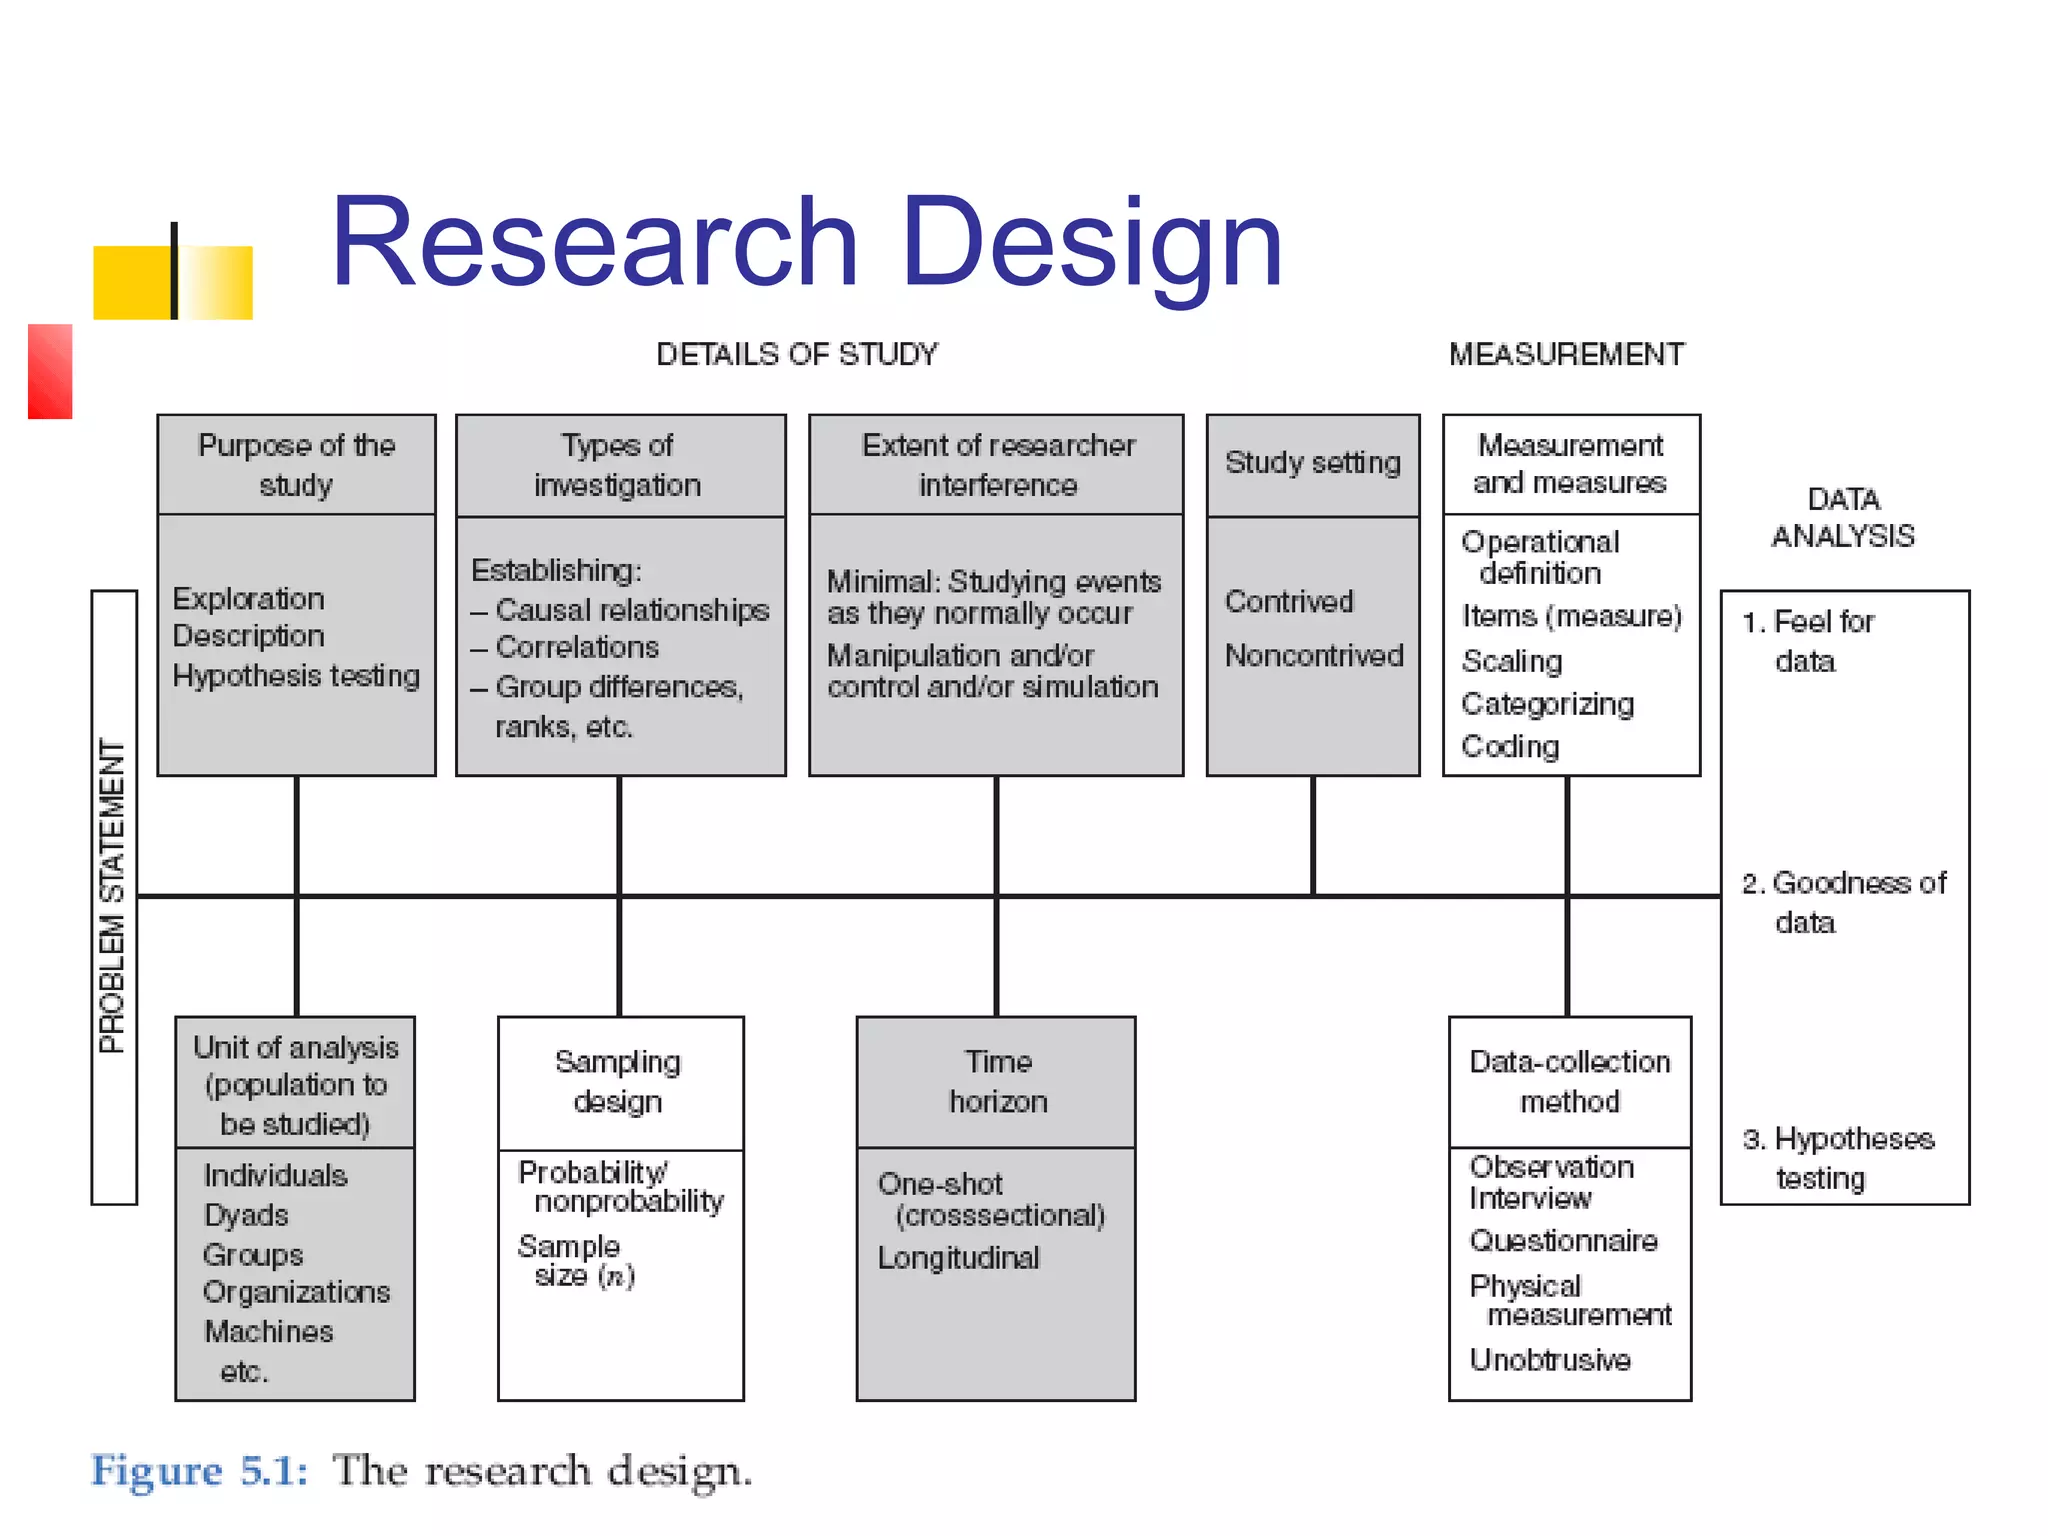
The Research Process: Elements
of Research Design

          CHAPTER 5


                                 1
Chapter Objectives
   Understand the different aspects relevant to
    designing a research study.
   Identify the scope of any given study and the
    end use of the results.
   Describe the type of investigation needed, the
    study setting, the extent of researcher
    interference, the unit of analysis, and the time
    horizon of the study.
   Identify which of the two, a causal or a
    correlational study, would be more
    appropriate in a given situation.
                                                   2
The Research Design
   In this step we need to design the
    research in a way that the requisite data
    can be gathered and analyzed to arrive
    at a solution.
   The research design was originally
    presented in a simple manner in the
    next Figure.

                                            3
Research Design


.John Wiley & Sons Ltd 2009©
                               4
Purpose of the Study


   Exploration
   Description
   Hypothesis Testing


                         5
Purpose of the Study

   Exploratory study:
       is undertaken when not much is known
        about the situation at hand, or no
        information is available on how similar
        problems or research issues have been
        solved in the past.
   Example:
       A service provider wants to know why his
        customers are switching to other service
        providers?    .
                                                   6
Purpose of the Study

   Descriptive study:
      is undertaken in order to ascertain and be able to

       describe the characteristics of the variables of
       interest in a situation.
   Example:
      A bank manager wants to have a profile of the

       individuals who have loan payments outstanding for
       6 months and more. It would include details of their
       average age, earnings, nature of occupation, full-
       time/part-time employment status, and the like. This
       might help him to elicit further information or decide
       right away on the types of individuals who should be
       made ineligible for loans in the future.                 7
Purpose of the Study

   Hypothesis testing:
       Studies that engage in hypotheses testing
        usually explain the nature of certain
        relationships, or establish the differences
        among groups or the independence of two
        or more factors in a situation.
   Example:
       A marketing manager wants to know if the
        sales of the company will increase if he
        doubles the advertising dollars.
                                                      8
Type of Investigation

   Causal Study
       it is necessary to establish a definitive
        cause-and-effect relationship.
   Correlational study
       identification of the important factors
        “associated with” the problem.


                                                    9
Study Setting

   Contrived: artificial setting

   Non-contrived: the natural environment
    where work proceeds normally


                                             10
Examples
   A causal study question:
     Does smoking cause cancer?
   A correlational study question:
     Are smoking and cancer related?
                Or
     Are smoking, drinking, and chewing
    tobacco associated with cancer?
    If so, which of these contributes most to the
    variance in the dependent variable?
                                                    11
Example: causal relationship
   Fears of an earthquake predicted
    recently in an area were a causal of a
    number of crashes of some houses in
    the area in order to be eligible of
    insurance policy.


                                             12
Example: correlational relationship
   Increases in interest rates and property
    taxes, the recession, and the predicted
    earthquake considerably slowed down
    the business of real state agents in the
    country.


                                           13
Extent of Researcher Interference
With the Study

   The extent of interference by the
    researcher with the normal flow of work
    at the workplace has a direct
    bearing on whether the study
    undertaken is causal or correlational.


                                          14
Extent of Researcher Interference
With the Study

   A correlational study is conducted in
    the natural environment of the
    organization with minimum interference
    by the researcher with the normal flow
    of work.


                                         15
Extent of Researcher Interference
With the Study
   In studies conducted to establish cause-
    and-effect relationships , the researcher
    tries to manipulate certain variables so
    as to study the effects of such manipulation
    on the dependent variable of interest.
   In other words, the researcher deliberately
    changes certain variables in the setting
    and interferes with the events as they
    normally occur in the organization.
                                                   16
Minimal Interference
    Example
   A hospital administrator wants to
    examine the relationship between the
    perceived emotional support in the
    system and the stress experienced by
    the nursing staff. In other words, she
    wants to do a correlational study.

                                             17
.(Example (Cont
   The researcher will collect data from the
    nurses ( through a questionnaire) to indicate
    how much emotional support they get in the
    hospital and to what extent they experience
    stress. By correlating the two variables, the
    answer is found.

    In this case, beyond administering a
    questionnaire to the nurses, the
    researcher has not interfered with the
    normal activities in the hospital.

                                                    18
Moderate Interference
   If the researcher wants to establish a
    causal connection between the
    emotional support in the hospital and
    stress, or, wants to demonstrate that if
    the nurses had emotional support, this
    indeed would cause them to
    experience less stress.

                                               19
Moderate Interference
   To test the cause-and-effect
    relationship, the researcher will measure the
    stress currently experienced by the nurses in
    three wards in the hospital, and then
    deliberately manipulate the extent of
    emotional support given to the three groups
    of nurses in the three wards for perhaps a
    week, and measure the amount of stress at
    the end of that period.
                                                20
Moderate Interference
   For one group, the researcher will ensure
    that a number of lab technicians and doctors
    help and comfort the nurses when they face
    stressful events.
   For a second group of nurses in another
    ward, the researcher might arrange for them
    only a moderate amount of emotional support
    and employing only the lab technicians and
    excluding doctors.
                                               21
Moderate Interference
   The third ward might operate without any
    emotional support.
   If the experimenter’s theory is correct ,
    then the reduction in the stress levels
    before and after the 1-week period should be
    greater for the nurses in the first ward,
    moderate for those in the second ward,
    and nil for the nurses in the third ward.


                                               22
Moderate Interference
   We find that not only does the researcher
    collect data from nurses on their experienced
    stress at two different points in time, but also
    manipulated the normal course of events
    by deliberately changing the amount of
    emotional support received by the
    nurses in two wards, while leaving things in
    the third ward unchanged.

    Here, the researcher has interfered
    more than minimally.
                                                  23
Excessive Interference
    Example
   IF the researcher feels, after conducting the previous
    experiments, that the results may not be valid
    since other external factors might have
    influenced the stress levels experience by the nurses.
   For example, during that particular experimental
    week, the nurses in one or more wards may not
    have experienced high levels of stress
    because there were no serious illnesses or deaths in
    the ward. Hence the emotional support
    received might not be related to the level of
    stresses experienced.


                                                        24
Excessive Interference
   The researcher want to make sure that
    such external factors that might affect
    the cause-and-effect relationship
    are controlled .


                                          25
Controlling the External factors
   The researcher might take three groups of
    medical students, put them in different rooms,
    and confront all of them with the same
    stressful task.
   For example, he might ask them to describe
    in detail, the surgical procedures in
    performing surgery on a patient who has not
    responded to chemotherapy and keep asking
    them with more and more questions.
                                                 26
Controlling the External factors
   Although all are exposed to the same
    intensive questioning, one group might get
    help from a doctor who voluntarily offers
    clarifications and help when students
    stumble.
   In the second group, a doctor might be
    nearby, but might offer clarifications and help
    only if the group seeks it.
   In the third group, there is no doctor
    present and no help is available.
                                                  27
Controlling the External factors
   In the above example, not only is the
    support manipulated , but even the
    setting in which this experiment is
    conducted is artificial inasmuch as the
    researcher has taken the subject away from
    their normal environment and put them in a
    totally different setting.
   The researcher has intervened maximally
    with the normal setting, the participants, and
    their duties.

                                                 28
Excessive Interference
   The extent of researcher interference
    would depend on whether the study is
    correlational or causal and also the
    importance of establishing causal
    relationship beyond any doubt.
   Most organizational problems seldom
    call for a causal study, except in some
    market research areas.
                                              29
Study Setting: Contrived and
Noncontrived
   Correlational studies are conducted
    in noncontrived settings (normal
    settings), whereas most causal
    studies are done in contrived settings.
   Correlational studies done in
    organizations are called field studies.


                                          30
Study Setting: Contrived and
Noncontrived
   Studies conducted to establish cause-and-
    effect relationship using the same
    natural environment in which employees
    normally function are called field
    experiments .
   Experiments done to establish cause-and-
    effect relationship in a contrived
    environment and strictly controlled are
    called lab experiments .
                                                31
Example: Field Study
   A bank manager wants to analyze the
    relationship between interest rates and bank
    deposit patterns of clients.
    The researcher tries to correlate the two by
    looking at deposits into different kinds of
    accounts (such as savings, certificates of
    deposit, and interest-bearing checking
    accounts) as interest rates changed.


                                                   32
Example: Field Study
   This is a field study where the bank
    manager has taken the balances in various
    types of accounts and correlated them to
    the changes in interest rates.
   Research here is done in a noncontrived
    setting with no interference with the normal
    work routine.


                                                33
Example: Field Experiment
   The bank manager now wants to
    determine the cause-and-effect
    relationship between interest rate and
    the inducements it offers to clients to
    save and deposit money in the bank.
    The researcher selects four branches
    within 60/km radius for the experiment.

                                          34
Example: Field Experiment
   For 1 week only, he advertises the annual
    rate for new certificates of deposit received
    during that week. The interest rate would be
    9% in one branch, 8% in another, and
    10% in the third. In the fourth branch,
    the interest rate remains unchanged at
    5%. Within the week, the researcher would
    be able to determine the effects, if any, of
    interest rates on deposit mobilization.

                                                35
Example: Field Experiment
   This example would be a field experiment
    since nothing but the interest rate is
    manipulated, with all activities occurring in the
    normal and natural work environment.
   Hopefully, all four branches chosen
    would be compatible in size, number of
    depositors, deposit patterns, and the like, so
    that the interest-savings relationships
    are influenced by some third factor .
                                                   36
Example: Lab Experiment
   To be sure about the true relationship
    between the interest rate and deposits, the
    researcher could create an artificial
    environment by choosing, for instance, 40
    students who are all business majors in their
    final year of study and in the same age. The
    researcher splits the students into four groups
    and give each one of them $1000, which they
    are told they might buy their needs or save
    for the future, or both.

                                                 37
Example: Lab Experiment
 The researcher offers them interest on what they save
  as followings:
 6% on savings for group 1.

 8% for group 2.

 9% for group 3.

 1% for group 4 ( the old rate of interest).

  Here, the researcher has created an artificial
  laboratory environment and has manipulated
  the interest rates for savings. He also chosen
  subjects with similar backgrounds.


                                                     38
Population to be Studied

   Unit of analysis:
       Individuals
       Dyads
       Groups
       Organizations
       Cultures


                        .
                            39
Unit of Analysis: Individual
     If the researcher focuses on how to
      raise the motivational levels of
      employees, then we are interested in
      individual employees in the
      organization. Here the unit of
      analysis is the individual (the data
      will be gathered from each individual).

                                           40
Unit of Analysis: Dyads
    If the researcher is interested in
     studying two-person interaction, then
     several two-person groups also
     known as dyads, will become the
     unit of analysis ( analysis of
     husband-wife, and supervisor-
     subordinate relationships at the work
     place.
                                         41
Unit of Analysis
   Groups as a unit of analysis
   Organizations as a unit of

    analysis
   Cultures as a unit of analysis


                                     42
Example: Individuals as The Unit
of Analysis
   The Chief Financial Officer of a
    manufacturing company wants to know how
    many of the staff would be interested in
    attending a 3-day seminar on making
    appropriate investment decisions.
   Data will have to be collected from each
    individual staff member and the unit of
    analysis is individual.
   The unit of analysis is the individual .
                                               43
Example: Dyads as the Unit of
Analysis
   A human resources manager wants to
    first identify the number of employees in
    three departments of the organization
    who are in mentoring relationships, and
    then find out what the jointly perceived
    benefits of such a relationship are.


                                            44
Example: Dyads as the Unit of
Analysis
   Once the mentor and the mentored pairs are
    identified, their joint perceptions can be
    obtained by treating each pair as one unit.
   If the manager wants data from a sample of
    10 pairs, he will have to deal with 20
    individuals, a pair at a time. The information
    obtained from each pair will be a data point
    for subsequent analysis.
   Thus, the unit of analysis is the dyad .
                                                     45
Example: Groups as Unit of
Analysis
   A manager wants to see the patterns of
    usage of the newly installed Information
    System (IS) by the production, sales, and
    operations personnel.
   Here three groups of personnel are involved
    and information on the number of times the
    IS is used by each member in each of the
    three groups as well as other relevant issues
    will be collected and analyzed.
   Here the unit of analysis is the group .
                                                    46
Example: Divisions as the Unit of
Analysis
   Johnson & Johnson company wants to see
    which of its various divisions (soap, shampoo,
    body oil, etc.) have made profits of over 12%
    during the current year.
   Here, the profits of each of the divisions will
    be examined and the information
    aggregated across the various geographical
    units of the division.
   The unit of analysis will be the division,
    at which level the data will be
    aggregated.
                                                 47
Example: Industry as the Unit of
Analysis
   An employment survey specialist wants to
    see the proportion of the workforce employed
    by the health care, transportation, and
    manufacturing industries.
   The researcher has to aggregate the data
    relating to each of the subunits
    comprised in each of the industries and report
    the proportions of the workforce employed at
    the industry level.
                                                48
Example: Industry as the Unit of
Analysis
   The health care industry, for instance,
    includes hospitals, nursing homes, small and
    large clinics, and other health care providing
    facilities.
   The data from these subunits will have to be
    aggregated to see how many employees are
    employed by the heath care industry.
   This will need to be done for each of the other
    industries.
                                                 49
Example: Countries as the Unit
of Analysis
   The Chief Financial Officer (CFO)
    of a multinational corporation wants to
    know the profits made during the past 5
    years by each of the subsidiaries in
    England, Germany, and France. It is
    possible that there are many regional
    offices of these subsidiaries in each of
    these countries.
                                           50
Example: Countries as the Unit
of Analysis
   The profits of the various regional
    centers for each country have to be
    aggregated and the profits for each
    country for the past 5 years provided to
    the CFO.
   The data will now have to be
    aggregated at the country level .

                                           51
Time Horizon

   Cross-sectional studies
      Snapshot of constructs at a single point in time

      Use of representative sample

   Multiple cross-sectional studies
      Constructs measured at multiple points in time

      Use of different sample

   Longitudinal studies
      Constructs measured at multiple points in time

      Use of same sample = a true panel


                          .
                                                          52
Time Horizon: Cross-Sectional
Versus Longitudinal Studies
 Example
 Data were collected from stock brokers

  between April and June of last year to
  study their concerns in a turbulent stock
  market.
 Data has to be collected at one

  point in time. It is a cross-
  sectional design.

                                          53
Time Horizon: Cross-Sectional
Versus Longitudinal Studies
  Example
    A drug company desirous of investing in
   research for a new headache pill conducted a
   survey among headachy people to see how
   many of them would be interested in trying
   the new pill.
 This is a one-shot or cross-sectional
   study to assess the likely demand for the
   new product.


                                              54
Time Horizon: Cross-Sectional
Versus Longitudinal Studies
   Longitudinal Studies
    Studying people or phenomena at more
    than one point in time in order to
    answer the research question.
     Because data are gathered at two
    different points in time, the study is not
    cross-sectional kind, but is carried
    longitudinally across a period of time.

                                             55
Example
   A marketing manager is interested in tracing
    the pattern of sales of a particular product in
    four different regions of the country on a
    quarterly basis for the next 2 years.
   Since the data are collected several
    times to answer the same issue, the study
    falls under the longitudinal category.


                                                      56
Time Horizon: Cross-Sectional
Versus Longitudinal Studies
   Longitudinal studies take more time and effort
    and cost more than cross-sectional studies. However,
    well-planned longitudinal studies could help to identify
    cause-and-effect relationships.
   For example, one could study the sales volume of
    a product before and after an advertisement,
    and provided other environmental changes have not
    impacted on the results, one could attribute the
    increase in the sales volume, if any, to the
    advertisement.


                                                          57
Exercise
A supervisor thinks that the low
 efficiency of the machine tool operators
 is directly linked to the high level of
 fumes emitted in the workshop. He
 would like to prove this to his supervisor
 through a research study.
1. Would this be a causal or a
 correlational study? Why?
                                          58
Exercise
2. Is this an exploratory, descriptive, or
 hypothesis-testing (analytical or predictive)
 study? Why?
3. What kind of study would this be: field study,
 lab experiment, or field experiment? Why?
4. What would be the unit of analysis? Why?
5. Would this be a cross-section or a
 longitudinal study? Why?


                                                59
Answers to the Exercise
1.   This would be a causal study because the
     operator wants to prove to the supervisor that the
     fumes are causing operators to be low in their
     efficiency. In other words, the machine tool operator
     is trying to establish the fact that fumes cause low
     efficiency in workers.
2.   This is an analytical study because the machine
     tool operator wants to establish that fumes cause
     low efficiency and convince his workshop supervisor
     through such analysis (i.e. establish cause and
     effect relationship).


                                                         60
Answers to the Exercise
3.   This would be a field experiment . Though the
     study would be set up in the natural environment of
     the workers where the work is normally done, the
     amount of fumes will have to be manipulated while
     other factors such as atmospheric pressure may
     have to be controlled. Because of the location of
     the study, it will be a field experiment.
4.   The unit of analysis would be the individual
     operators. The data will be collected with respect to
     each operator and then the conclusions will be
     made as to whether the operators are less efficient
     because of the fumes emitted in the workshop.
                                                        61
Answers to the Exercise
5.   This would be a longitudinal study
     because data will be gathered at more than
     one point in time. First, the efficiency of the
     operators would be assessed at a given rate
     of fume emission. Then the fumes emitted
     would be manipulated to varying degrees,
     and at each manipulation, the efficiency of
     the workers would again be assessed to
     confirm that the high rate of fume emission
     causes a drop in operators’ efficiency.

                                                   62
Answers to the Exercise
6.   This would be a longitudinal study
     because data will be gathered at more than
     one point in time. First, the efficiency of the
     operators would be assessed at a given rate
     of fume emission. Then the fumes emitted
     would be manipulated to varying degrees,
     and at each manipulation, the efficiency of
     the workers would again be assessed to
     confirm that the high rate of fume emission
     causes a drop in operators’ efficiency.

                                                   63

200 chapter 5

  • 1.
    The Research Process:Elements of Research Design CHAPTER 5 1
  • 2.
    Chapter Objectives  Understand the different aspects relevant to designing a research study.  Identify the scope of any given study and the end use of the results.  Describe the type of investigation needed, the study setting, the extent of researcher interference, the unit of analysis, and the time horizon of the study.  Identify which of the two, a causal or a correlational study, would be more appropriate in a given situation. 2
  • 3.
    The Research Design  In this step we need to design the research in a way that the requisite data can be gathered and analyzed to arrive at a solution.  The research design was originally presented in a simple manner in the next Figure. 3
  • 4.
    Research Design .John Wiley& Sons Ltd 2009© 4
  • 5.
    Purpose of theStudy  Exploration  Description  Hypothesis Testing 5
  • 6.
    Purpose of theStudy  Exploratory study:  is undertaken when not much is known about the situation at hand, or no information is available on how similar problems or research issues have been solved in the past.  Example:  A service provider wants to know why his customers are switching to other service providers? . 6
  • 7.
    Purpose of theStudy  Descriptive study:  is undertaken in order to ascertain and be able to describe the characteristics of the variables of interest in a situation.  Example:  A bank manager wants to have a profile of the individuals who have loan payments outstanding for 6 months and more. It would include details of their average age, earnings, nature of occupation, full- time/part-time employment status, and the like. This might help him to elicit further information or decide right away on the types of individuals who should be made ineligible for loans in the future. 7
  • 8.
    Purpose of theStudy  Hypothesis testing:  Studies that engage in hypotheses testing usually explain the nature of certain relationships, or establish the differences among groups or the independence of two or more factors in a situation.  Example:  A marketing manager wants to know if the sales of the company will increase if he doubles the advertising dollars. 8
  • 9.
    Type of Investigation  Causal Study  it is necessary to establish a definitive cause-and-effect relationship.  Correlational study  identification of the important factors “associated with” the problem. 9
  • 10.
    Study Setting  Contrived: artificial setting  Non-contrived: the natural environment where work proceeds normally 10
  • 11.
    Examples  A causal study question: Does smoking cause cancer?  A correlational study question: Are smoking and cancer related? Or Are smoking, drinking, and chewing tobacco associated with cancer? If so, which of these contributes most to the variance in the dependent variable? 11
  • 12.
    Example: causal relationship  Fears of an earthquake predicted recently in an area were a causal of a number of crashes of some houses in the area in order to be eligible of insurance policy. 12
  • 13.
    Example: correlational relationship  Increases in interest rates and property taxes, the recession, and the predicted earthquake considerably slowed down the business of real state agents in the country. 13
  • 14.
    Extent of ResearcherInterference With the Study  The extent of interference by the researcher with the normal flow of work at the workplace has a direct bearing on whether the study undertaken is causal or correlational. 14
  • 15.
    Extent of ResearcherInterference With the Study  A correlational study is conducted in the natural environment of the organization with minimum interference by the researcher with the normal flow of work. 15
  • 16.
    Extent of ResearcherInterference With the Study  In studies conducted to establish cause- and-effect relationships , the researcher tries to manipulate certain variables so as to study the effects of such manipulation on the dependent variable of interest.  In other words, the researcher deliberately changes certain variables in the setting and interferes with the events as they normally occur in the organization. 16
  • 17.
    Minimal Interference Example  A hospital administrator wants to examine the relationship between the perceived emotional support in the system and the stress experienced by the nursing staff. In other words, she wants to do a correlational study. 17
  • 18.
    .(Example (Cont  The researcher will collect data from the nurses ( through a questionnaire) to indicate how much emotional support they get in the hospital and to what extent they experience stress. By correlating the two variables, the answer is found.  In this case, beyond administering a questionnaire to the nurses, the researcher has not interfered with the normal activities in the hospital. 18
  • 19.
    Moderate Interference  If the researcher wants to establish a causal connection between the emotional support in the hospital and stress, or, wants to demonstrate that if the nurses had emotional support, this indeed would cause them to experience less stress. 19
  • 20.
    Moderate Interference  To test the cause-and-effect relationship, the researcher will measure the stress currently experienced by the nurses in three wards in the hospital, and then deliberately manipulate the extent of emotional support given to the three groups of nurses in the three wards for perhaps a week, and measure the amount of stress at the end of that period. 20
  • 21.
    Moderate Interference  For one group, the researcher will ensure that a number of lab technicians and doctors help and comfort the nurses when they face stressful events.  For a second group of nurses in another ward, the researcher might arrange for them only a moderate amount of emotional support and employing only the lab technicians and excluding doctors. 21
  • 22.
    Moderate Interference  The third ward might operate without any emotional support.  If the experimenter’s theory is correct , then the reduction in the stress levels before and after the 1-week period should be greater for the nurses in the first ward, moderate for those in the second ward, and nil for the nurses in the third ward. 22
  • 23.
    Moderate Interference  We find that not only does the researcher collect data from nurses on their experienced stress at two different points in time, but also manipulated the normal course of events by deliberately changing the amount of emotional support received by the nurses in two wards, while leaving things in the third ward unchanged.  Here, the researcher has interfered more than minimally. 23
  • 24.
    Excessive Interference Example  IF the researcher feels, after conducting the previous experiments, that the results may not be valid since other external factors might have influenced the stress levels experience by the nurses.  For example, during that particular experimental week, the nurses in one or more wards may not have experienced high levels of stress because there were no serious illnesses or deaths in the ward. Hence the emotional support received might not be related to the level of stresses experienced. 24
  • 25.
    Excessive Interference  The researcher want to make sure that such external factors that might affect the cause-and-effect relationship are controlled . 25
  • 26.
    Controlling the Externalfactors  The researcher might take three groups of medical students, put them in different rooms, and confront all of them with the same stressful task.  For example, he might ask them to describe in detail, the surgical procedures in performing surgery on a patient who has not responded to chemotherapy and keep asking them with more and more questions. 26
  • 27.
    Controlling the Externalfactors  Although all are exposed to the same intensive questioning, one group might get help from a doctor who voluntarily offers clarifications and help when students stumble.  In the second group, a doctor might be nearby, but might offer clarifications and help only if the group seeks it.  In the third group, there is no doctor present and no help is available. 27
  • 28.
    Controlling the Externalfactors  In the above example, not only is the support manipulated , but even the setting in which this experiment is conducted is artificial inasmuch as the researcher has taken the subject away from their normal environment and put them in a totally different setting.  The researcher has intervened maximally with the normal setting, the participants, and their duties. 28
  • 29.
    Excessive Interference  The extent of researcher interference would depend on whether the study is correlational or causal and also the importance of establishing causal relationship beyond any doubt.  Most organizational problems seldom call for a causal study, except in some market research areas. 29
  • 30.
    Study Setting: Contrivedand Noncontrived  Correlational studies are conducted in noncontrived settings (normal settings), whereas most causal studies are done in contrived settings.  Correlational studies done in organizations are called field studies. 30
  • 31.
    Study Setting: Contrivedand Noncontrived  Studies conducted to establish cause-and- effect relationship using the same natural environment in which employees normally function are called field experiments .  Experiments done to establish cause-and- effect relationship in a contrived environment and strictly controlled are called lab experiments . 31
  • 32.
    Example: Field Study  A bank manager wants to analyze the relationship between interest rates and bank deposit patterns of clients. The researcher tries to correlate the two by looking at deposits into different kinds of accounts (such as savings, certificates of deposit, and interest-bearing checking accounts) as interest rates changed. 32
  • 33.
    Example: Field Study  This is a field study where the bank manager has taken the balances in various types of accounts and correlated them to the changes in interest rates.  Research here is done in a noncontrived setting with no interference with the normal work routine. 33
  • 34.
    Example: Field Experiment  The bank manager now wants to determine the cause-and-effect relationship between interest rate and the inducements it offers to clients to save and deposit money in the bank. The researcher selects four branches within 60/km radius for the experiment. 34
  • 35.
    Example: Field Experiment  For 1 week only, he advertises the annual rate for new certificates of deposit received during that week. The interest rate would be 9% in one branch, 8% in another, and 10% in the third. In the fourth branch, the interest rate remains unchanged at 5%. Within the week, the researcher would be able to determine the effects, if any, of interest rates on deposit mobilization. 35
  • 36.
    Example: Field Experiment  This example would be a field experiment since nothing but the interest rate is manipulated, with all activities occurring in the normal and natural work environment.  Hopefully, all four branches chosen would be compatible in size, number of depositors, deposit patterns, and the like, so that the interest-savings relationships are influenced by some third factor . 36
  • 37.
    Example: Lab Experiment  To be sure about the true relationship between the interest rate and deposits, the researcher could create an artificial environment by choosing, for instance, 40 students who are all business majors in their final year of study and in the same age. The researcher splits the students into four groups and give each one of them $1000, which they are told they might buy their needs or save for the future, or both. 37
  • 38.
    Example: Lab Experiment The researcher offers them interest on what they save as followings:  6% on savings for group 1.  8% for group 2.  9% for group 3.  1% for group 4 ( the old rate of interest). Here, the researcher has created an artificial laboratory environment and has manipulated the interest rates for savings. He also chosen subjects with similar backgrounds. 38
  • 39.
    Population to beStudied  Unit of analysis:  Individuals  Dyads  Groups  Organizations  Cultures . 39
  • 40.
    Unit of Analysis:Individual  If the researcher focuses on how to raise the motivational levels of employees, then we are interested in individual employees in the organization. Here the unit of analysis is the individual (the data will be gathered from each individual). 40
  • 41.
    Unit of Analysis:Dyads  If the researcher is interested in studying two-person interaction, then several two-person groups also known as dyads, will become the unit of analysis ( analysis of husband-wife, and supervisor- subordinate relationships at the work place. 41
  • 42.
    Unit of Analysis  Groups as a unit of analysis  Organizations as a unit of analysis  Cultures as a unit of analysis 42
  • 43.
    Example: Individuals asThe Unit of Analysis  The Chief Financial Officer of a manufacturing company wants to know how many of the staff would be interested in attending a 3-day seminar on making appropriate investment decisions.  Data will have to be collected from each individual staff member and the unit of analysis is individual.  The unit of analysis is the individual . 43
  • 44.
    Example: Dyads asthe Unit of Analysis  A human resources manager wants to first identify the number of employees in three departments of the organization who are in mentoring relationships, and then find out what the jointly perceived benefits of such a relationship are. 44
  • 45.
    Example: Dyads asthe Unit of Analysis  Once the mentor and the mentored pairs are identified, their joint perceptions can be obtained by treating each pair as one unit.  If the manager wants data from a sample of 10 pairs, he will have to deal with 20 individuals, a pair at a time. The information obtained from each pair will be a data point for subsequent analysis.  Thus, the unit of analysis is the dyad . 45
  • 46.
    Example: Groups asUnit of Analysis  A manager wants to see the patterns of usage of the newly installed Information System (IS) by the production, sales, and operations personnel.  Here three groups of personnel are involved and information on the number of times the IS is used by each member in each of the three groups as well as other relevant issues will be collected and analyzed.  Here the unit of analysis is the group . 46
  • 47.
    Example: Divisions asthe Unit of Analysis  Johnson & Johnson company wants to see which of its various divisions (soap, shampoo, body oil, etc.) have made profits of over 12% during the current year.  Here, the profits of each of the divisions will be examined and the information aggregated across the various geographical units of the division.  The unit of analysis will be the division, at which level the data will be aggregated. 47
  • 48.
    Example: Industry asthe Unit of Analysis  An employment survey specialist wants to see the proportion of the workforce employed by the health care, transportation, and manufacturing industries.  The researcher has to aggregate the data relating to each of the subunits comprised in each of the industries and report the proportions of the workforce employed at the industry level. 48
  • 49.
    Example: Industry asthe Unit of Analysis  The health care industry, for instance, includes hospitals, nursing homes, small and large clinics, and other health care providing facilities.  The data from these subunits will have to be aggregated to see how many employees are employed by the heath care industry.  This will need to be done for each of the other industries. 49
  • 50.
    Example: Countries asthe Unit of Analysis  The Chief Financial Officer (CFO) of a multinational corporation wants to know the profits made during the past 5 years by each of the subsidiaries in England, Germany, and France. It is possible that there are many regional offices of these subsidiaries in each of these countries. 50
  • 51.
    Example: Countries asthe Unit of Analysis  The profits of the various regional centers for each country have to be aggregated and the profits for each country for the past 5 years provided to the CFO.  The data will now have to be aggregated at the country level . 51
  • 52.
    Time Horizon  Cross-sectional studies  Snapshot of constructs at a single point in time  Use of representative sample  Multiple cross-sectional studies  Constructs measured at multiple points in time  Use of different sample  Longitudinal studies  Constructs measured at multiple points in time  Use of same sample = a true panel . 52
  • 53.
    Time Horizon: Cross-Sectional VersusLongitudinal Studies Example  Data were collected from stock brokers between April and June of last year to study their concerns in a turbulent stock market.  Data has to be collected at one point in time. It is a cross- sectional design. 53
  • 54.
    Time Horizon: Cross-Sectional VersusLongitudinal Studies Example  A drug company desirous of investing in research for a new headache pill conducted a survey among headachy people to see how many of them would be interested in trying the new pill.  This is a one-shot or cross-sectional study to assess the likely demand for the new product. 54
  • 55.
    Time Horizon: Cross-Sectional VersusLongitudinal Studies  Longitudinal Studies Studying people or phenomena at more than one point in time in order to answer the research question.  Because data are gathered at two different points in time, the study is not cross-sectional kind, but is carried longitudinally across a period of time. 55
  • 56.
    Example  A marketing manager is interested in tracing the pattern of sales of a particular product in four different regions of the country on a quarterly basis for the next 2 years.  Since the data are collected several times to answer the same issue, the study falls under the longitudinal category. 56
  • 57.
    Time Horizon: Cross-Sectional VersusLongitudinal Studies  Longitudinal studies take more time and effort and cost more than cross-sectional studies. However, well-planned longitudinal studies could help to identify cause-and-effect relationships.  For example, one could study the sales volume of a product before and after an advertisement, and provided other environmental changes have not impacted on the results, one could attribute the increase in the sales volume, if any, to the advertisement. 57
  • 58.
    Exercise A supervisor thinksthat the low efficiency of the machine tool operators is directly linked to the high level of fumes emitted in the workshop. He would like to prove this to his supervisor through a research study. 1. Would this be a causal or a correlational study? Why? 58
  • 59.
    Exercise 2. Is thisan exploratory, descriptive, or hypothesis-testing (analytical or predictive) study? Why? 3. What kind of study would this be: field study, lab experiment, or field experiment? Why? 4. What would be the unit of analysis? Why? 5. Would this be a cross-section or a longitudinal study? Why? 59
  • 60.
    Answers to theExercise 1. This would be a causal study because the operator wants to prove to the supervisor that the fumes are causing operators to be low in their efficiency. In other words, the machine tool operator is trying to establish the fact that fumes cause low efficiency in workers. 2. This is an analytical study because the machine tool operator wants to establish that fumes cause low efficiency and convince his workshop supervisor through such analysis (i.e. establish cause and effect relationship). 60
  • 61.
    Answers to theExercise 3. This would be a field experiment . Though the study would be set up in the natural environment of the workers where the work is normally done, the amount of fumes will have to be manipulated while other factors such as atmospheric pressure may have to be controlled. Because of the location of the study, it will be a field experiment. 4. The unit of analysis would be the individual operators. The data will be collected with respect to each operator and then the conclusions will be made as to whether the operators are less efficient because of the fumes emitted in the workshop. 61
  • 62.
    Answers to theExercise 5. This would be a longitudinal study because data will be gathered at more than one point in time. First, the efficiency of the operators would be assessed at a given rate of fume emission. Then the fumes emitted would be manipulated to varying degrees, and at each manipulation, the efficiency of the workers would again be assessed to confirm that the high rate of fume emission causes a drop in operators’ efficiency. 62
  • 63.
    Answers to theExercise 6. This would be a longitudinal study because data will be gathered at more than one point in time. First, the efficiency of the operators would be assessed at a given rate of fume emission. Then the fumes emitted would be manipulated to varying degrees, and at each manipulation, the efficiency of the workers would again be assessed to confirm that the high rate of fume emission causes a drop in operators’ efficiency. 63