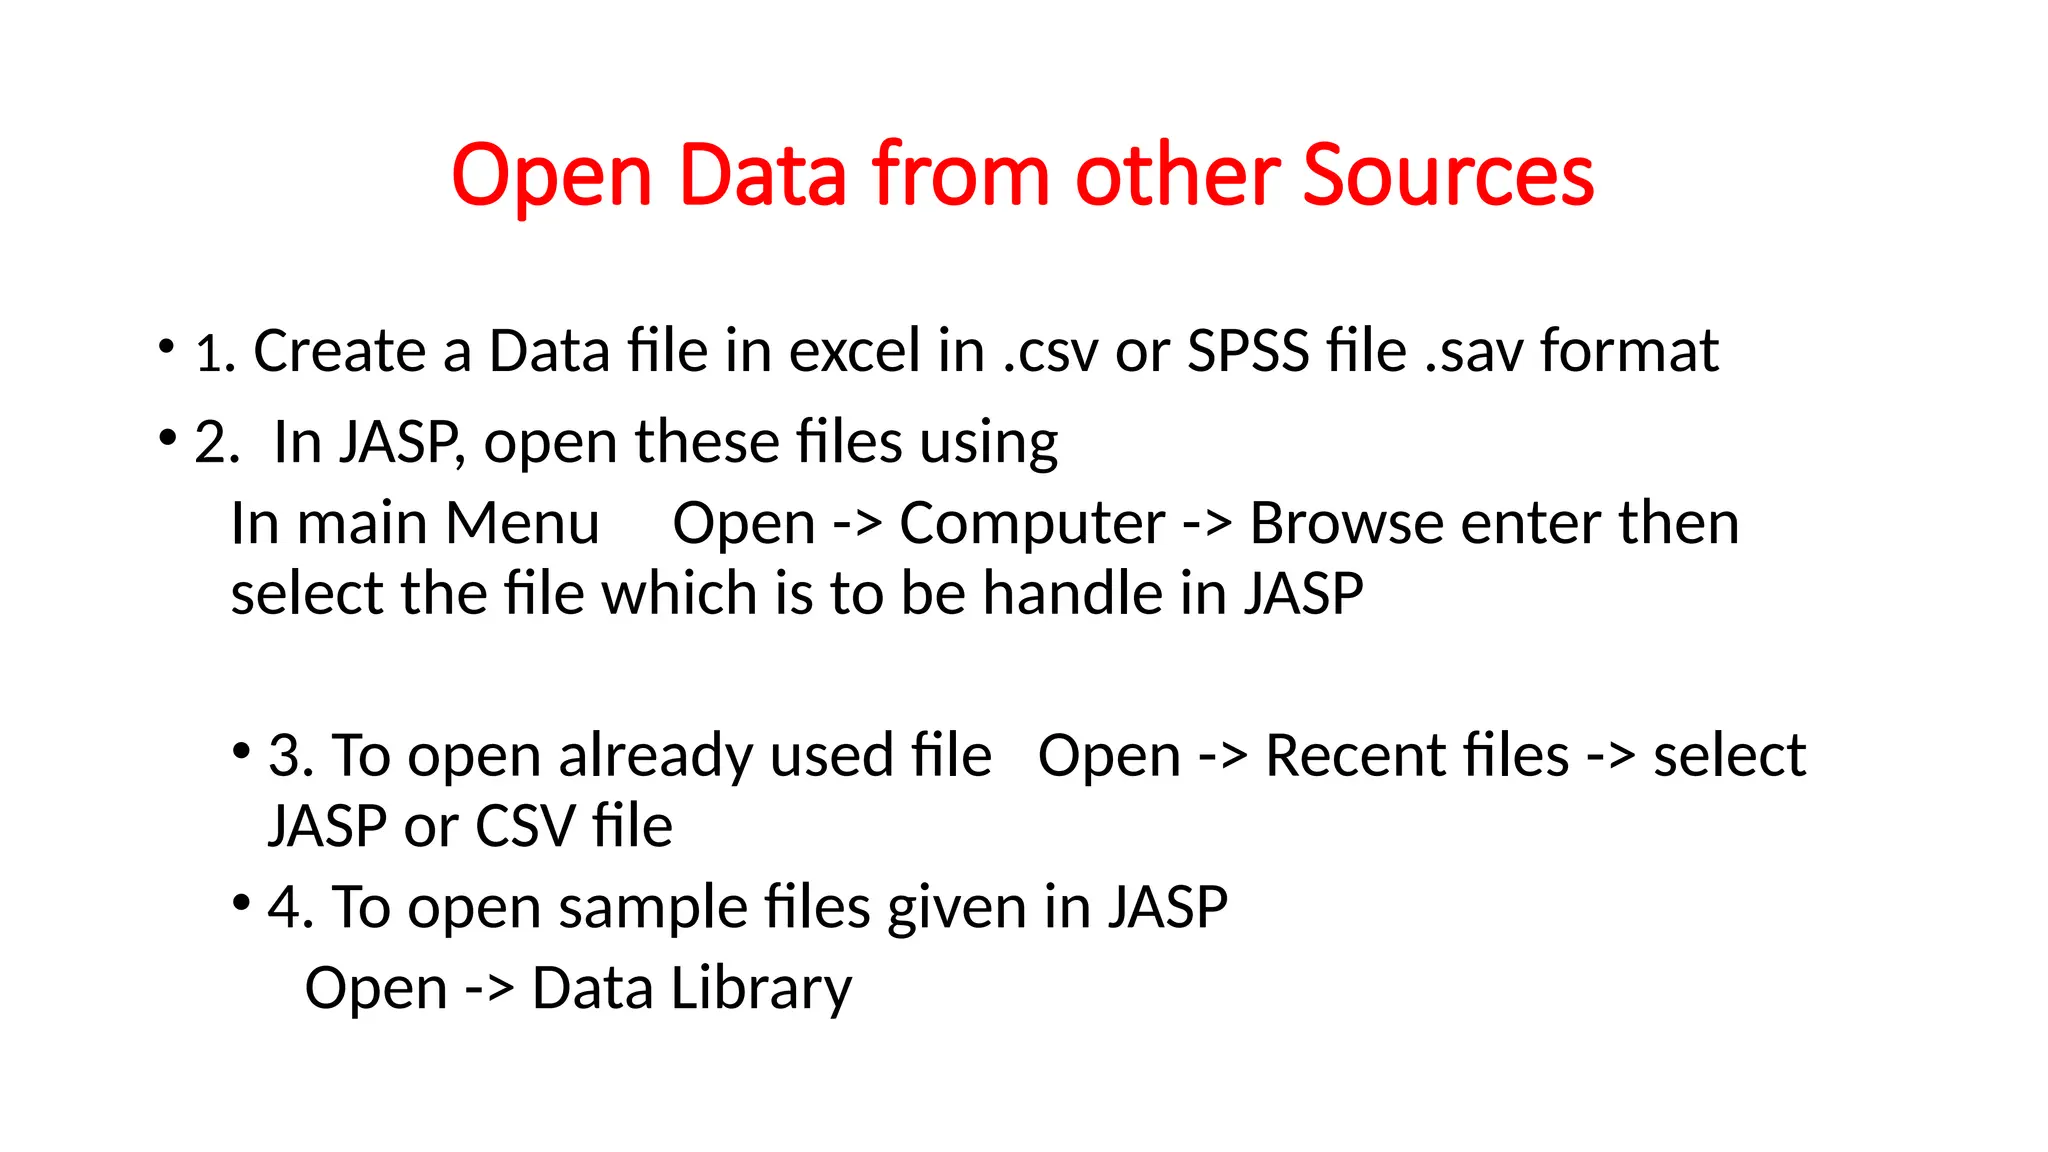
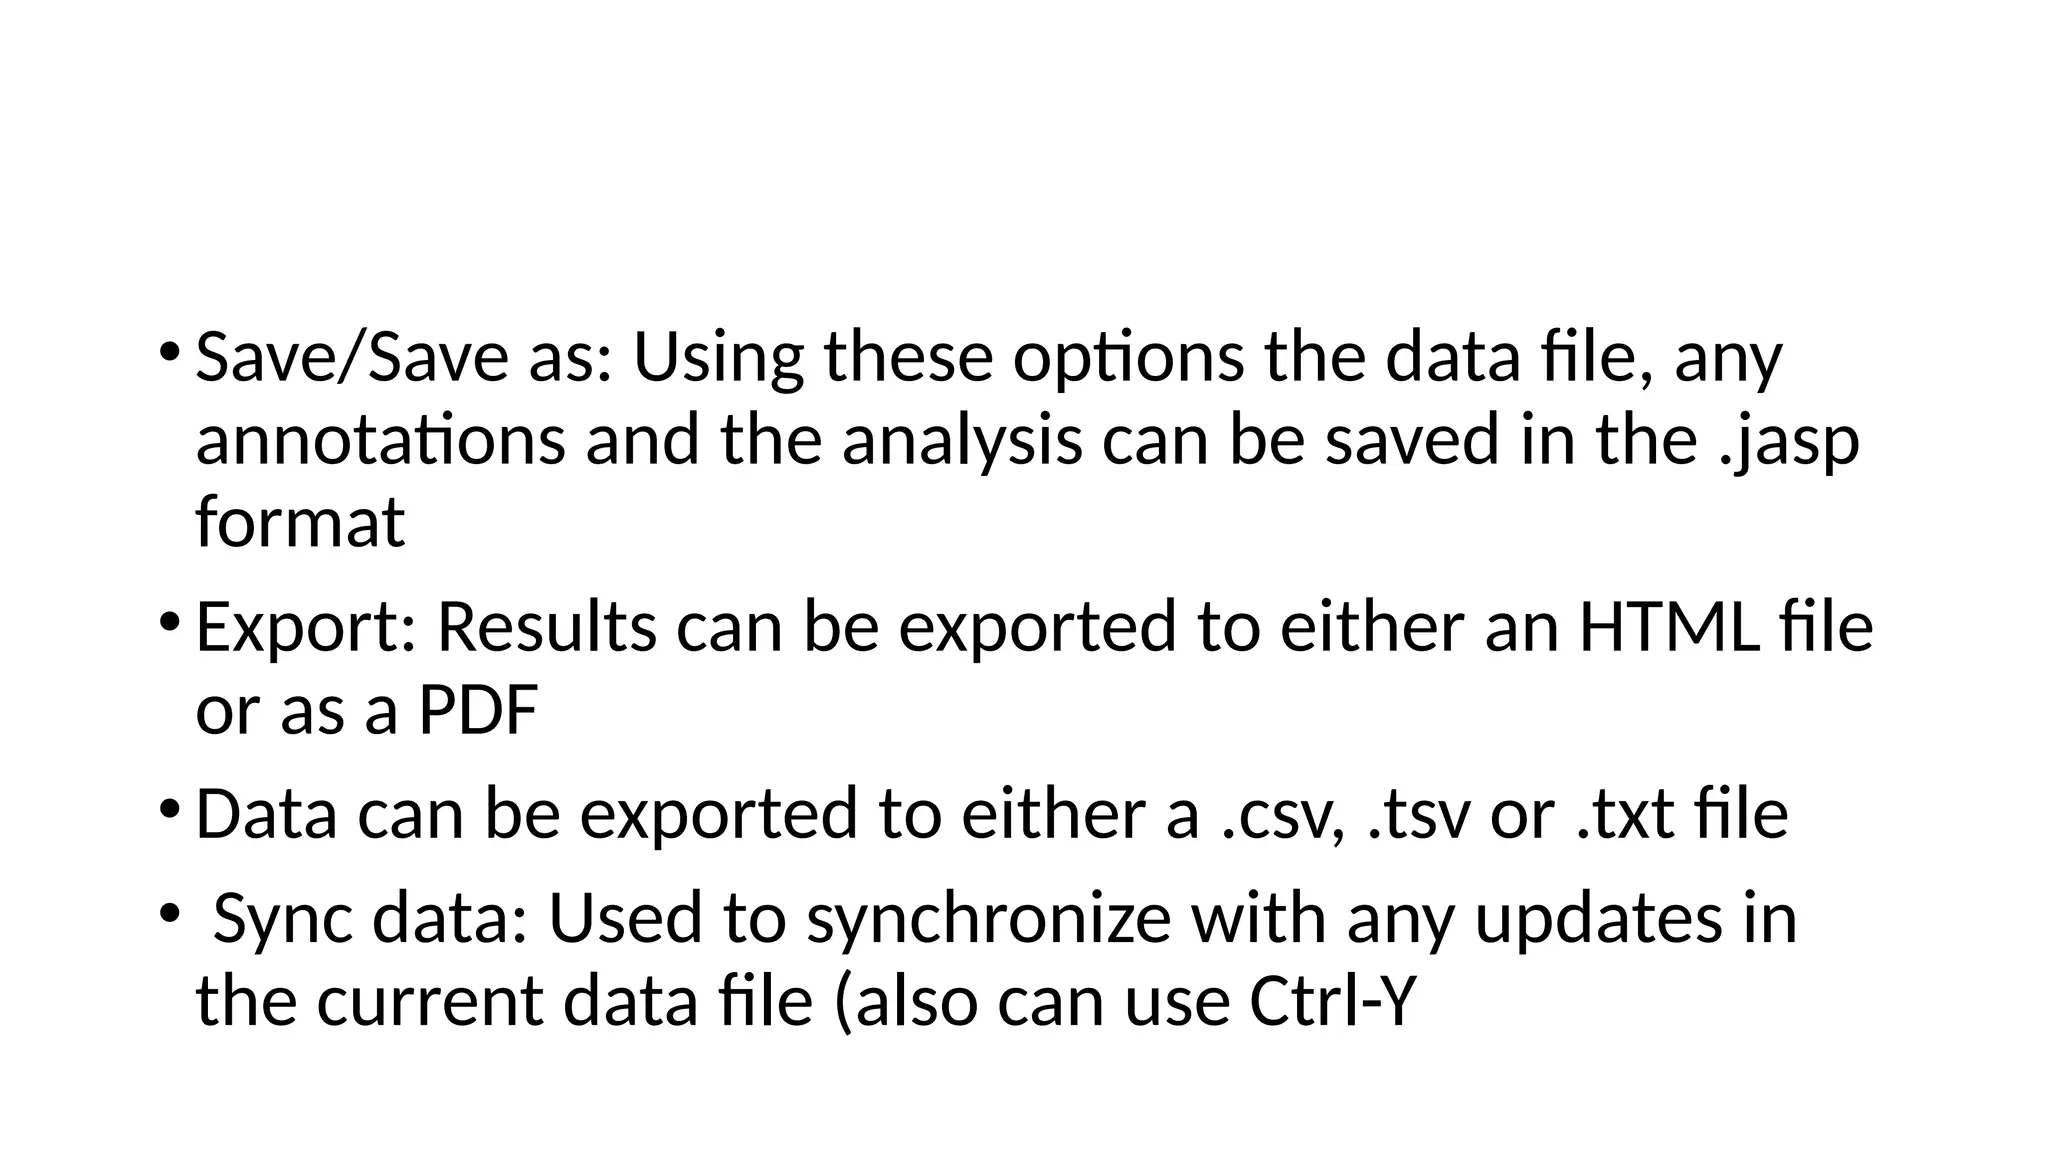
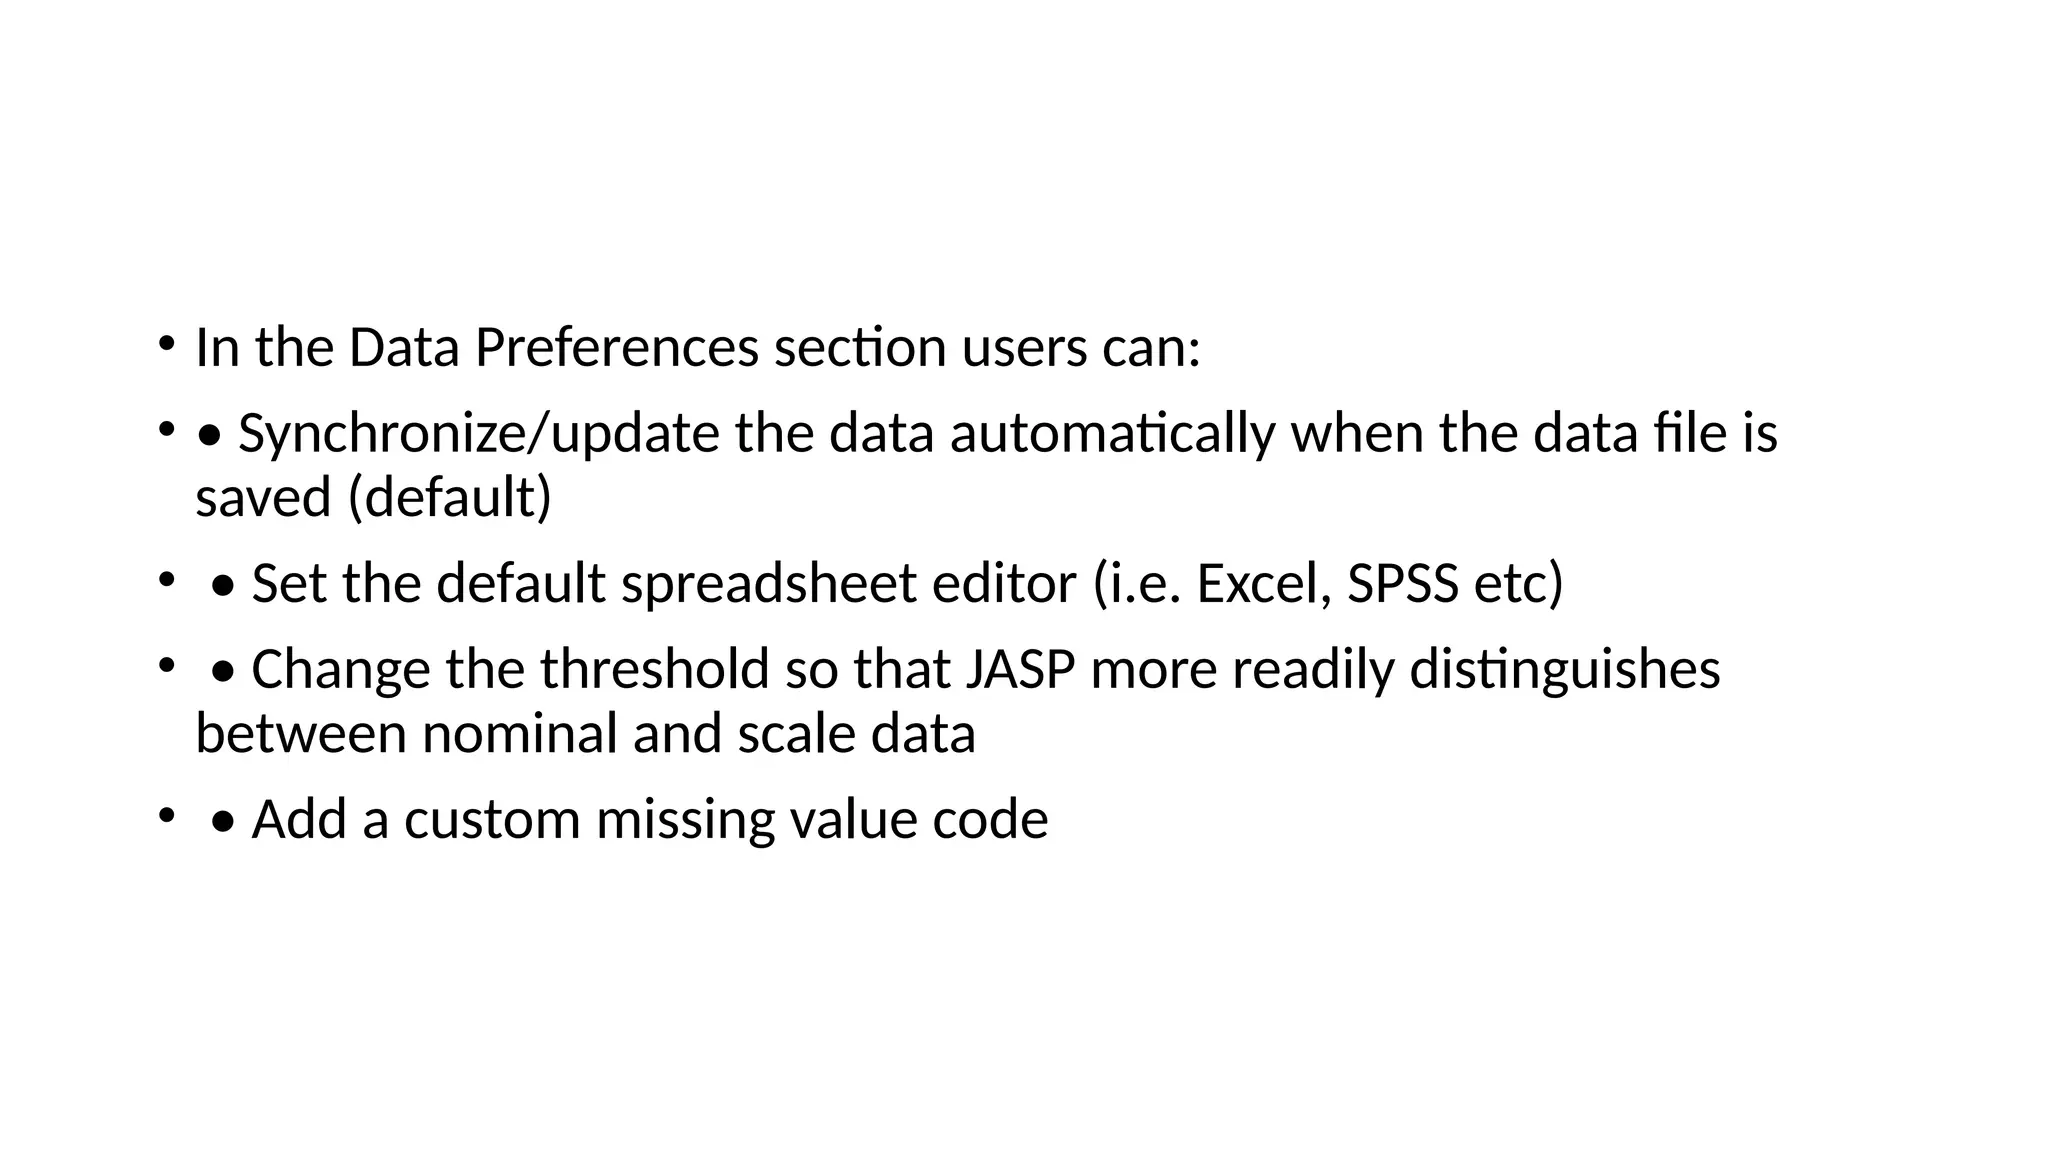
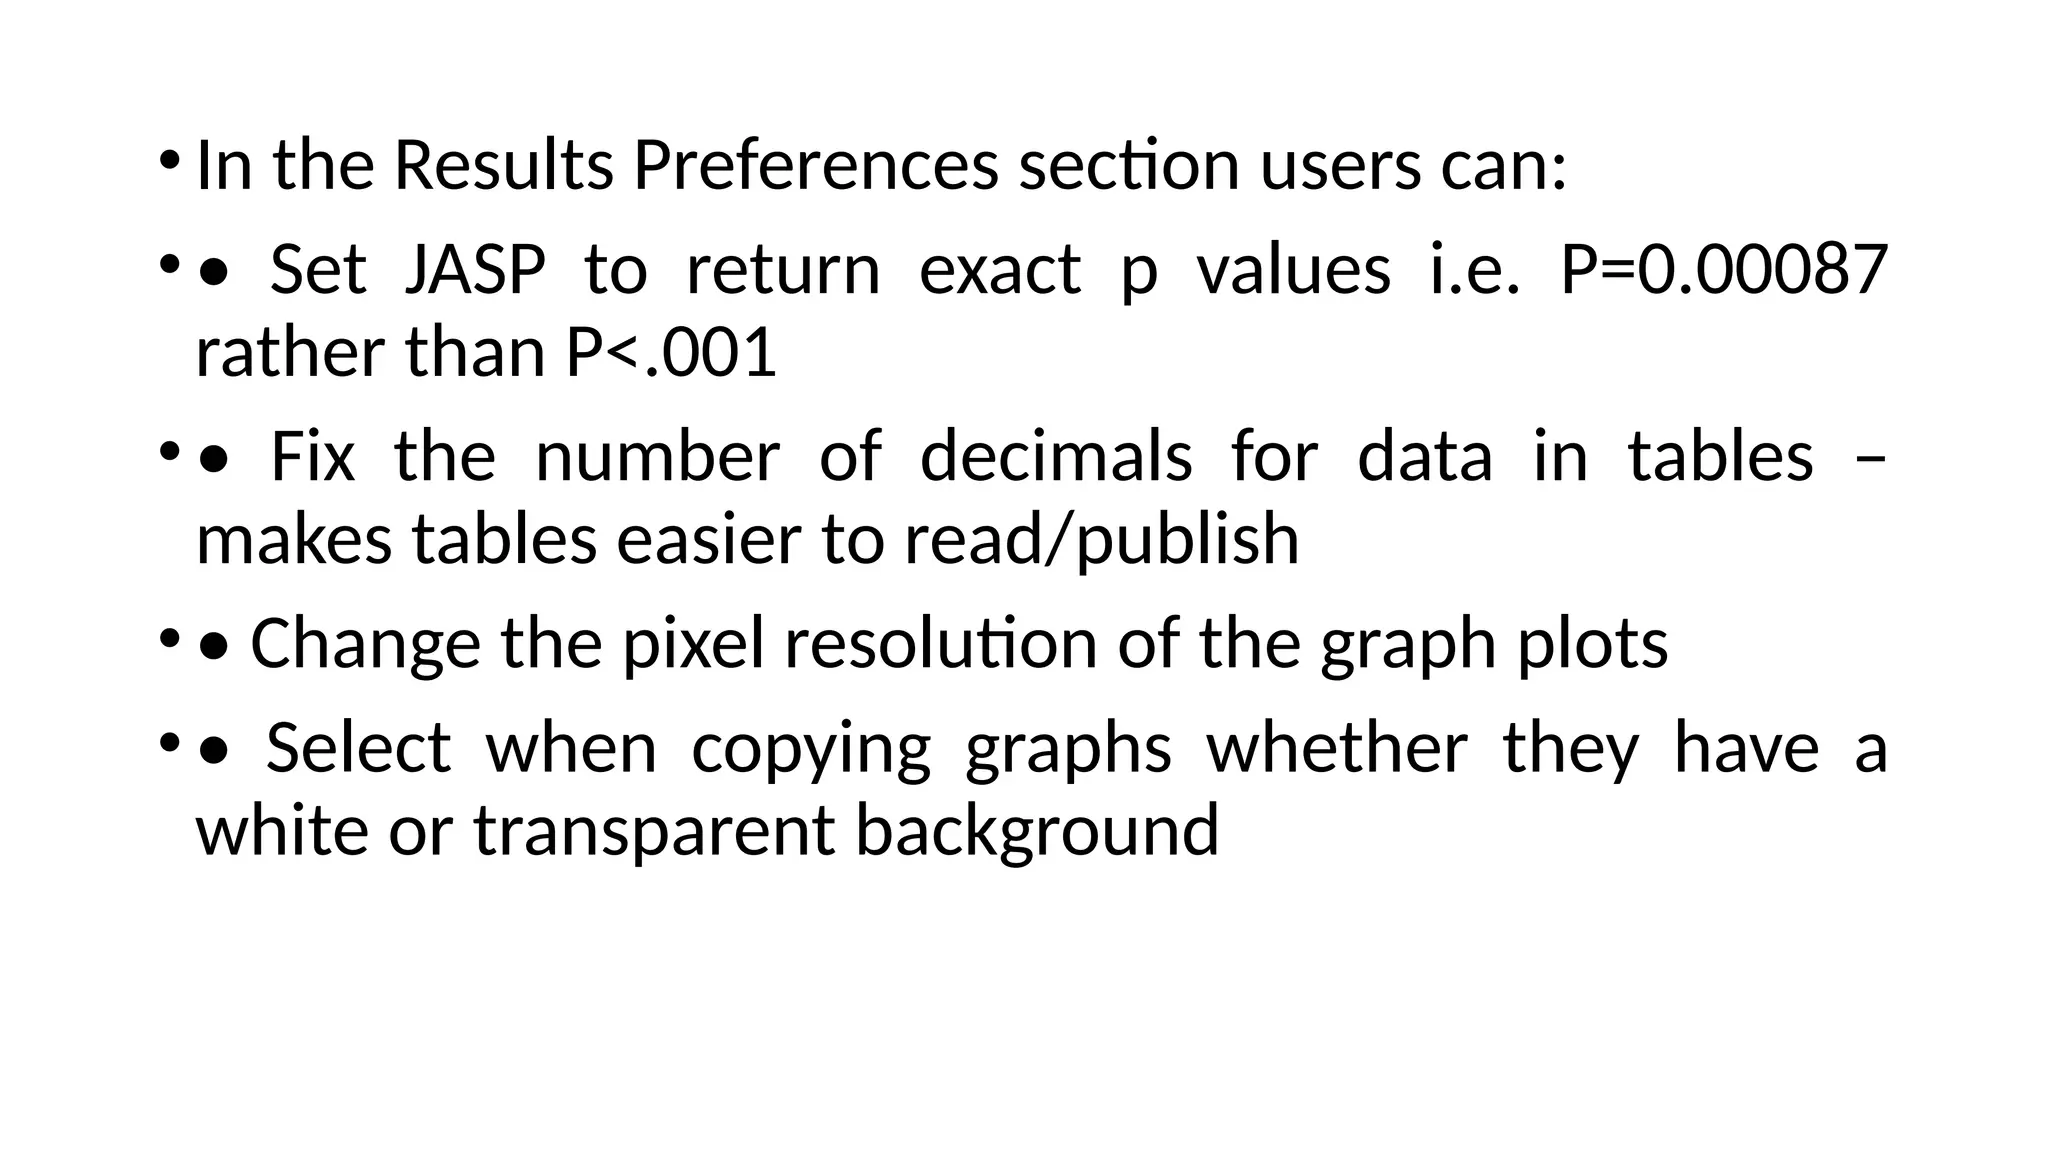
Introduction to JASP
Dr. M. Ramakrishnan
Associate Professor of Mathematics,
Ramakrishna Mission Vivekananda College,
Chennai, TamilNadu.
PH: 9543082432, 9381054104
E-mail: mramkey@mramkey.co.in, mramkey@rkmvc.ac.in
•JASP stands for Jeffrey’s Amazing Statistics Program in
recognition of the pioneer of Bayesian inference Sir
Harold Jeffreys.
•This is a free multi-platform open-source statistics
package, developed and continually updated by a
group of researchers at the University of Amsterdam.
•JASP is a free, open-source program that includes
both standard and more advanced statistical
techniques with a major emphasis on providing a
simple intuitive user interface supported by the
University of Amsterdam, Netherlands.
• It is designed to be easy to use, and familiar to users of SPSS.
It offers standard analysis procedures in both their classical
and Bayesian.
• JASP generally produces APA Style results tables and plots
to ease publication.
• In contrast to many statistical packages, JASP provides a
simple drag and drop interface, easy access menus, intuitive
analysis with real-time computation and display of all results.
• All tables and graphs are presented in APA format and can be
copied directly and/or saved independently.
• Tables can also be exported from JASP in LaTeX format
JASP Installation
• JASP can be downloaded free from the website
• https://jasp-stats.org/ and is available for Windows, Mac OS X and
Linux.
• Pre-installed Windows version that will run directly from a USB or
external hard drive without the need to install it locally.
• The JASP application is written in C++ and QML, using the Qt toolkit.
• The analyses themselves are written in R and use many packages from
CRAN.
For Previous versions
• https://jasp-stats.org/previous-versions/
• Comparison of JASP and SPSS
• https://jasp-stats.org/2017/11/01/jasp-vs-spss/
Open Data from other Sources
• 1. Create a Data file in excel in .csv or SPSS file .sav format
• 2. In JASP, open these files using
In main Menu Open -> Computer -> Browse enter then
select the file which is to be handle in JASP
• 3. To open already used file Open -> Recent files -> select
JASP or CSV file
• 4. To open sample files given in JASP
Open -> Data Library
•Save/Save as: Using these options the data file, any
annotations and the analysis can be saved in the .jasp
format
•Export: Results can be exported to either an HTML file
or as a PDF
•Data can be exported to either a .csv, .tsv or .txt file
• Sync data: Used to synchronize with any updates in
the current data file (also can use Ctrl-Y
• In the Data Preferences section users can:
• • Synchronize/update the data automatically when the data file is
saved (default)
• • Set the default spreadsheet editor (i.e. Excel, SPSS etc)
• • Change the threshold so that JASP more readily distinguishes
between nominal and scale data
• • Add a custom missing value code
•In the Results Preferences section users can:
•• Set JASP to return exact p values i.e. P=0.00087
rather than P<.001
•• Fix the number of decimals for data in tables –
makes tables easier to read/publish
•• Change the pixel resolution of the graph plots
•• Select when copying graphs whether they have a
white or transparent background
• In the Interface Preferences section users can now define a user font
and pick between two different themes; a light theme (default) and a
dark theme. The preferred language currently supports English
• In the Advanced Preferences section, most users will probably never
have to change any of the default settings.
• JASP has a streamlined interface to switch between the spreadsheet,
analysis and results views.
• The vertical bars highlighted above allows for the windows to be
dragged right or left by clicking and dragging the three vertical dots
• The individual windows can also be completely collapsed using the
right or left arrow icons
• The Add notes menu provides many options to change text
font, colour size etc. You can change the size of all the tables
and graphs using ctrl+ (increase) ctrl- (decrease) ctrl= (back
to default size).
• Graphs can also be resized by dragging the bottom right
corner of the graph.
• As previously mentioned, all tables and figures are APA
standard and can just be copied into any other document.
• Since all images can be copied/saved with either a white or
transparent background. This can be selected in Preferences
> Advanced as described earlier.

2. Introduction to JASP.pptx hhgggfcccffg

  • 1.
    Introduction to JASP Dr.M. Ramakrishnan Associate Professor of Mathematics, Ramakrishna Mission Vivekananda College, Chennai, TamilNadu. PH: 9543082432, 9381054104 E-mail: mramkey@mramkey.co.in, mramkey@rkmvc.ac.in
  • 2.
    •JASP stands forJeffrey’s Amazing Statistics Program in recognition of the pioneer of Bayesian inference Sir Harold Jeffreys. •This is a free multi-platform open-source statistics package, developed and continually updated by a group of researchers at the University of Amsterdam. •JASP is a free, open-source program that includes both standard and more advanced statistical techniques with a major emphasis on providing a simple intuitive user interface supported by the University of Amsterdam, Netherlands.
  • 3.
    • It isdesigned to be easy to use, and familiar to users of SPSS. It offers standard analysis procedures in both their classical and Bayesian. • JASP generally produces APA Style results tables and plots to ease publication. • In contrast to many statistical packages, JASP provides a simple drag and drop interface, easy access menus, intuitive analysis with real-time computation and display of all results. • All tables and graphs are presented in APA format and can be copied directly and/or saved independently. • Tables can also be exported from JASP in LaTeX format
  • 4.
    JASP Installation • JASPcan be downloaded free from the website • https://jasp-stats.org/ and is available for Windows, Mac OS X and Linux. • Pre-installed Windows version that will run directly from a USB or external hard drive without the need to install it locally. • The JASP application is written in C++ and QML, using the Qt toolkit. • The analyses themselves are written in R and use many packages from CRAN. For Previous versions • https://jasp-stats.org/previous-versions/ • Comparison of JASP and SPSS • https://jasp-stats.org/2017/11/01/jasp-vs-spss/
  • 5.
    Open Data fromother Sources • 1. Create a Data file in excel in .csv or SPSS file .sav format • 2. In JASP, open these files using In main Menu Open -> Computer -> Browse enter then select the file which is to be handle in JASP • 3. To open already used file Open -> Recent files -> select JASP or CSV file • 4. To open sample files given in JASP Open -> Data Library
  • 6.
    •Save/Save as: Usingthese options the data file, any annotations and the analysis can be saved in the .jasp format •Export: Results can be exported to either an HTML file or as a PDF •Data can be exported to either a .csv, .tsv or .txt file • Sync data: Used to synchronize with any updates in the current data file (also can use Ctrl-Y
  • 7.
    • In theData Preferences section users can: • • Synchronize/update the data automatically when the data file is saved (default) • • Set the default spreadsheet editor (i.e. Excel, SPSS etc) • • Change the threshold so that JASP more readily distinguishes between nominal and scale data • • Add a custom missing value code
  • 8.
    •In the ResultsPreferences section users can: •• Set JASP to return exact p values i.e. P=0.00087 rather than P<.001 •• Fix the number of decimals for data in tables – makes tables easier to read/publish •• Change the pixel resolution of the graph plots •• Select when copying graphs whether they have a white or transparent background
  • 9.
    • In theInterface Preferences section users can now define a user font and pick between two different themes; a light theme (default) and a dark theme. The preferred language currently supports English • In the Advanced Preferences section, most users will probably never have to change any of the default settings. • JASP has a streamlined interface to switch between the spreadsheet, analysis and results views. • The vertical bars highlighted above allows for the windows to be dragged right or left by clicking and dragging the three vertical dots • The individual windows can also be completely collapsed using the right or left arrow icons
  • 11.
    • The Addnotes menu provides many options to change text font, colour size etc. You can change the size of all the tables and graphs using ctrl+ (increase) ctrl- (decrease) ctrl= (back to default size). • Graphs can also be resized by dragging the bottom right corner of the graph. • As previously mentioned, all tables and figures are APA standard and can just be copied into any other document. • Since all images can be copied/saved with either a white or transparent background. This can be selected in Preferences > Advanced as described earlier.