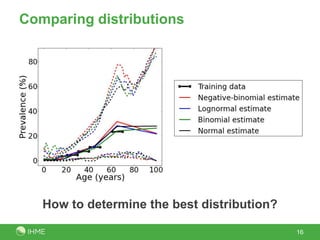
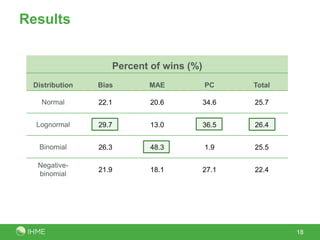
Meta-regression with DisMod-MR:
how robust is the model?
June 18, 2013
Hannah M Peterson
Post-Bachelor Fellow
Global Burden of Disease Study 2010
2
YLDs
• Measures morbidity
• Requires age-specific prevalence
o For 291 outcomes
o For 2 sexes
o For 187 countries
o For 3 years
3
Is negative-binomial distribution
the best choice?
DisMod-MR
4
Alternative distributions
5
Distribution Probability Density Function
Normal
Lognormal
Binomial
Negative-
binomial
Alternative distributions
6
Distribution Probability Density Function
Normal
Lognormal
Binomial
Negative-
binomial
Alternative distributions
7
Distribution Probability Density Function
Normal
Lognormal
Binomial
Negative-
binomial
Alternative distributions
8
Distribution Probability Density Function
Normal
Lognormal
Binomial
Negative-
binomial
Potential experimental frameworks
• Data collection
o Ideal
o Impractical
• Simulation
o Impossible to know true data distribution
• Out-of-sample cross validation
o Do not have to choose distribution
9
Out-of-sample cross validation
10
Out-of-sample predictive validity
• Randomly select 25% of
data to use as “test data”
11
Out-of-sample predictive validity
• Randomly select 25% of
data to use as “test data”
12
Out-of-sample predictive validity
• Randomly select 25% of
data to use as “test data”
• Fit the remaining 75% of
data (“training data”)
13
Out-of-sample predictive validity
• Randomly select 25% of
data to use as “test data”
• Fit the remaining 75% of
data (“training data”)
• Use fit to calculate statistics
for test data
14
Out-of-sample predictive validity
• Randomly select 25% of
data to use as “test data”
• Fit the remaining 75% of
data (“training data”)
• Use fit to calculate statistics
for test data
• For each distribution
• For 1000 test-train splits
• For each disease data set
15
Comparing distributions
16
How to determine the best distribution?
Metrics of evaluation
•
17
Results
18
Percent of wins (%)
Distribution Bias MAE PC Total
Normal 22.1 20.6 34.6 25.7
Lognormal 29.7 13.0 36.5 26.4
Binomial 26.3 48.3 1.9 25.5
Negative-
binomial
21.9 18.1 27.1 22.4
Conclusions
• Choice of distribution doesn’t greatly influence results
• Best overall performance: lognormal distribution
o Contingent on method to adjust data whose value is 0
• Further investigate when each distribution performs best
o Dependent on number of covariates, priors, amount of data?
19
Thank you
Hannah Peterson
peterhm@uw.edu
www.healthmetricsandevaluation.org

Meta-regression with DisMod-MR: how robust is the model?

Editor's Notes

  • #3 Global Burden of Disease Study 2010 (GBD)-huge endeavor to measure health loss from disease, injuries, and risk using the Disability Adjusted Life Year (DALY)-coarsely described in the this 18-step process-I am just going to focus on a small subsection, the calculation of DALYs for injuries and disease-further narrow focus to the calculation of YLDsfigure:Murray, Ezzati, et. al. 2013. “GBD 2010: design, definitions, and metrics”. The Lancet. 380(9859):2063-2066.
  • #4 -YLDsmeasure morbidity, or years lived in less than full health-the YLD calculation needs age-specific prevalence estimates, for GBD, this means ---for 291 outcomes ---for 2 sexes---for 187 countries---for 3 years-however prevalence data is often less than ideal, -examples all available data in Western Europe for GDB2010 Study---sparse (fungal diseases) ---noisy (lower back pain) ---sparse and noisy (cannabis dependence data)-to calculate age-specific prevalence, used a tool called DisMod-MR
  • #5 -DisMod-MR is designed to address missing data and inconsistency ---used epidemiologic data and covariate data to calculate the age-specific prevalence based on a negative-binomial distribution---assumes all epidemiological data follows a negative-binomial distribution-is it really the best distribution to model the epidemiologic data?figure: Vos, Flaxman, et. al. 2013. “Years lived with disability (YLDs) for 1160 sequelae of 289 diseases and injuries 1990-2010: a systematic analysis for the Global Burden of Disease Study 2010”. The Lancet. 380(9859):2163-2196.
  • #6 Normal𝜇=𝑚𝑒𝑎𝑛𝜎=𝑠𝑡𝑎𝑛𝑑𝑎𝑟𝑑 𝑑𝑒𝑣𝑖𝑎𝑡𝑖𝑜𝑛-mathematically convenient-PROBLEM: allows negative estimates of prevalence, physiological impossibleNegative-binomial𝑁=𝑖𝑛𝑑𝑖𝑣𝑖𝑑𝑢𝑎𝑙𝑠 𝑡𝑒𝑠𝑡𝑒𝑑𝑥=𝑡𝑒𝑠𝑡𝑒𝑑 𝑝𝑜𝑠𝑖𝑡𝑖𝑣𝑒𝑝=𝑝𝑟𝑜𝑏𝑎𝑏𝑖𝑙𝑡𝑦discrete modeltransformation yields an overdispersion parameter which allows the standard deviation to vary
  • #7 Lognormal𝜇=𝑚𝑒𝑎𝑛𝜎=𝑠𝑡𝑎𝑛𝑑𝑎𝑟𝑑 𝑑𝑒𝑣𝑖𝑎𝑡𝑖𝑜𝑛-bounds estimates at 0-PROBLEM: doesn’t allow prevalence to be 0---can’t take the log of 0-changed values of 0 to be 1 observation-other options would be to use an offset lognormal distribution-but somehow, have to work around estimates of 0Negative-binomial𝑁=𝑖𝑛𝑑𝑖𝑣𝑖𝑑𝑢𝑎𝑙𝑠 𝑡𝑒𝑠𝑡𝑒𝑑𝑥=𝑡𝑒𝑠𝑡𝑒𝑑 𝑝𝑜𝑠𝑖𝑡𝑖𝑣𝑒𝑝=𝑝𝑟𝑜𝑏𝑎𝑏𝑖𝑙𝑡𝑦discrete modeltransformation yields an overdispersion parameter which allows the standard deviation to vary
  • #8 Binomial-which Dr. Flaxman already discussed-discrete model𝑁=𝑖𝑛𝑑𝑖𝑣𝑖𝑑𝑢𝑎𝑙𝑠 𝑡𝑒𝑠𝑡𝑒𝑑𝑥=𝑡𝑒𝑠𝑡𝑒𝑑 𝑝𝑜𝑠𝑖𝑡𝑖𝑣𝑒𝑝=𝑝𝑟𝑜𝑏𝑎𝑏𝑖𝑙𝑡𝑦Negative-binomial𝑁=𝑖𝑛𝑑𝑖𝑣𝑖𝑑𝑢𝑎𝑙𝑠 𝑡𝑒𝑠𝑡𝑒𝑑𝑥=𝑡𝑒𝑠𝑡𝑒𝑑 𝑝𝑜𝑠𝑖𝑡𝑖𝑣𝑒𝑝=𝑝𝑟𝑜𝑏𝑎𝑏𝑖𝑙𝑡𝑦discrete modeltransformation yields an overdispersion parameter which allows the standard deviation to vary
  • #9 Negative-binomial𝑁=𝑖𝑛𝑑𝑖𝑣𝑖𝑑𝑢𝑎𝑙𝑠 𝑡𝑒𝑠𝑡𝑒𝑑𝑥=𝑡𝑒𝑠𝑡𝑒𝑑 𝑝𝑜𝑠𝑖𝑡𝑖𝑣𝑒𝑝=𝑝𝑟𝑜𝑏𝑎𝑏𝑖𝑙𝑡𝑦discrete modeltransformation yields an overdispersion parameter which allows the standard deviation to varyNegative-binomial𝑁=𝑖𝑛𝑑𝑖𝑣𝑖𝑑𝑢𝑎𝑙𝑠 𝑡𝑒𝑠𝑡𝑒𝑑𝑥=𝑡𝑒𝑠𝑡𝑒𝑑 𝑝𝑜𝑠𝑖𝑡𝑖𝑣𝑒𝑝=𝑝𝑟𝑜𝑏𝑎𝑏𝑖𝑙𝑡𝑦discrete modeltransformation yields an overdispersion parameter which allows the standard deviation to vary
  • #10 Several ways to test which distribution is the best-ideal-data collection---actually go to country (region??) and measure age-specific prevalence---expensiveimpractical-simulation---great for testing, not for validation---problem: have to choose from what distribution the simulated data/measurements come------this is what we’re testing------simulation can showwhatever you want------impossible to know from what distribution measurement-out-of-sample cross validation---way to evaluate and compare distributions---shows how model performs in real life------can test out-of-sample predictive validity------don’t have to choose data distribution---concerns------unstable with sparse data-----------not just the epidemiologic data-----------also covariates and priors
  • #11 This experiment-57 different disease data sets---met inclusion criteria of more than 4 prevalence points in western europe---not a birth-condition meaning prevalence data is only at age 0-restricted to Western EuropeTo explain out-of-sample cross validation usedan example from GBD2010fungal diseases
  • #12 Randomly select 25% of data to withhold as test datatest data used to evaluate results
  • #13 Test data is withheld from DisMod-MR
  • #14 And the remaining data is fit
  • #15 From the fit, these estimates are compared to the test dataThis comparison of the estimate to the test data is where the statistics are calculatedthe same test-train split fits are created for each of the distribution so we can make a comparison
  • #16 -process repeated 1000 times with different test-train splits-repeated for 57 different disease data set---met inclusion criteria of more than 4 prevalence points in western europe---not a birth-condition meaning prevalence data is only at age 057 disease/injury conditions met this criteria
  • #18 metrics that capture different aspects of model performanceWant a model that is precise, accurate, well-calibrated -precise (bias)---measures average difference between the test data and prediction-accurate (median absolute error-MAE)---measure of overall error---many small errors create one large number---sensitive to mean and scale---less sensitive to outliers-calibrated (percent coverage-PC)---calibrated, meaning that our estimates are in the correct range of values------if we aim for 95% uncertainty, we expect 95% of our estimates to be good------more than that and the model is over confident------less than that and the model isn’t very good---percent of time the uncertainty interval of the prediction contains the observation---sensitive to discrete distributionsto determine which distribution performed the best, counted the the winner for each disease data set and split
  • #19 -for different metrics different distributions are superior---makes sense, since each distribution has it’s strengths and weaknesses---smallest bias: lognormal---minimum MAE: binomial---closest percent coverage: lognormal-concern about most frequent results and not raw numbers:---differences are small ------bias, ten-thousandths (E-4), average bias is negative binomial------mae, hundreds-overall winner: lognormal
  • #20 -previously saw, distribution choice doesn’t greatly influence DisMod-MR’s estimates of age-specific prev-results differ by metric-Best overall performance: lognormal distribution---STRESS:Contingent on method to adjust data whose value is 0-Further investigate when each distribution performs best---Dependent on number of covariates, priors, amount of data?DisMod-MR is robust in that choice of distribution for epidemiological values does not greatly influence estimates, but one distribution performs the best most frequently