Download as PDF, PPTX
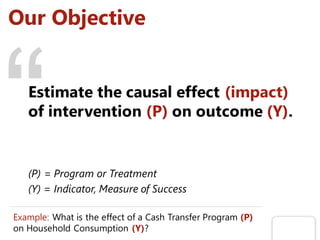
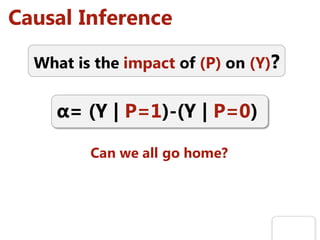


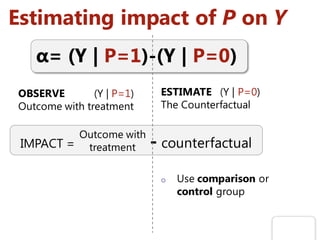

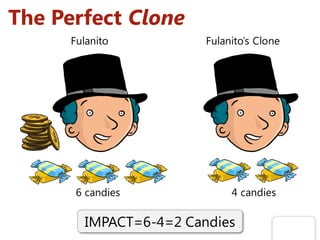
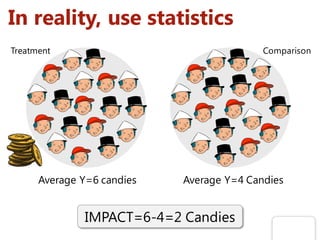


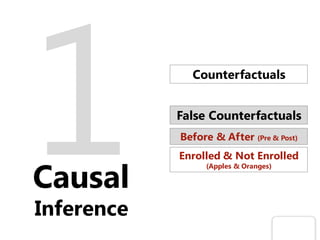


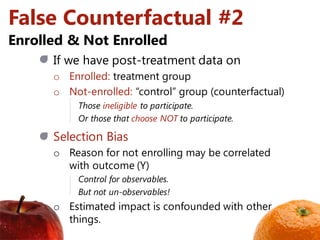

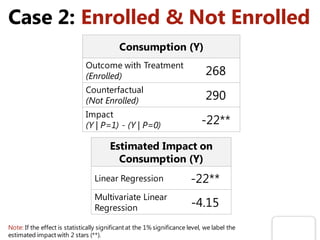

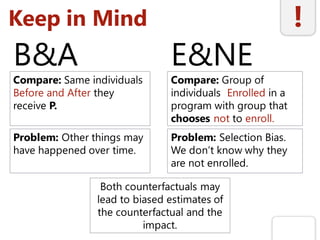


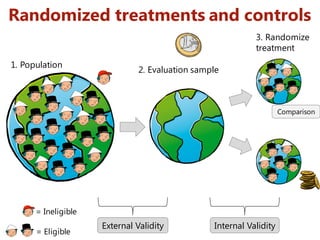


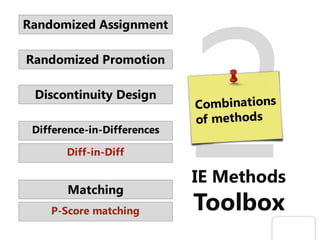


The document discusses methods for impact evaluation, focusing on estimating the causal effect of interventions on outcomes. It highlights the importance of counterfactuals and valid comparison groups to avoid biases in estimates, referencing the case study of the Progresa anti-poverty program in Mexico. The presentation concludes with recommendations for conducting rigorous evaluations and a toolbox of methods for assessing program impacts.


