Download as PDF, PPTX


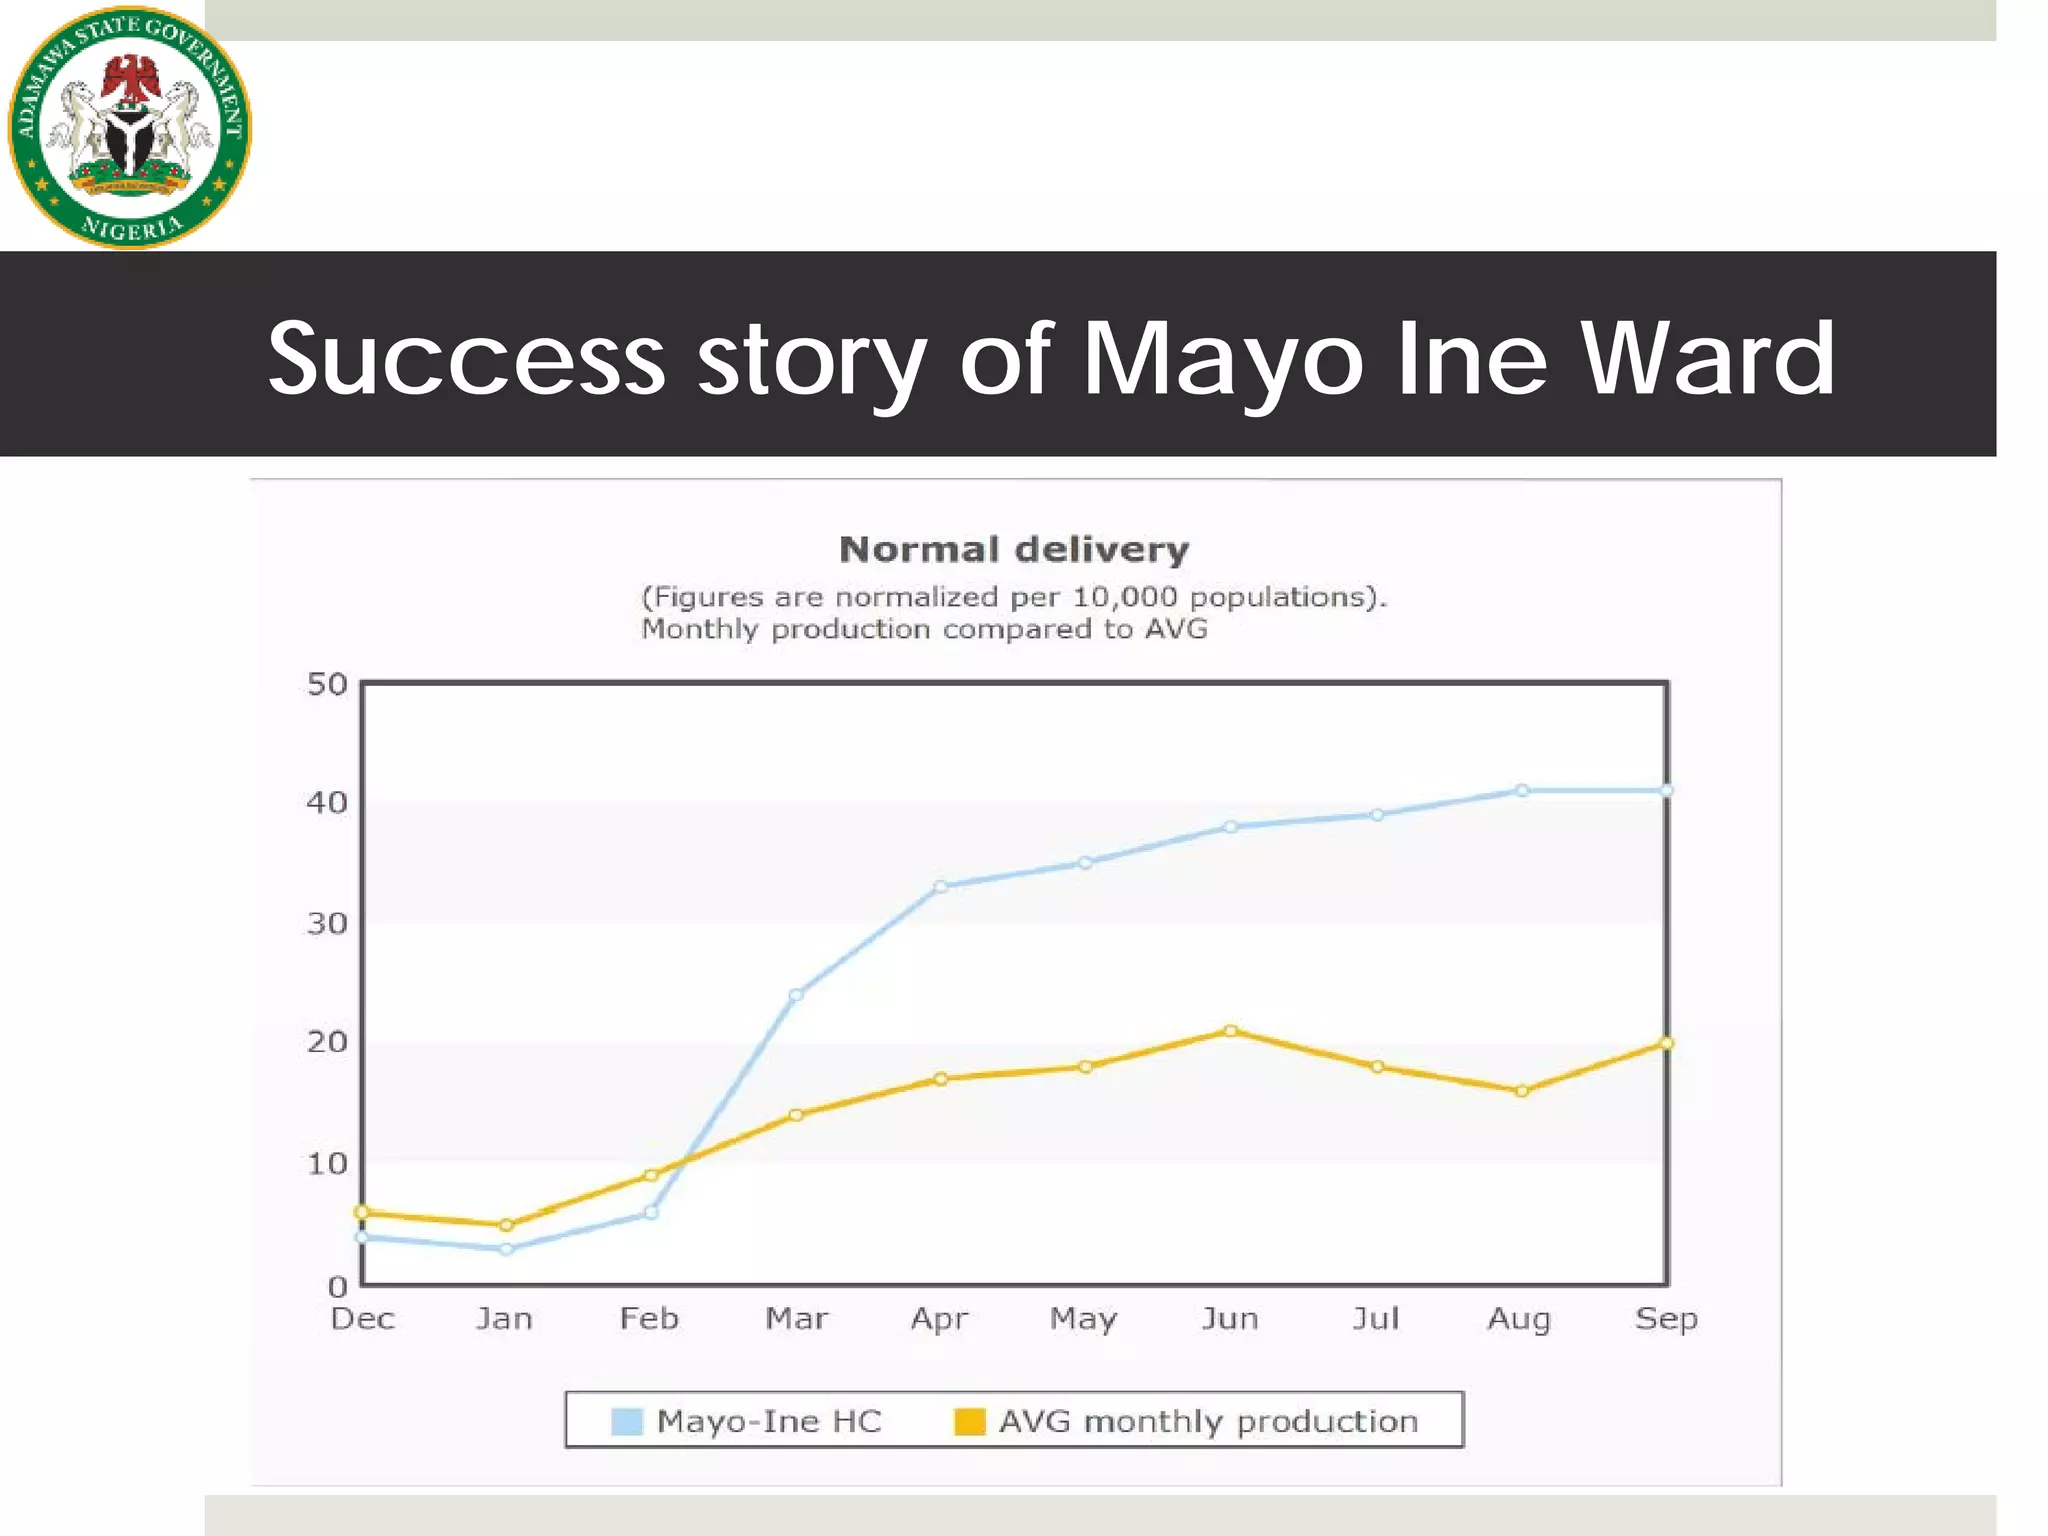
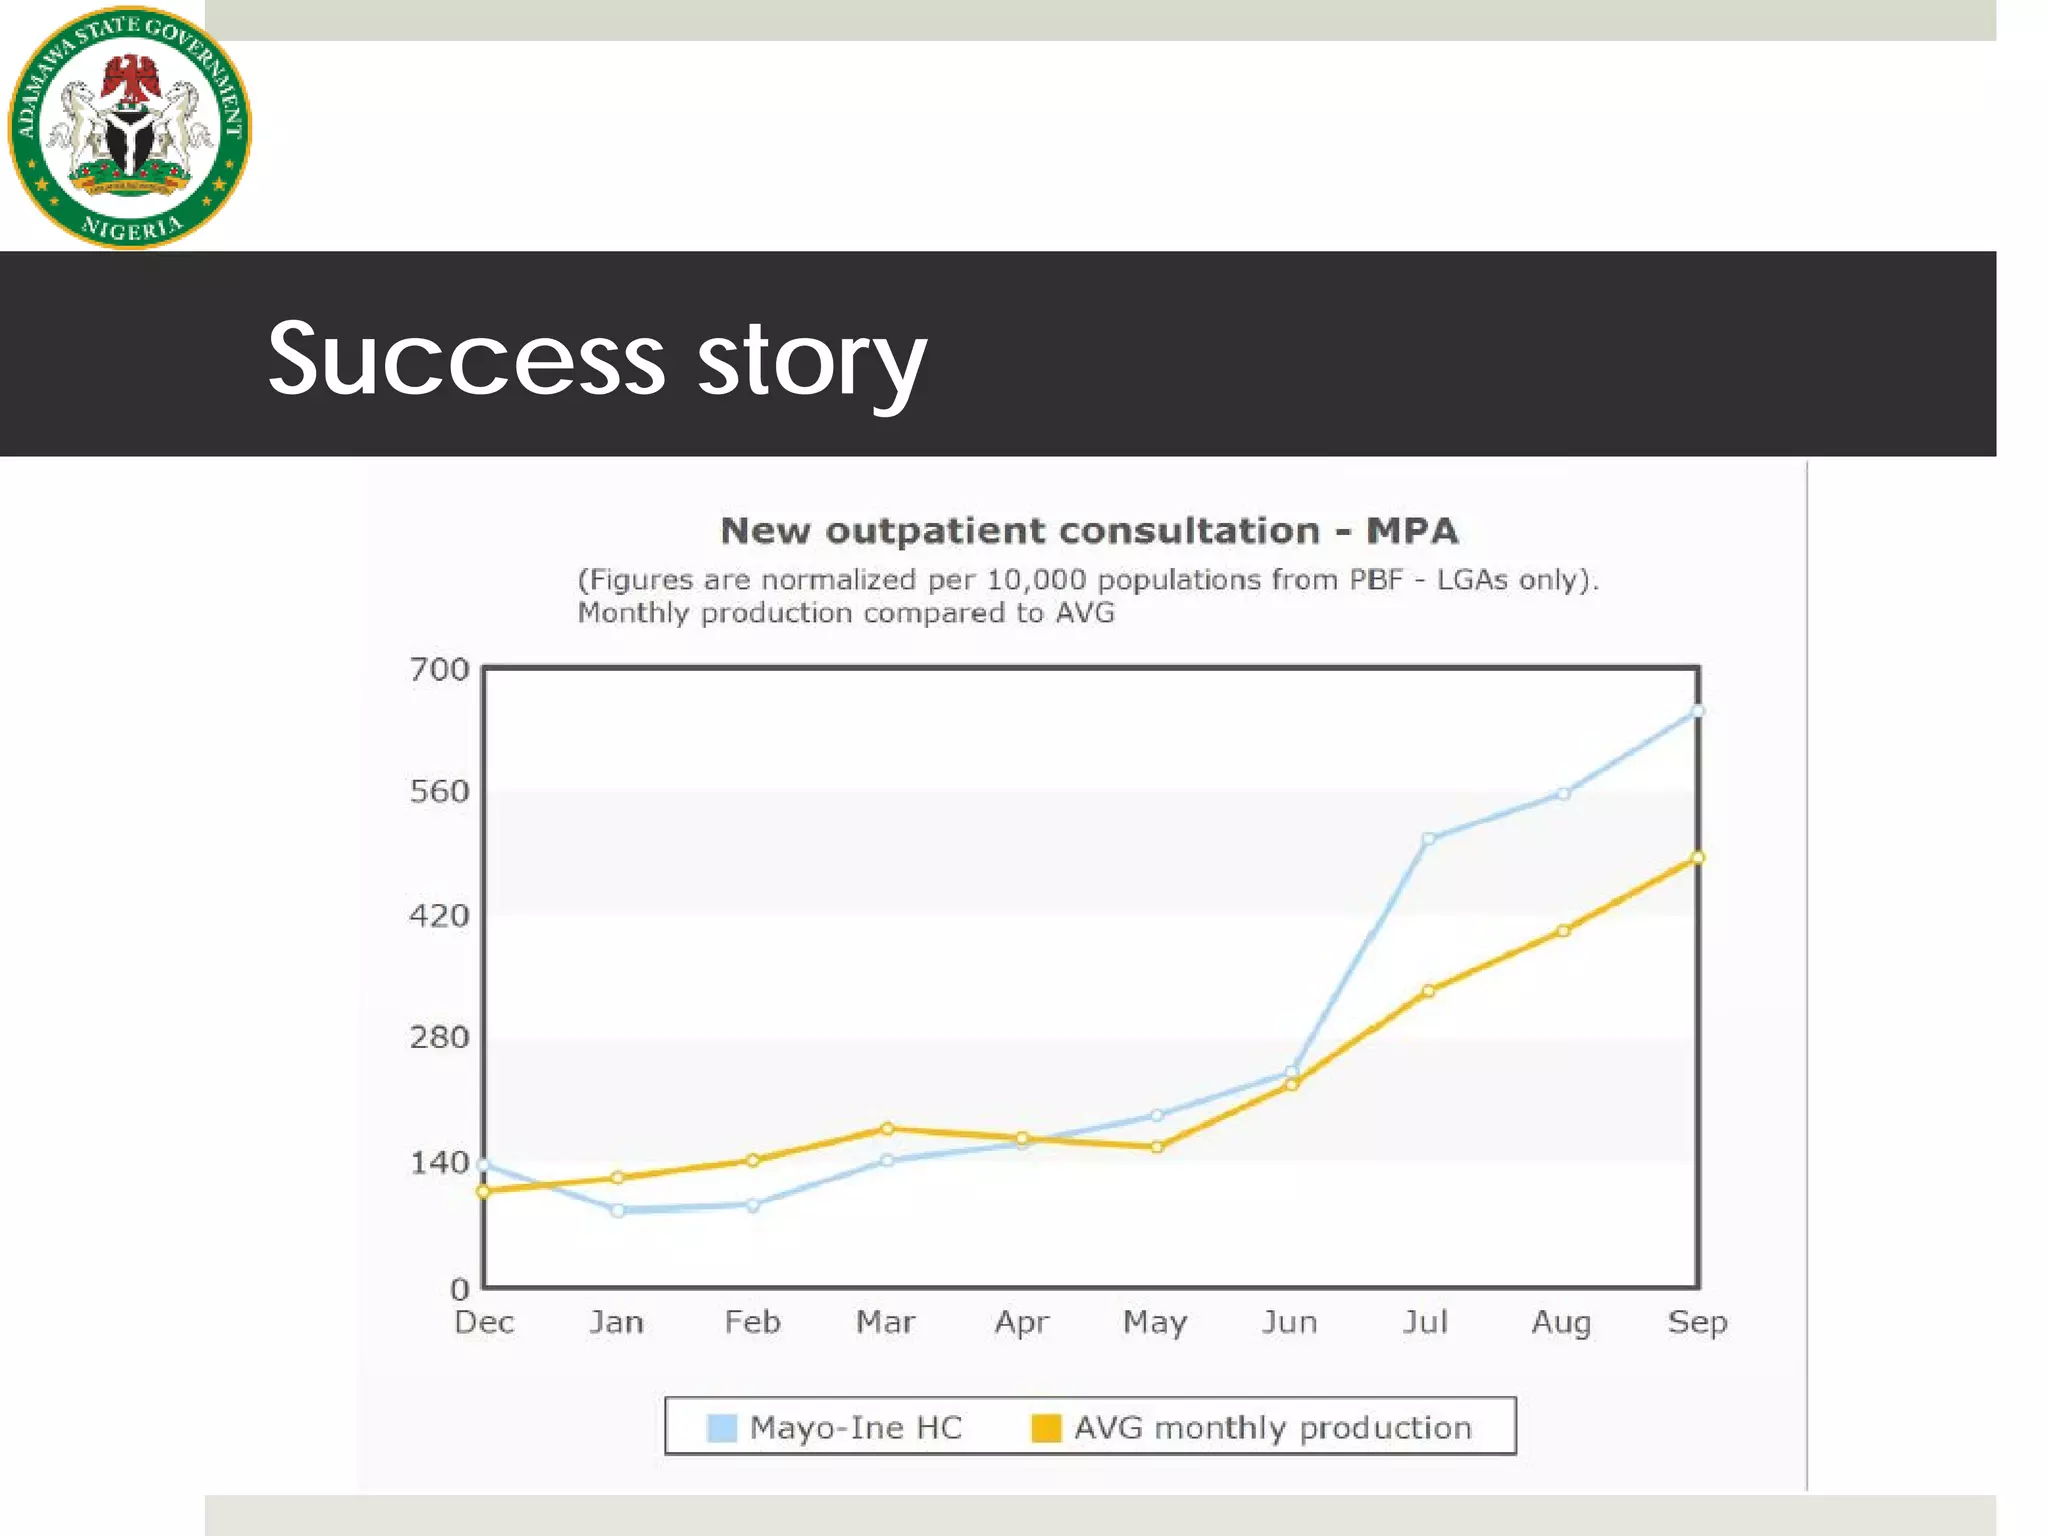
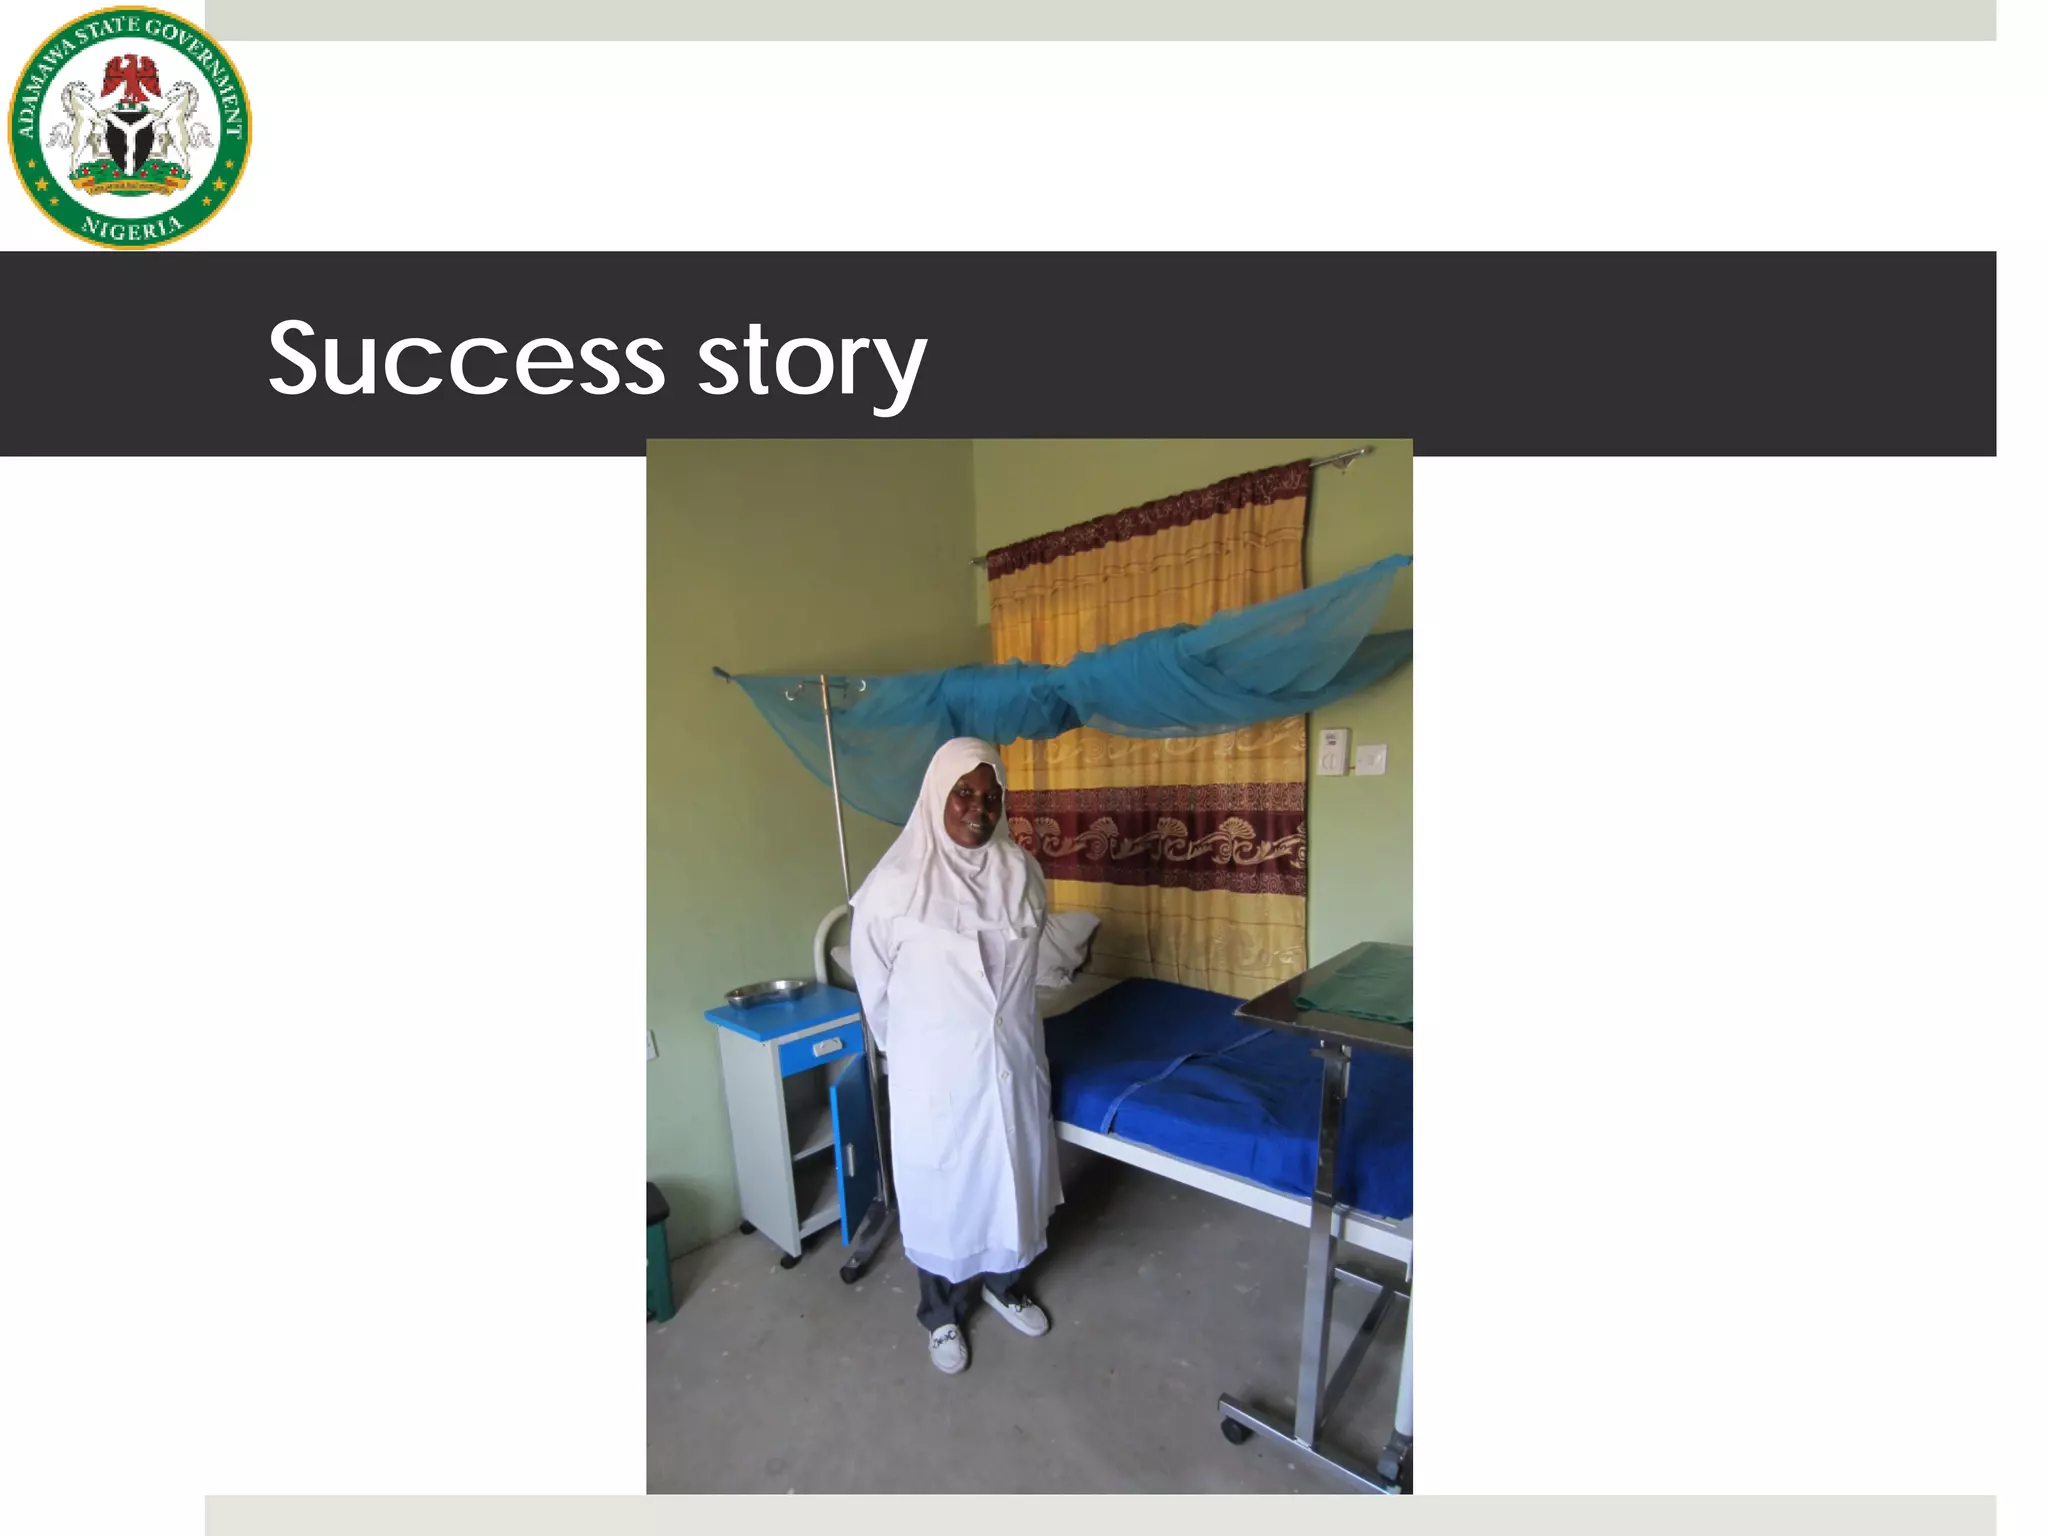
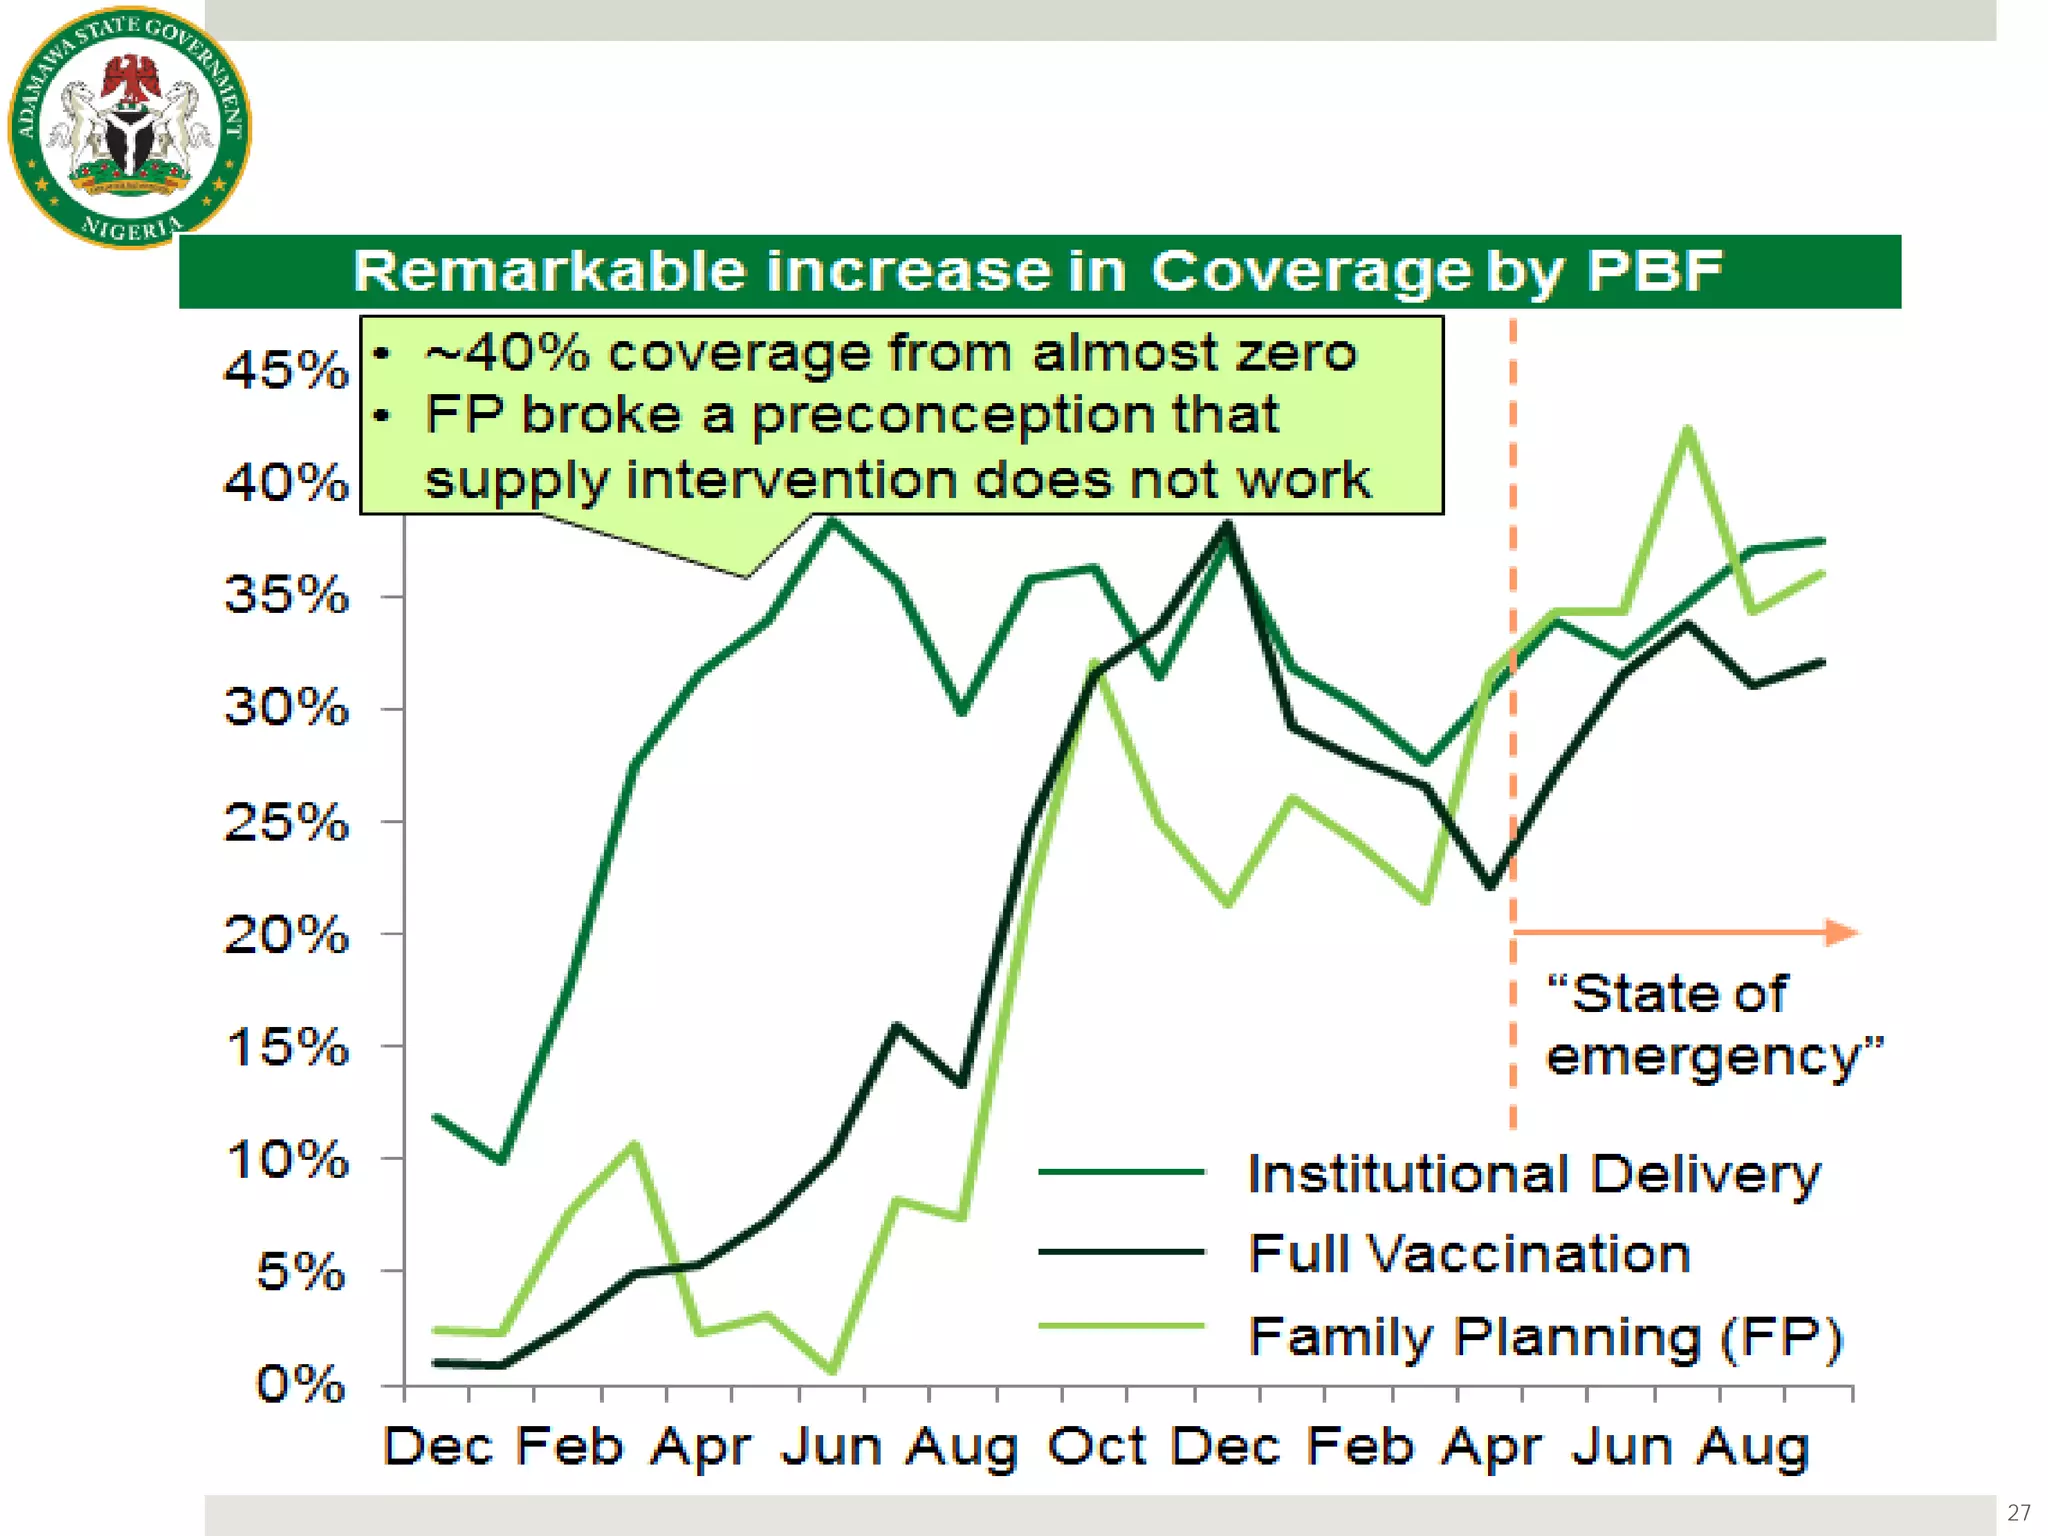
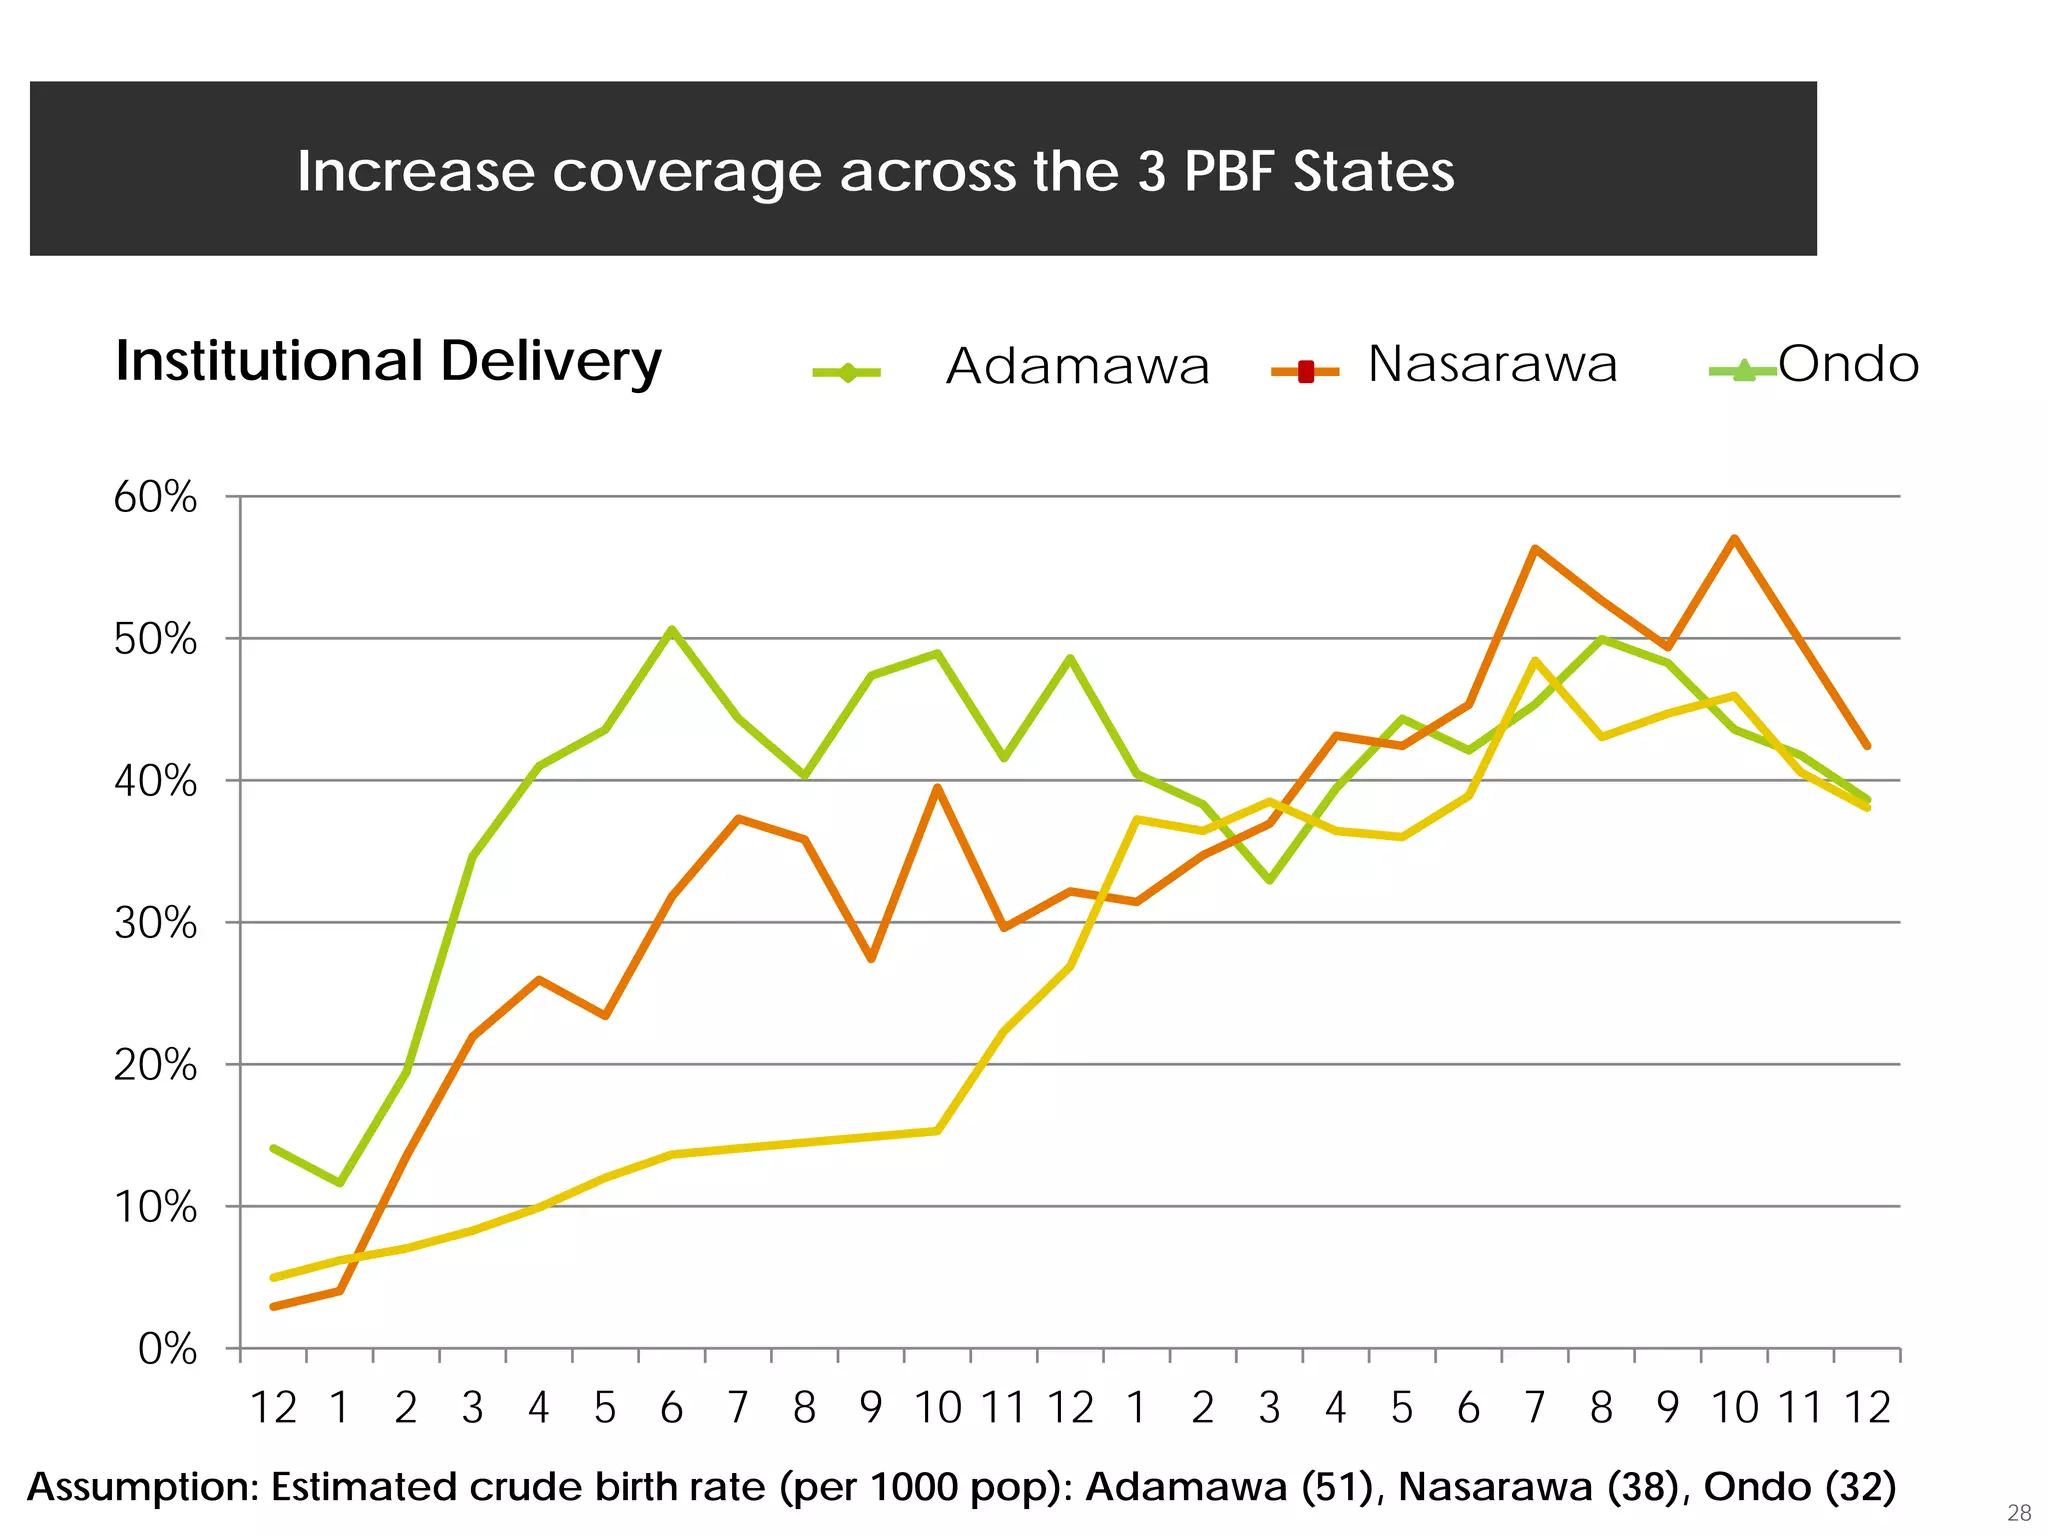
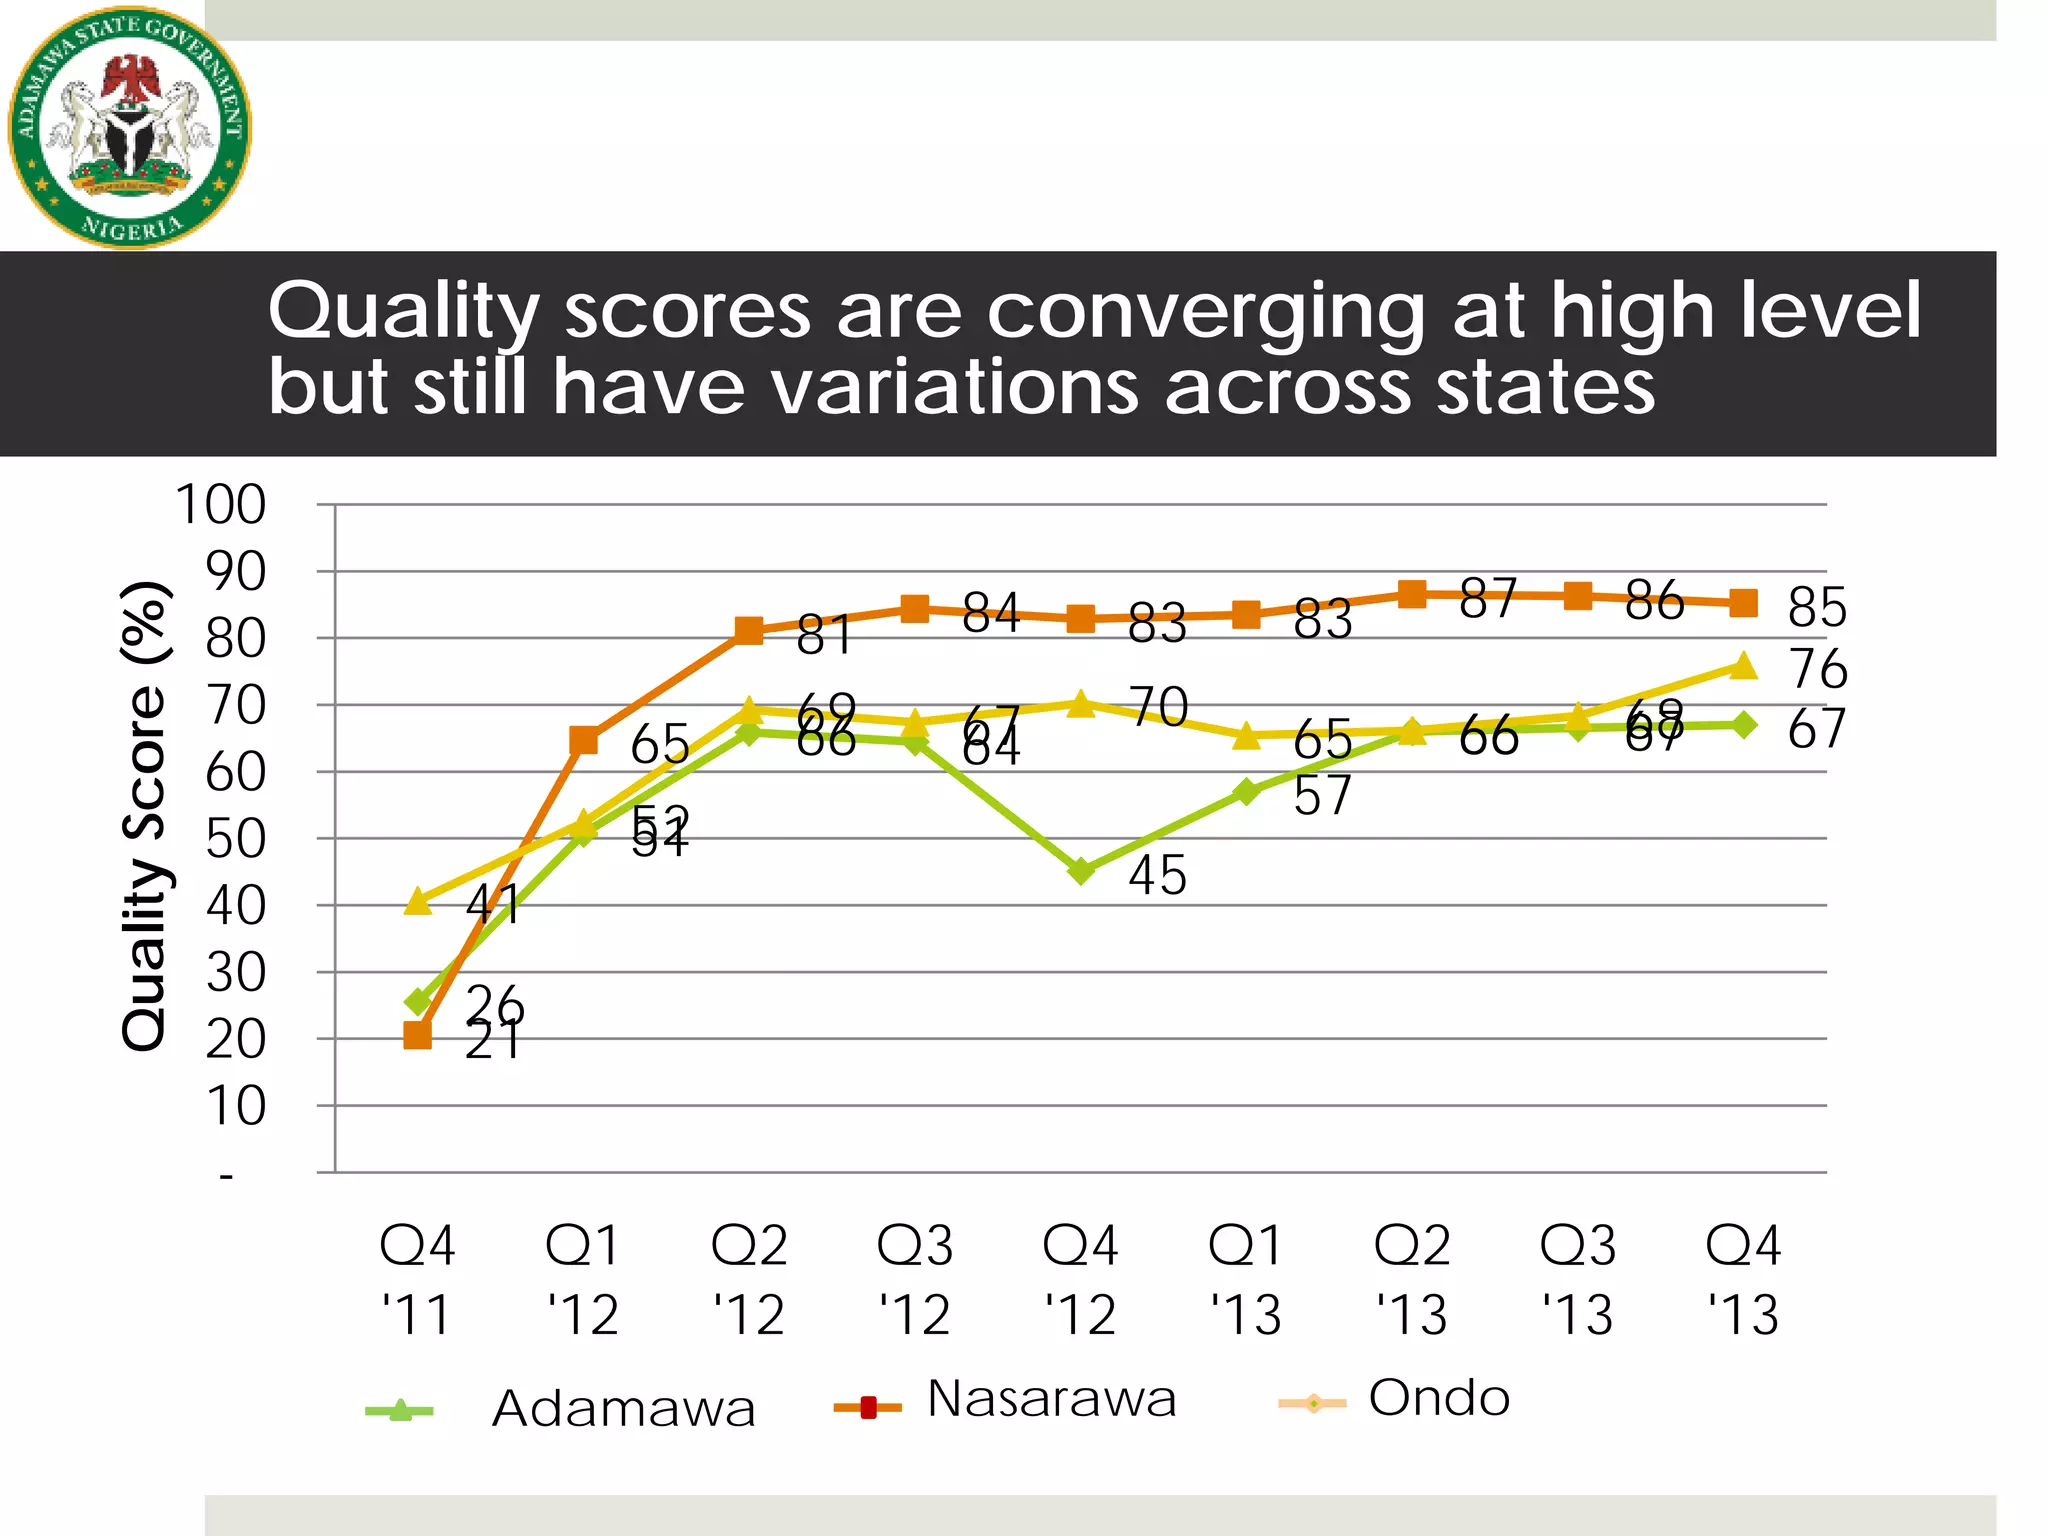
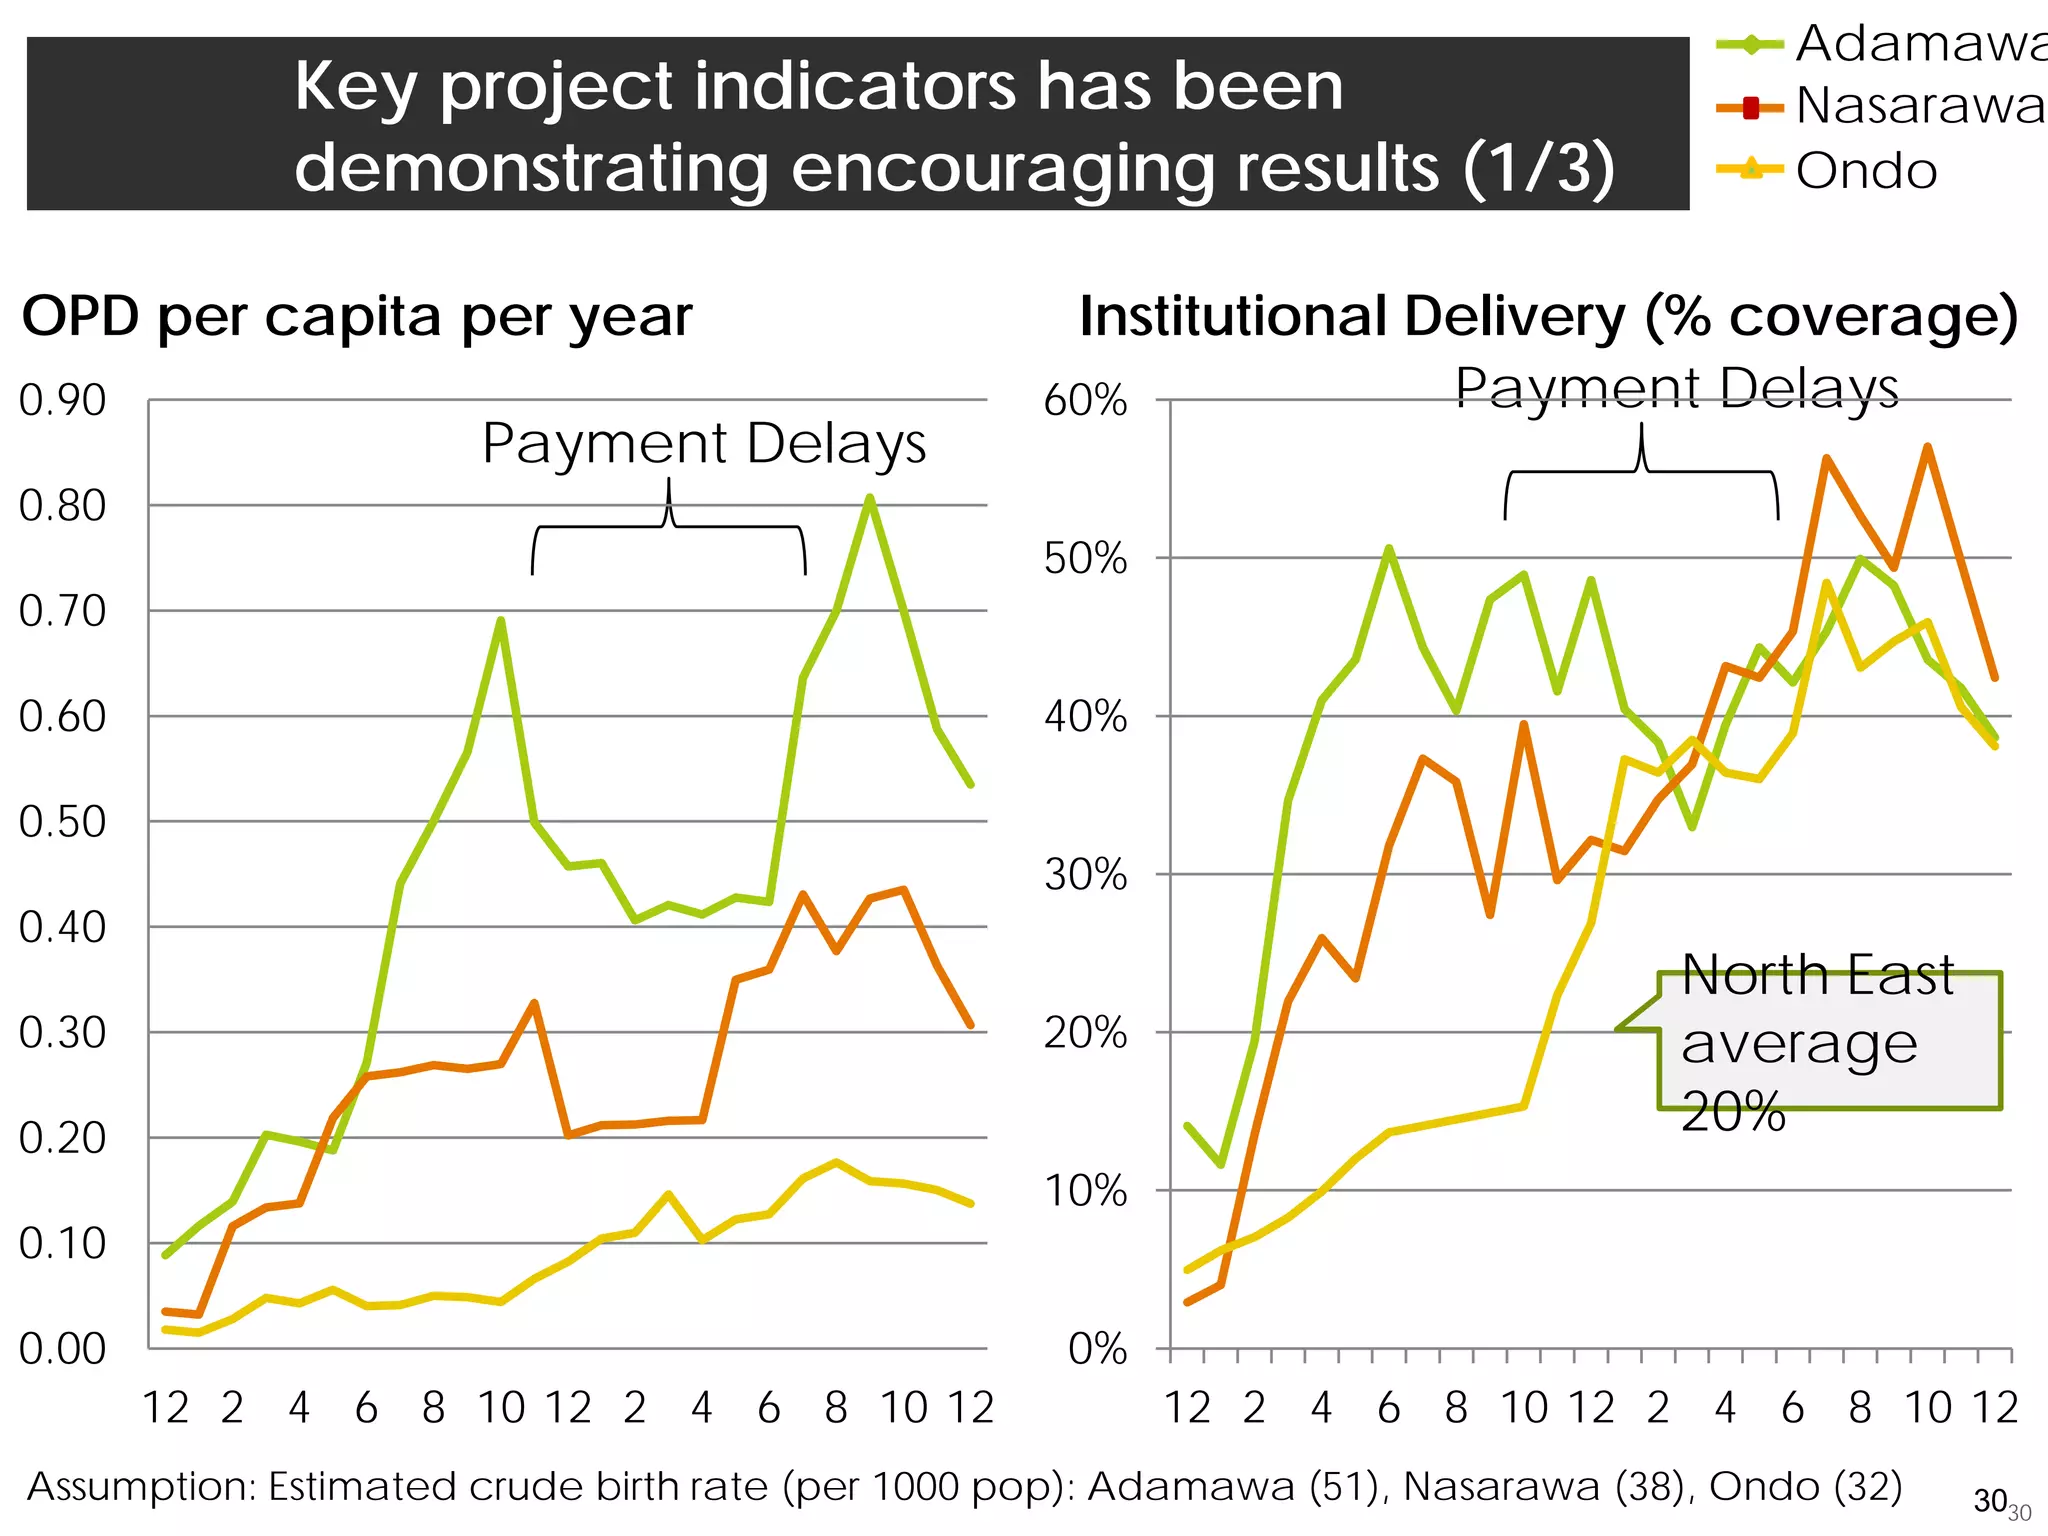
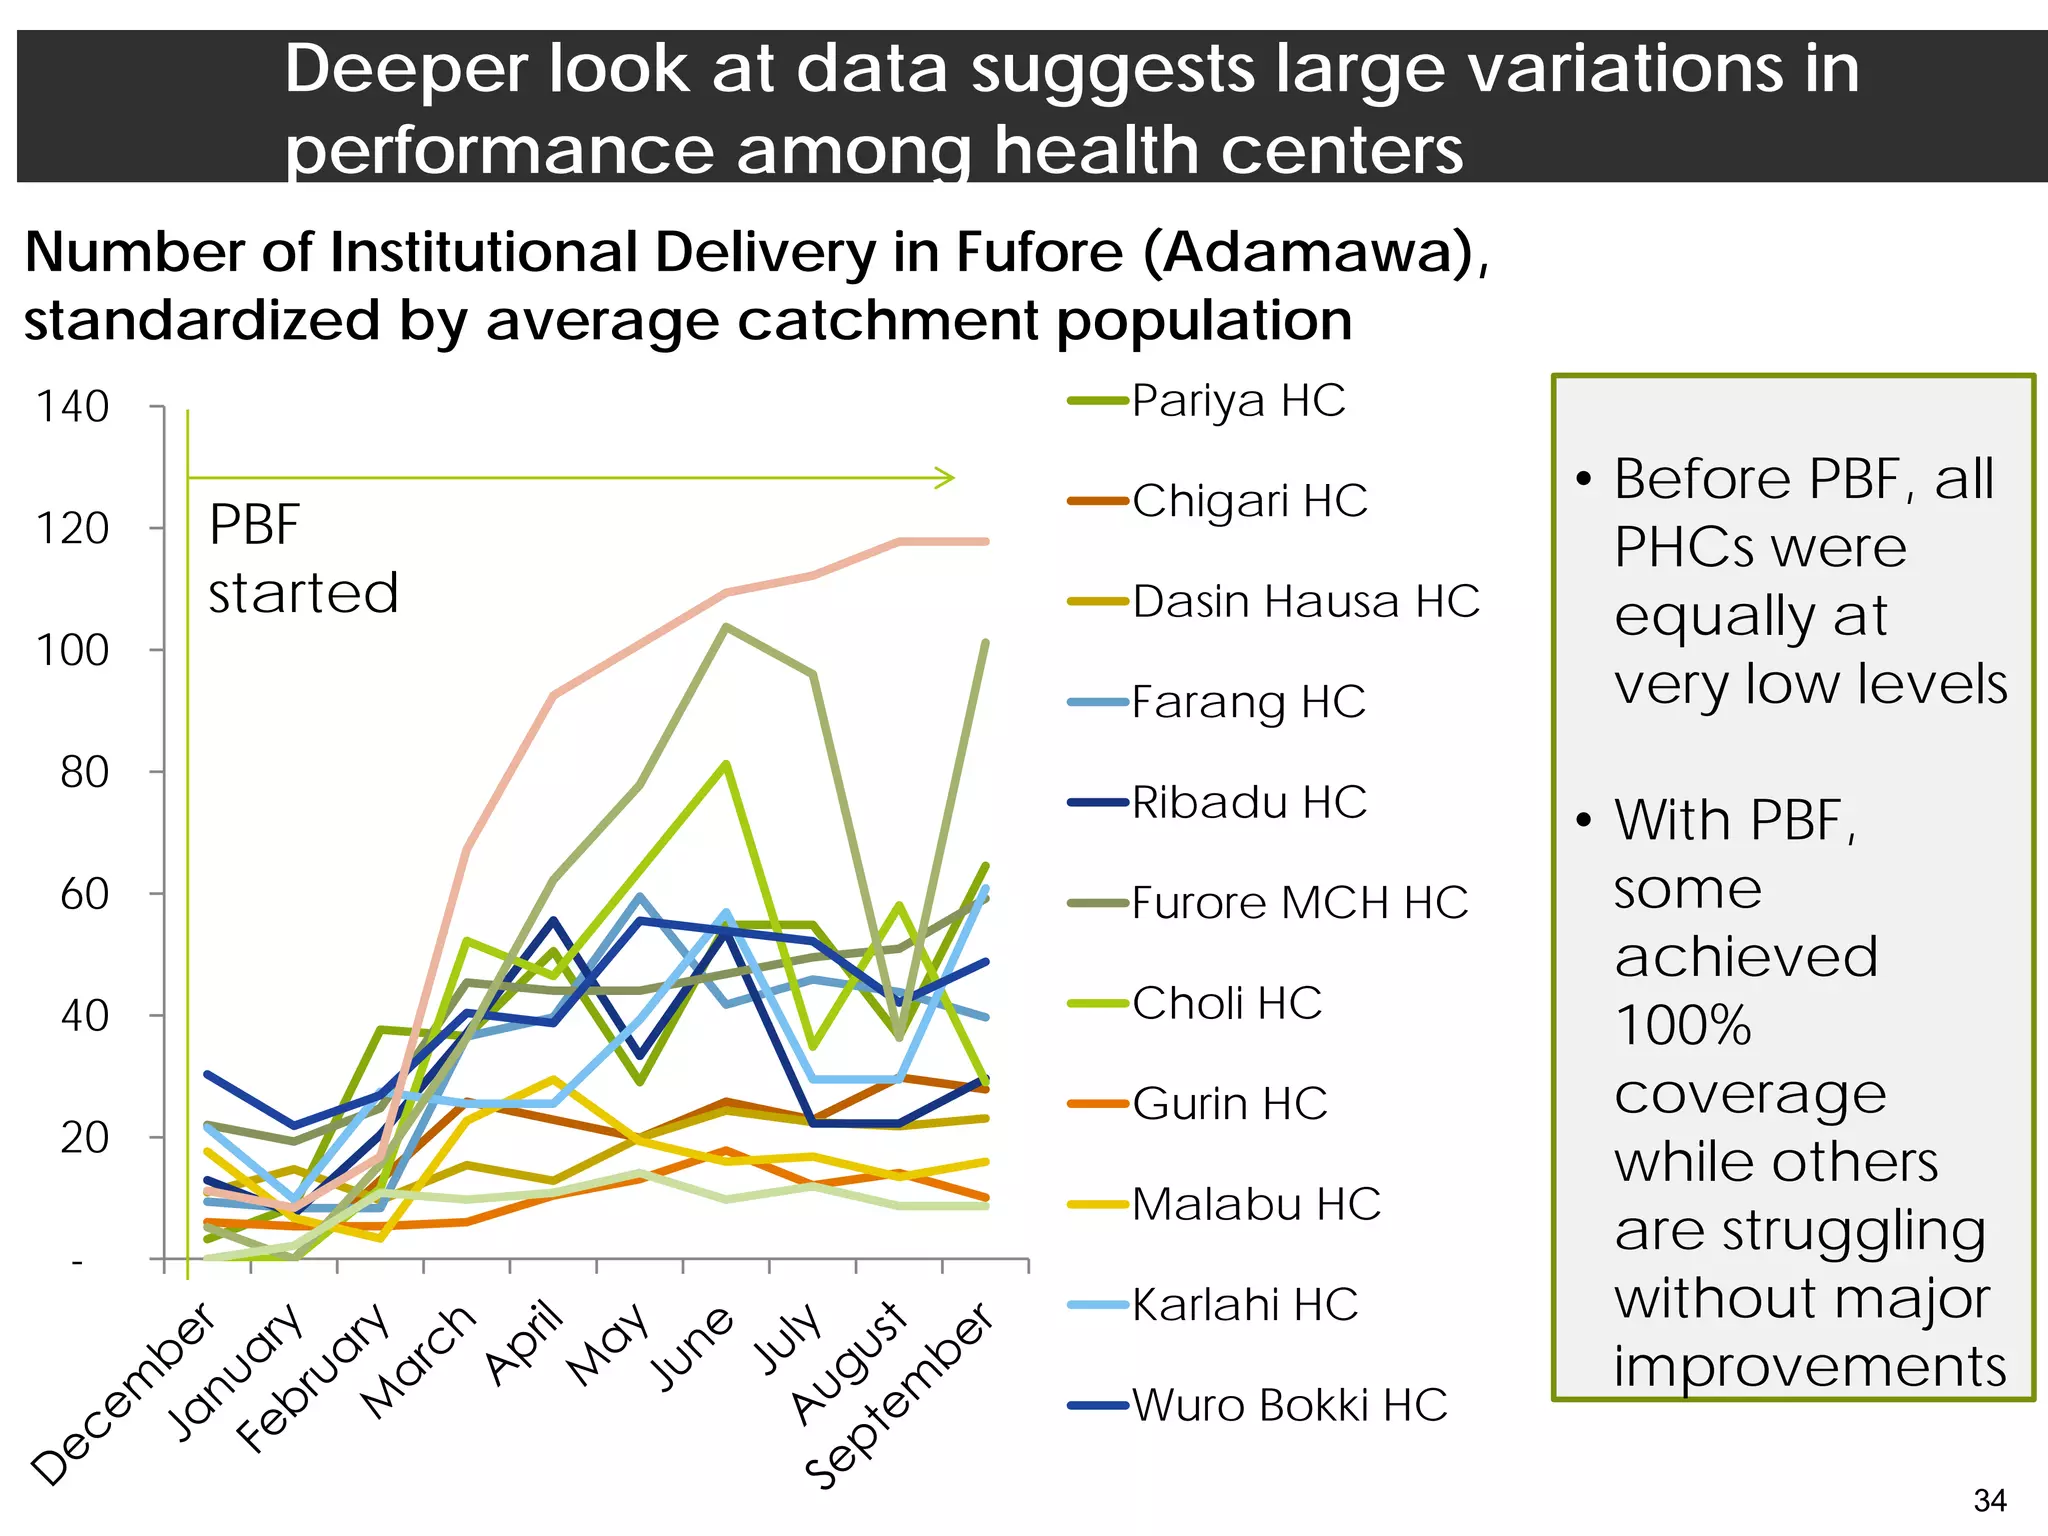
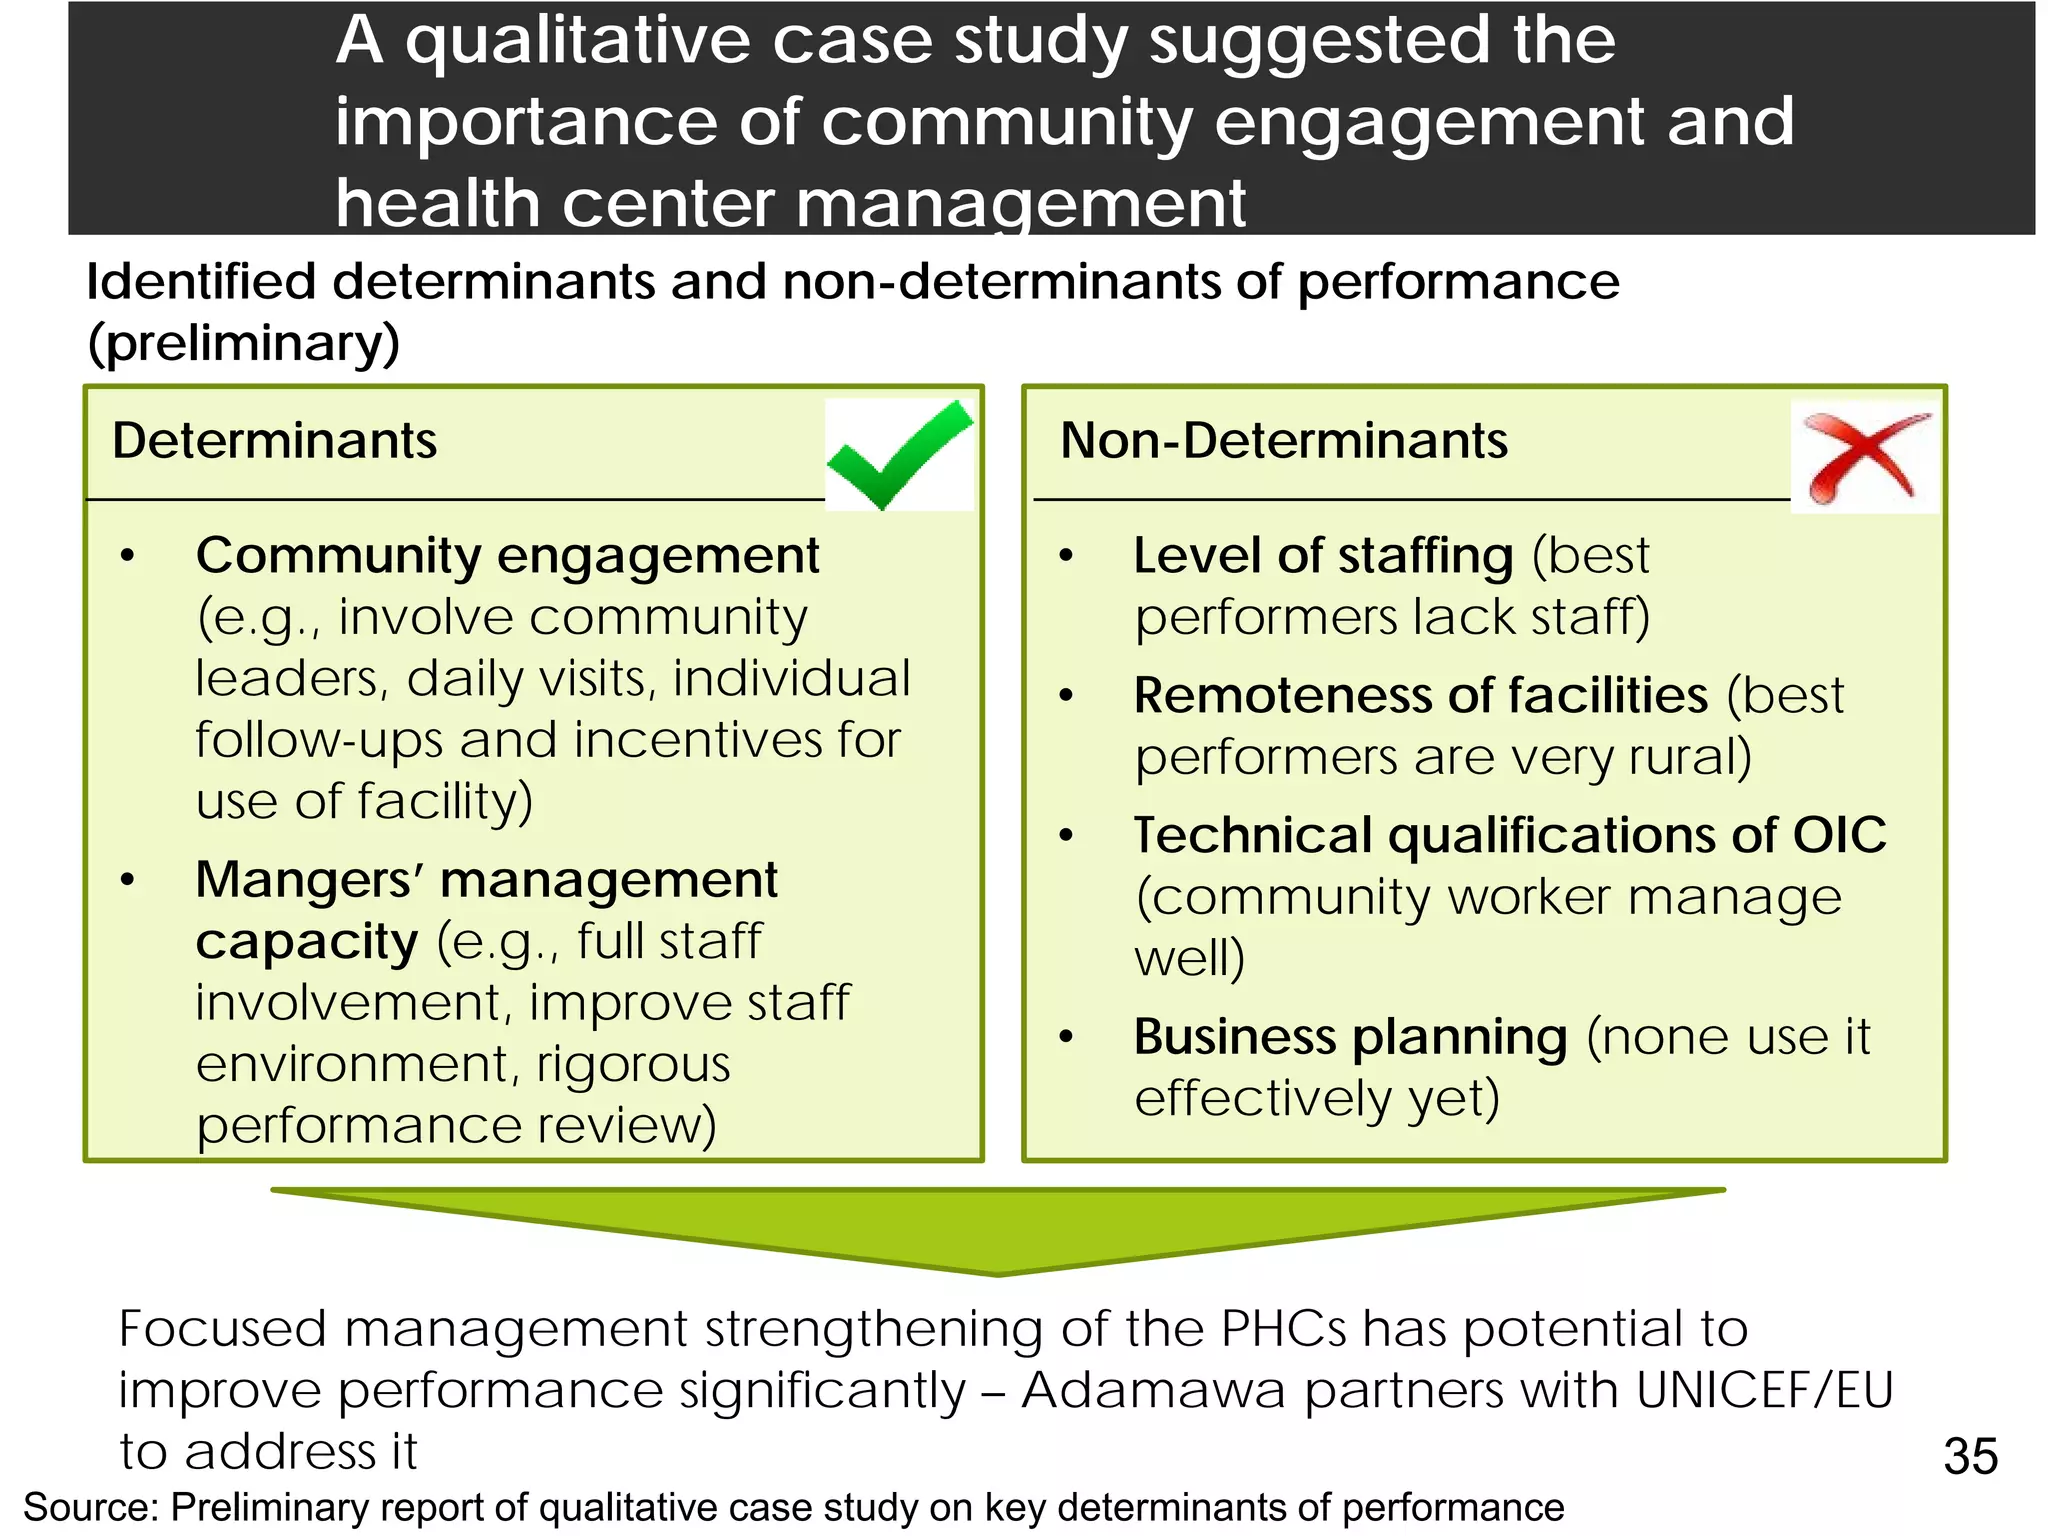
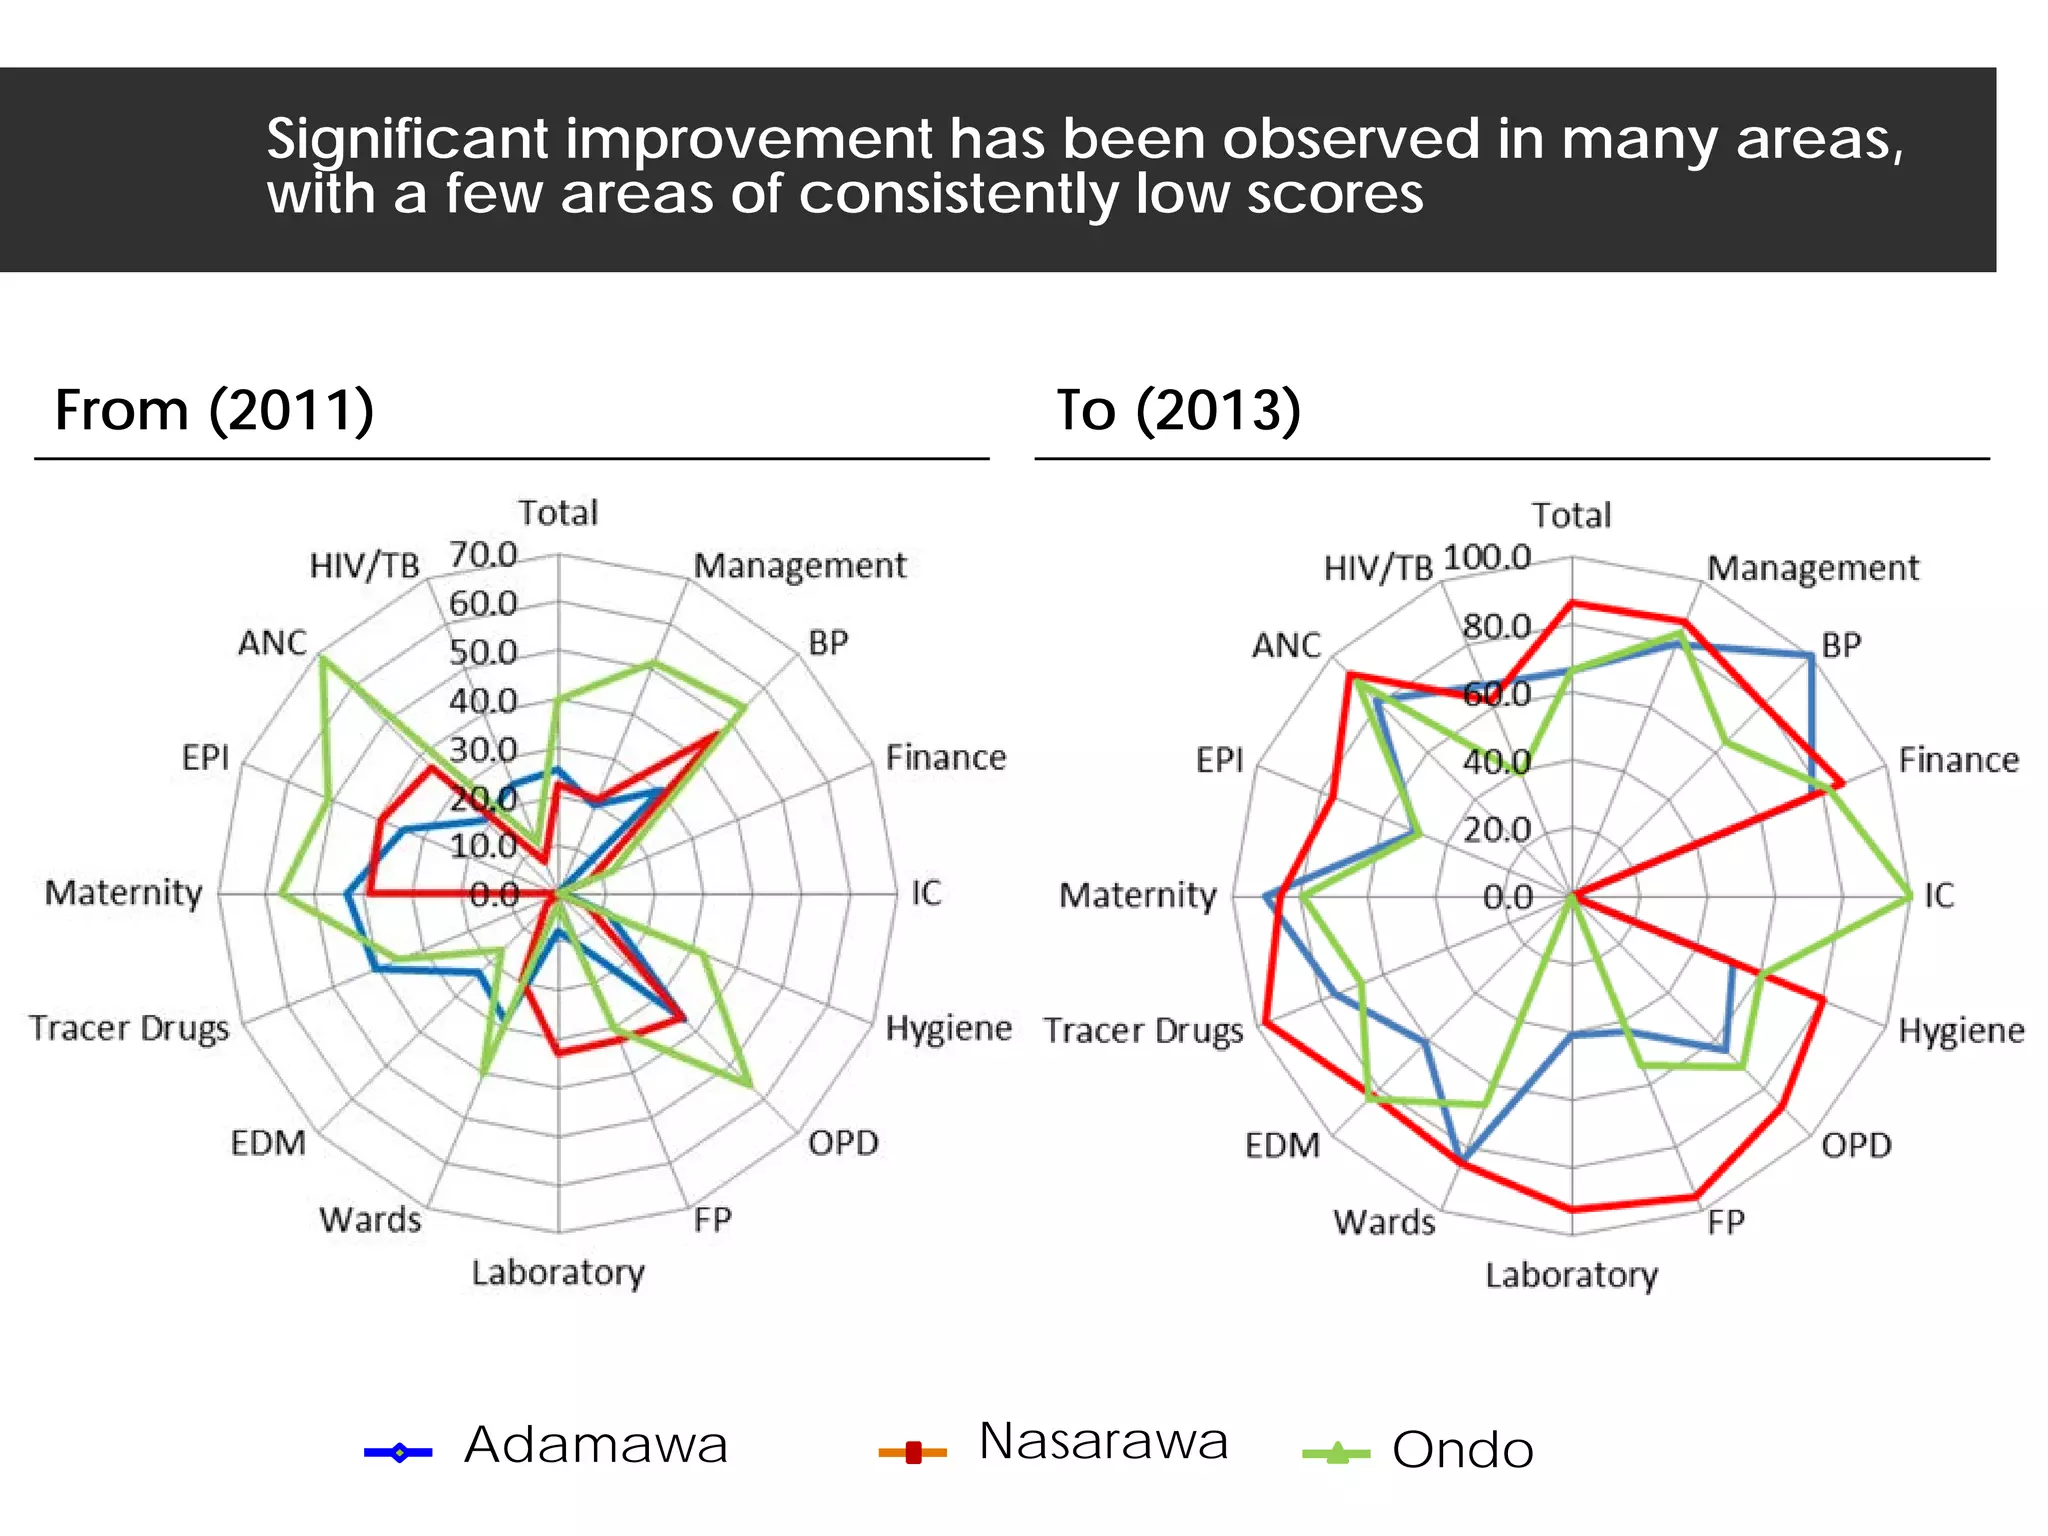
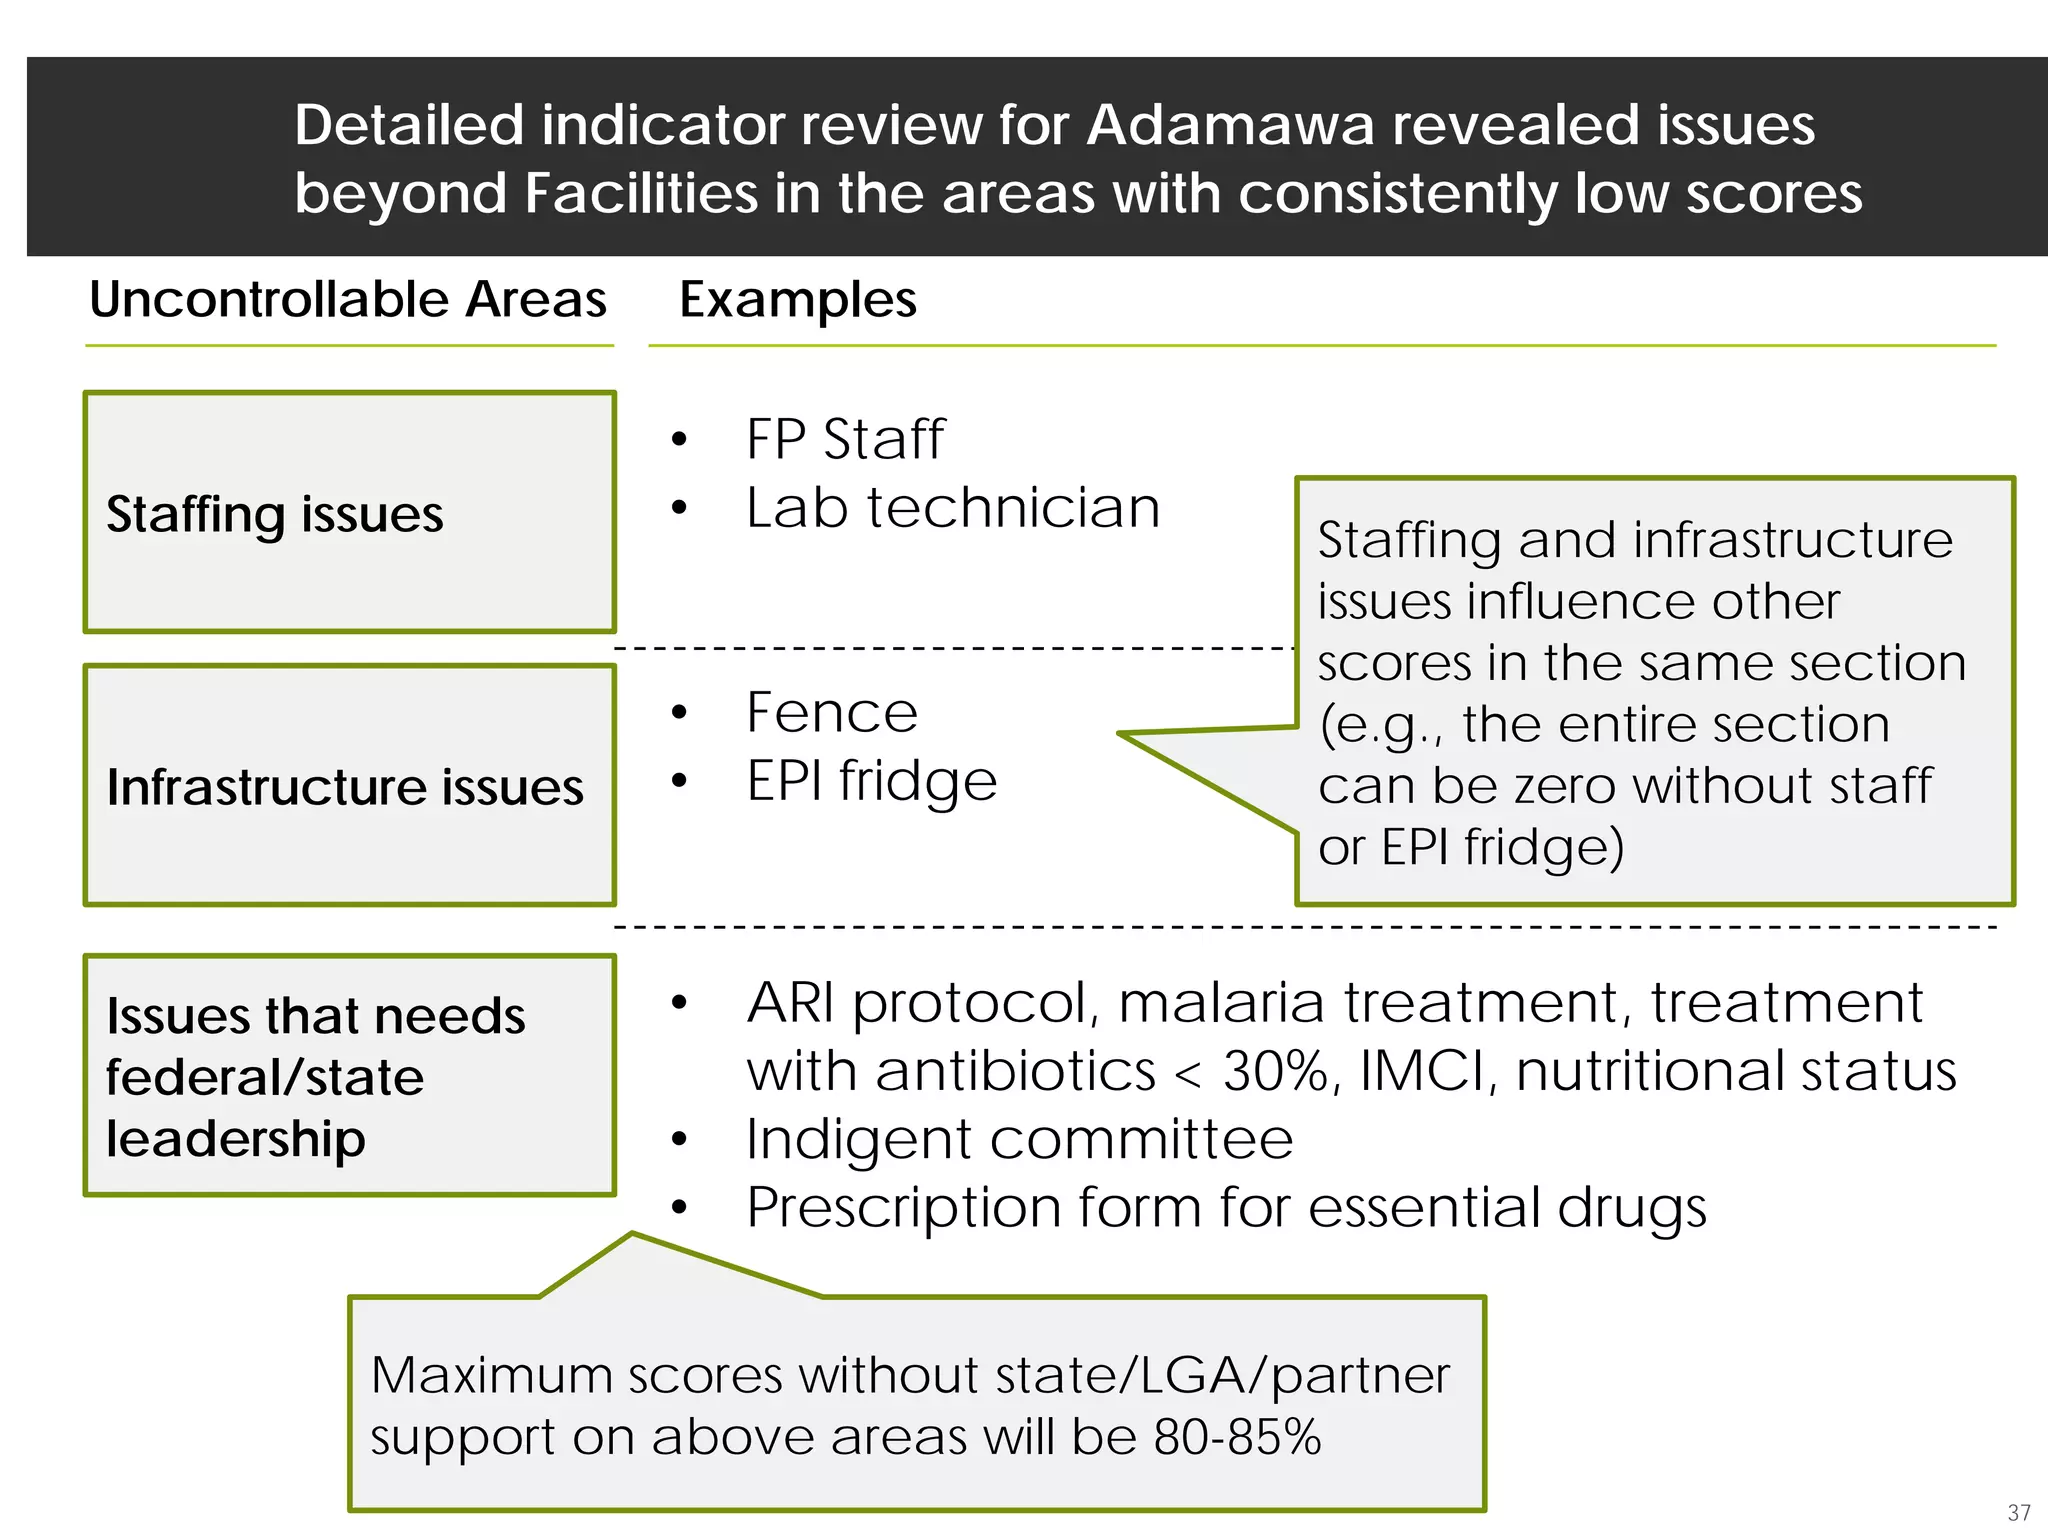
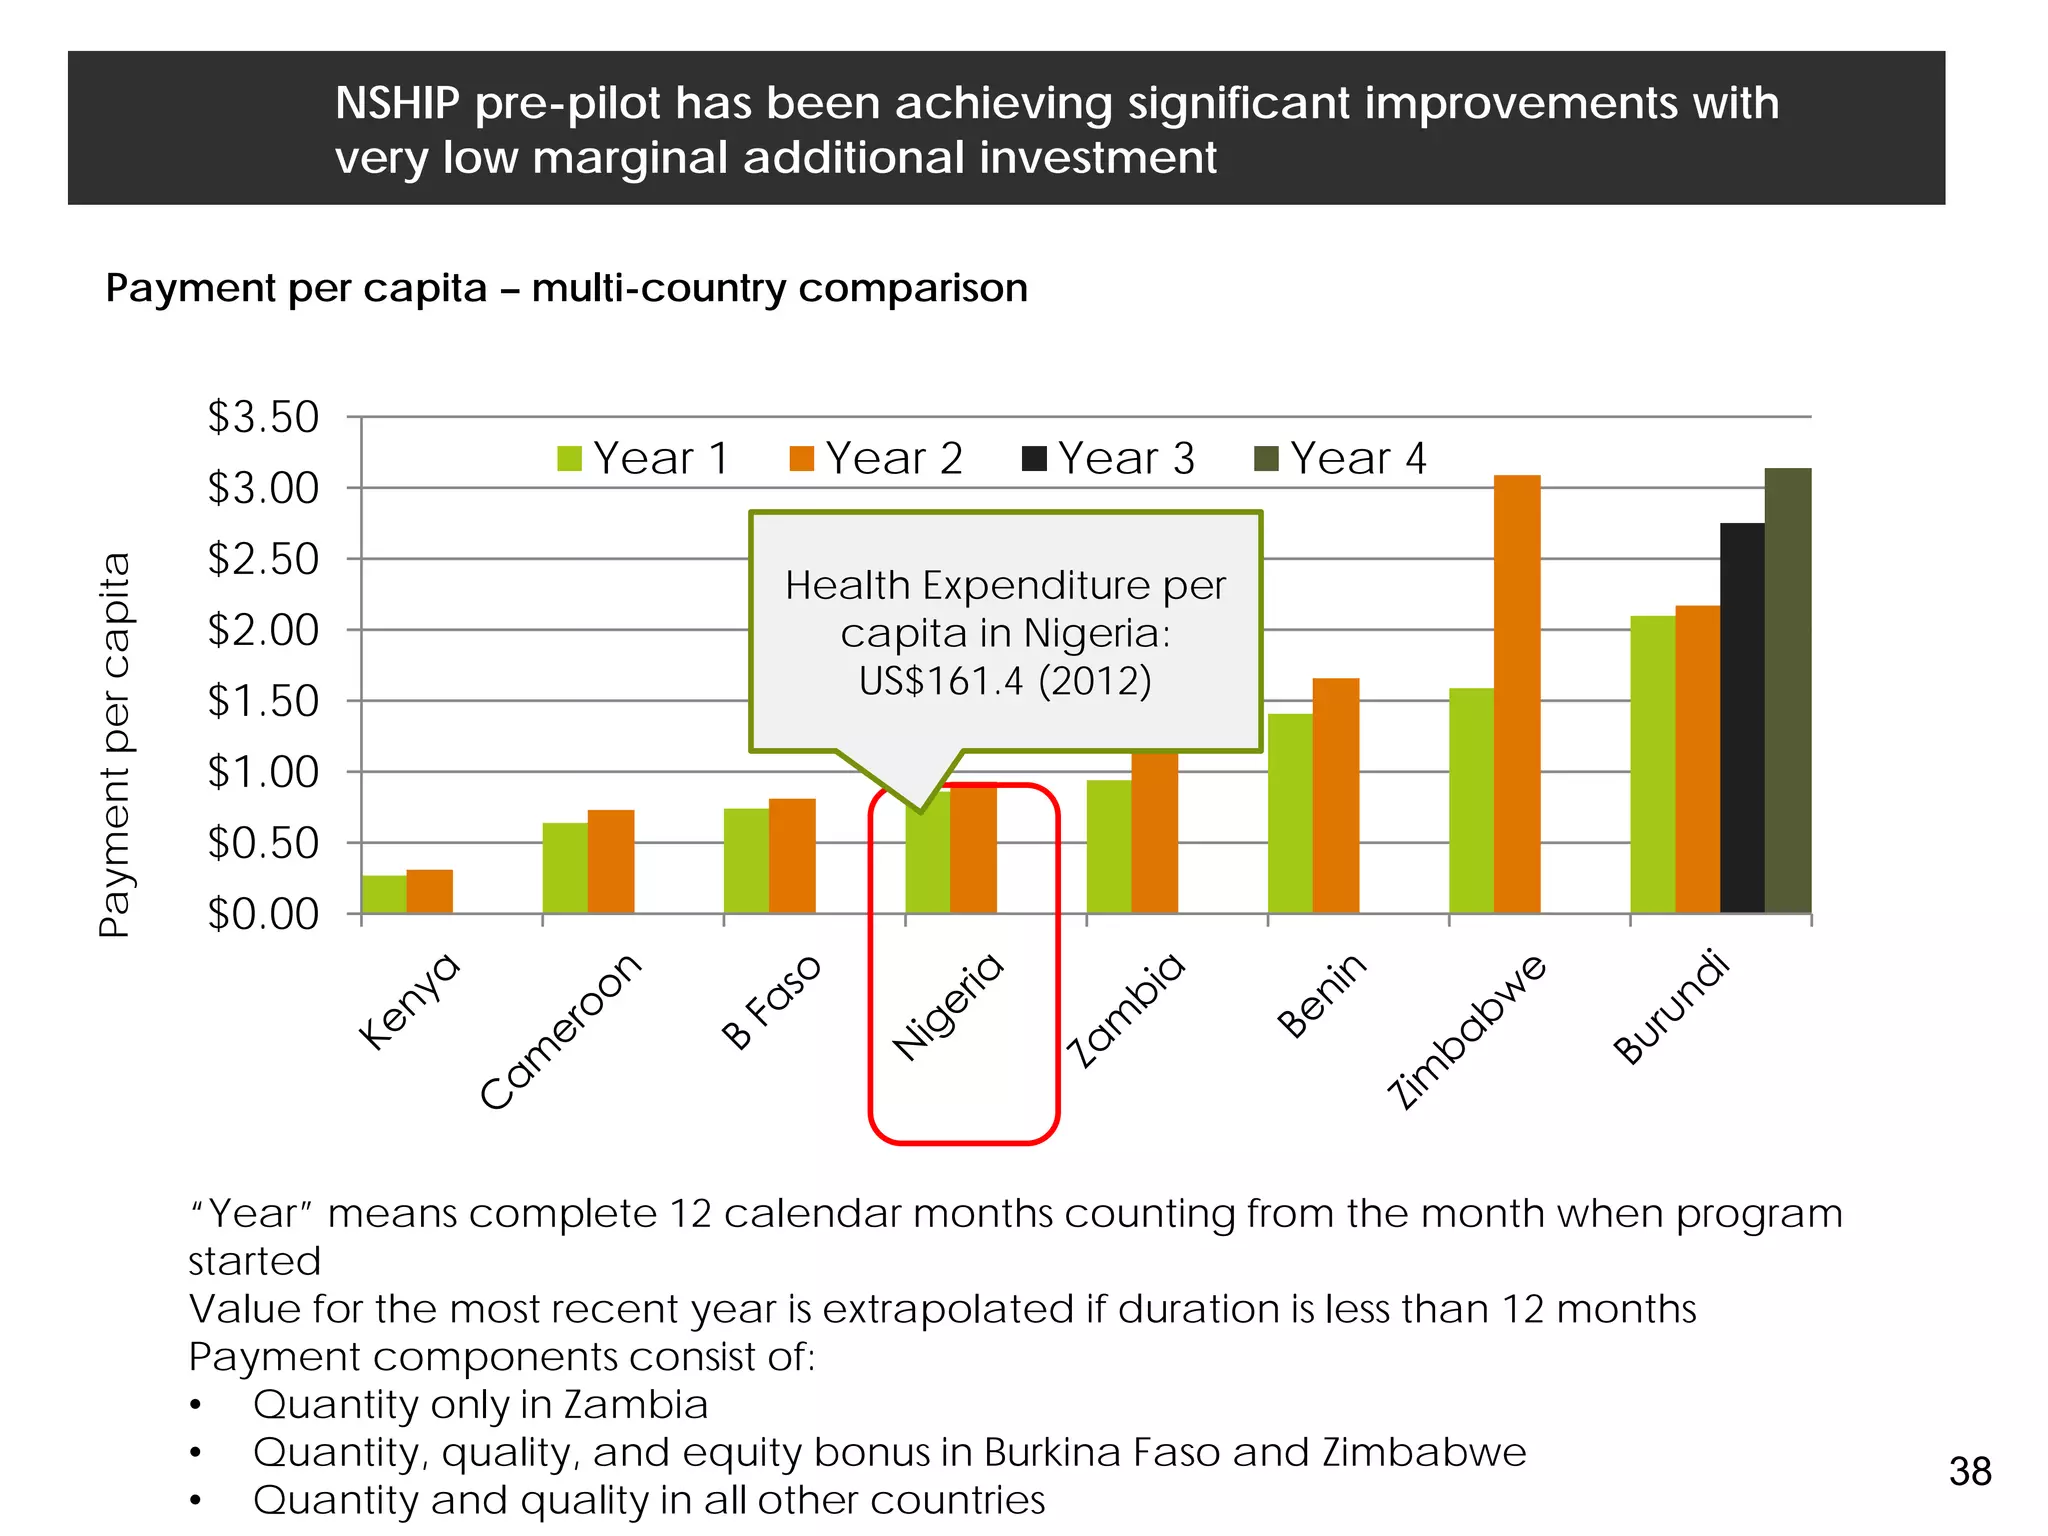


The Adamawa Primary Health Care System in Nigeria has implemented performance-based financing (PBF) to address underlying issues plaguing the health system. After two years of pre-pilot implementation, results have been encouraging with improvements in key indicators like institutional deliveries and vaccination rates. Success stories like Mayo-Ine health center demonstrate how community engagement and strengthened management can boost coverage. However, some indicators still show room for growth, and deeper analysis finds issues like staffing shortages and infrastructure problems influencing performance. Moving forward, continued scale-up and addressing broader health system challenges will be important to sustain gains under PBF in Adamawa State.


![Millennium Development Goal 4 In Nigeria[1]](https://cdn.slidesharecdn.com/ss_thumbnails/millenniumdevelopmentgoal4innigeria1-13261342419582-phpapp02-120109124049-phpapp02-thumbnail.jpg?width=640&height=640&fit=bounds)


