This document summarizes research conducted by MKT 8200 on mobile market research startup 1Q. It includes the following key points:
1) 1Q is a mobile market research startup that pays users small amounts to answer survey questions and shares location data with partner companies. The research aims to help 1Q increase active user engagement.
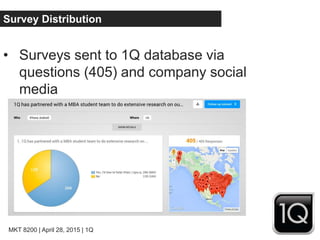
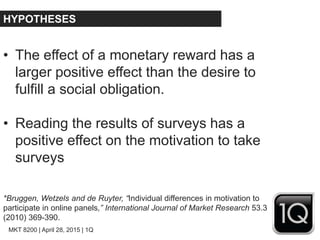
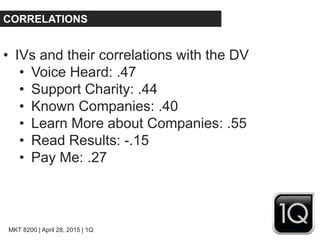
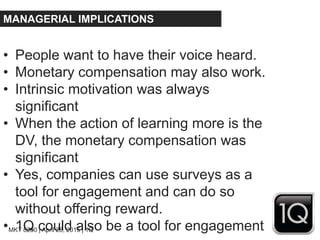
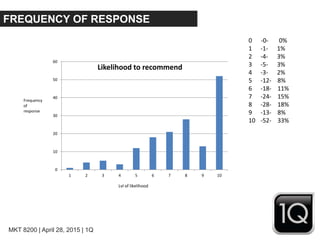
2) Surveys of 1Q users found that intrinsic motivations like having their voice heard are more influential than monetary compensation in driving user engagement. Companies can effectively use surveys for engagement without offering rewards.
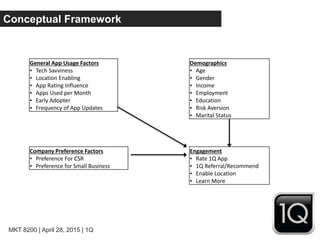
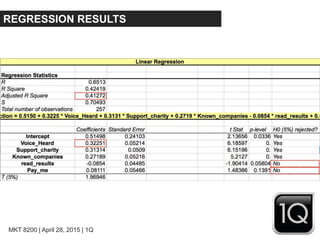
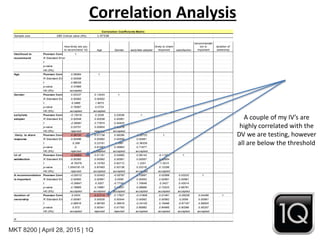
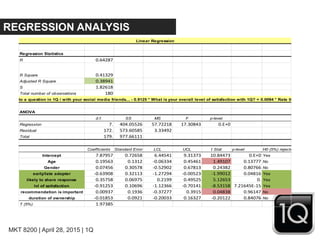
3) Analysis of factors influencing users' likelihood to recommend 1Q found that early adopters, those likely to share responses, and satisfied users were most likely to recommend. You


![MKT 8200 | April 28, 2015 | 1Q
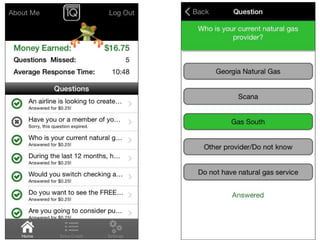
MOBILE MARKET RESEARCH STARTUP
• Founded in 2012, 4 employees
• Company’s pay $1 a response per
question/offer/coupon to a targeted
[demographics & location based]
audience
• Members get paid $.50/$.25 instantly via
paypal per response
• Members can donate payments to](https://image.slidesharecdn.com/d5b070ad-edc4-49e6-9f97-1f9f5dd2ca78-150825174710-lva1-app6891/85/1Q_Final-Project-3-320.jpg)


![Marketing Apps [Infographic]](https://cdn.slidesharecdn.com/ss_thumbnails/ionmarketingappsinfographic-140203133718-phpapp02-thumbnail.jpg?width=640&height=640&fit=bounds)


