Download as PDF, PPTX

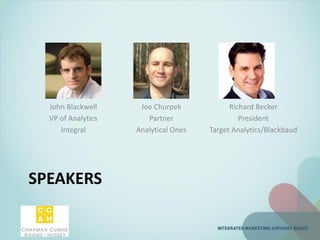
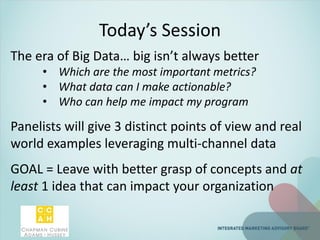
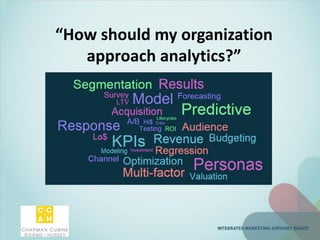
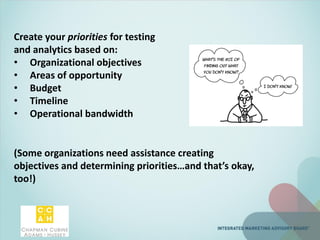

The session titled 'Speed Dating the Data Geeks' covers nonprofit analytic trends and services, focusing on how organizations can leverage data to improve fundraising and donor engagement. Panelists provide insights on important metrics, actionable data, and analytic methodologies while sharing real-world examples of successful data-driven strategies. Attendees are encouraged to develop priorities for testing and analytics based on their organizational objectives, opportunities, and resources.