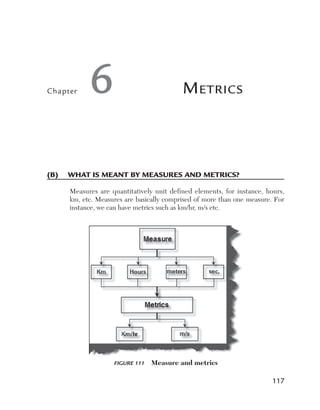
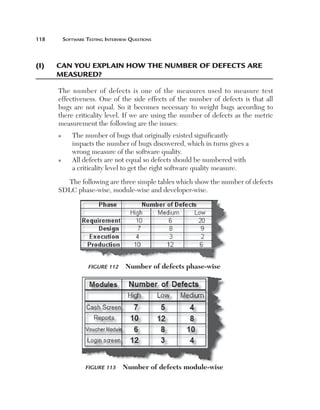
The document is a book about software testing interview questions. It provides information to help readers prepare for software testing interviews, including sample resumes, a software testing tool demo, estimation templates, and chapters on various software testing topics, techniques, and metrics. The accompanying CD contains additional resources like the testing tool, ebooks, and an interview rating sheet to help evaluate readiness for interviews. The book is intended to help both new and experienced testers seeking opportunities in the software testing field.


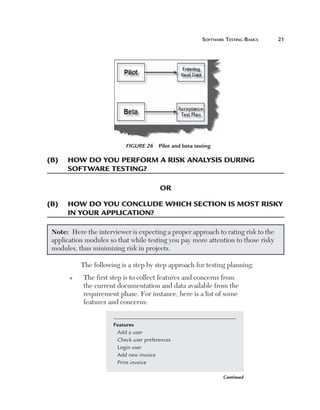


![automated teSting 145
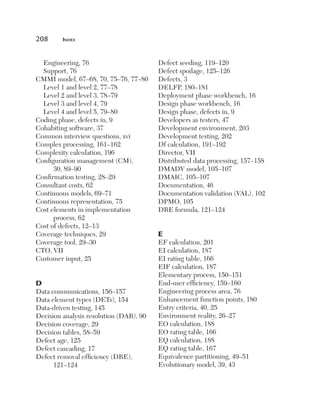
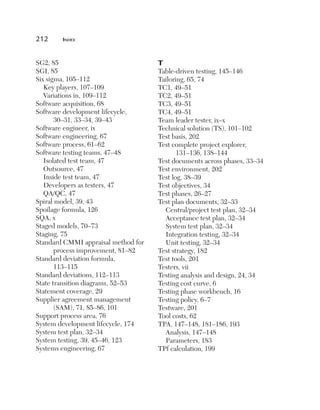
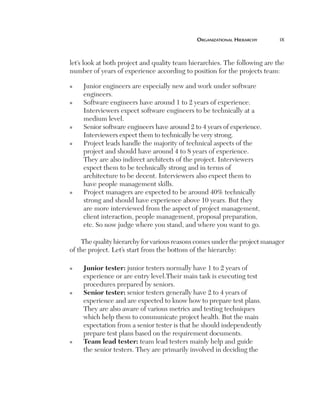
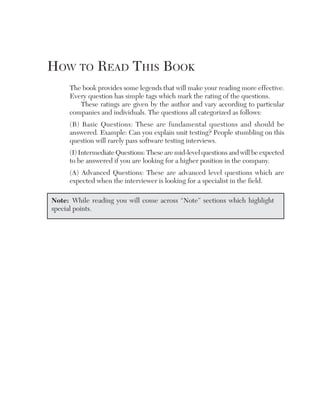
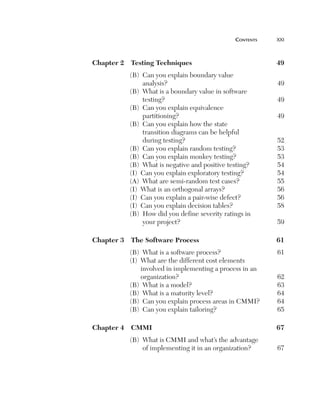
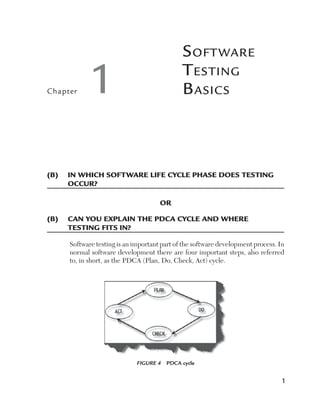
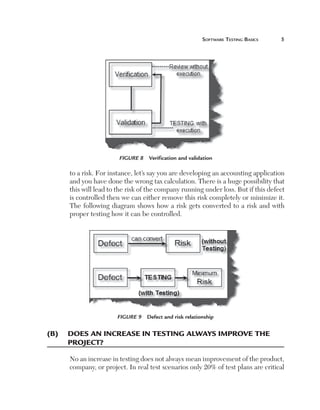
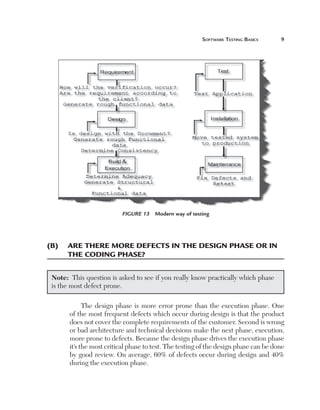
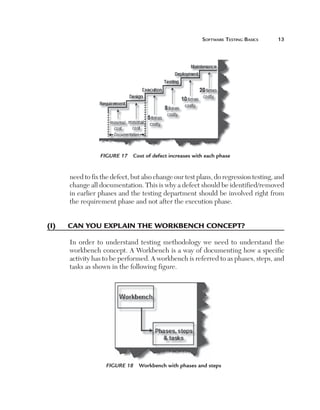
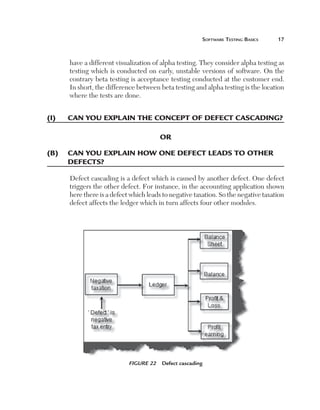
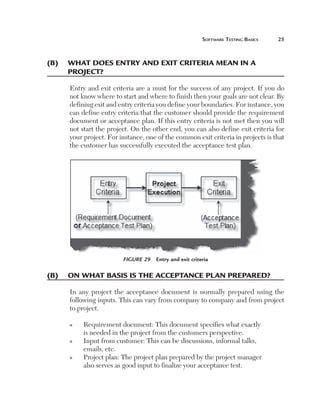
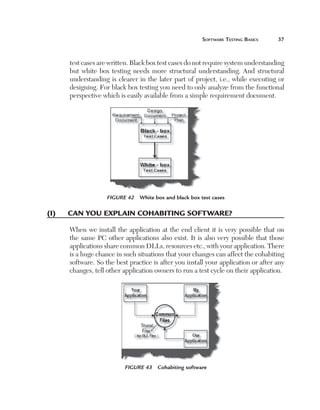
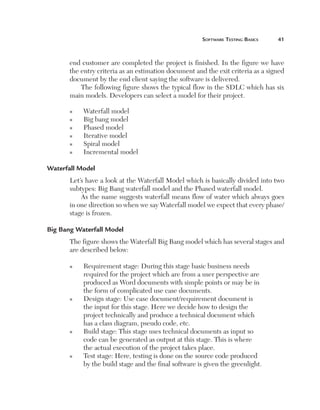
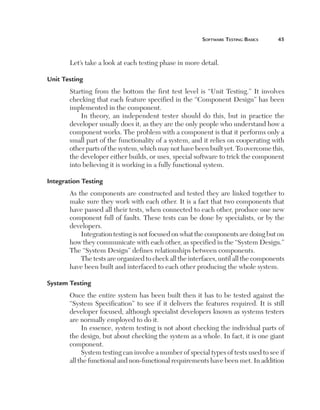
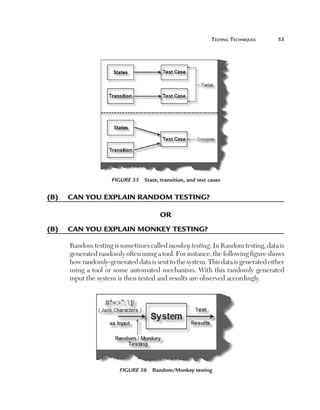
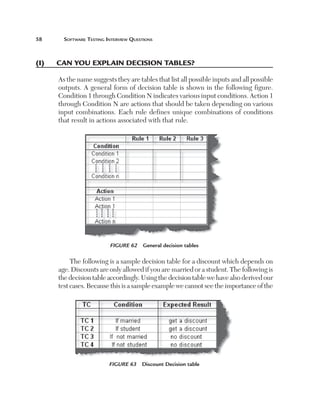
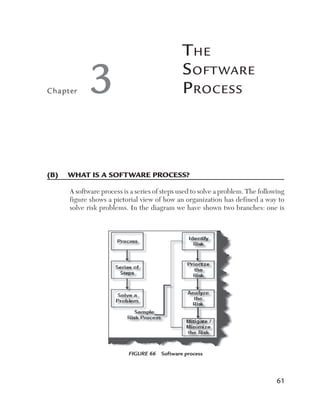
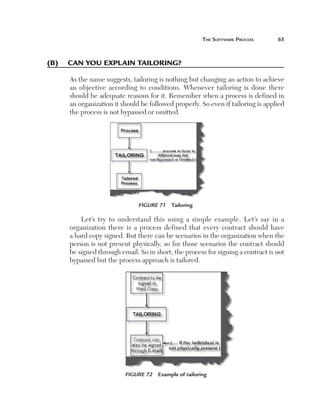
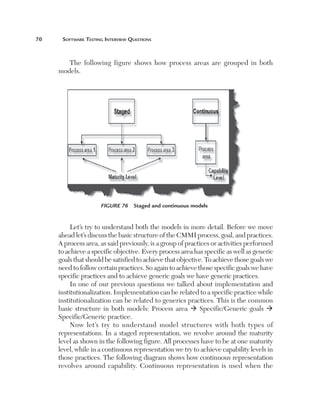
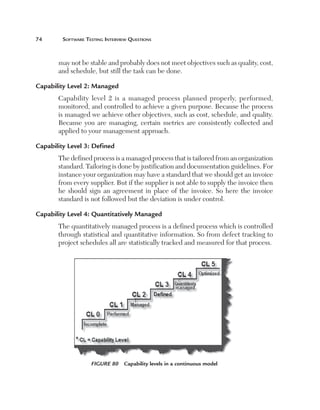
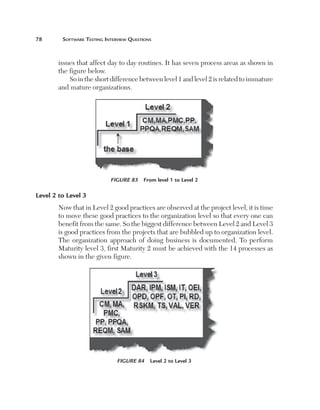
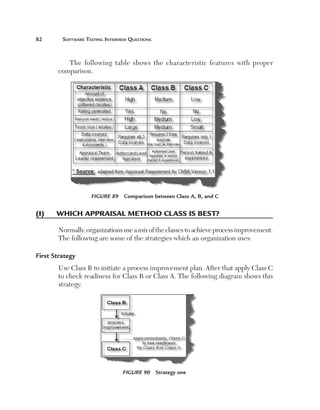
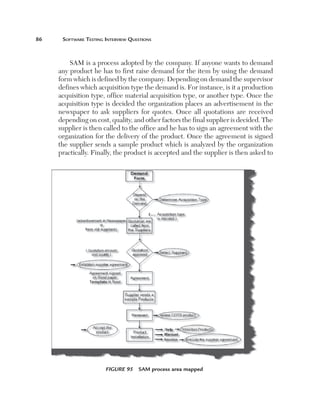
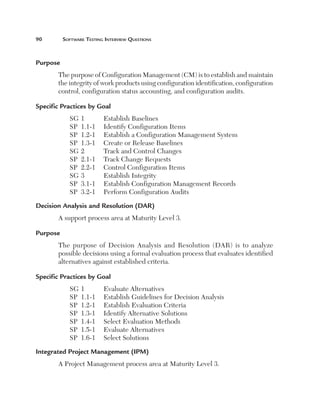
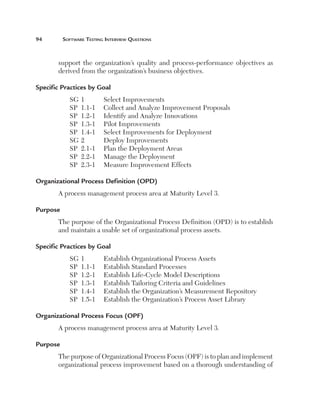
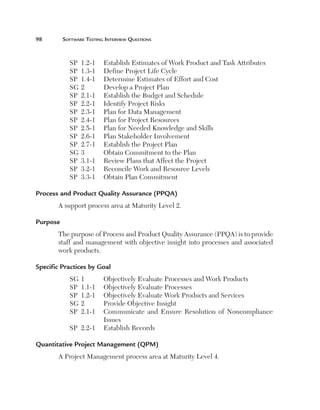
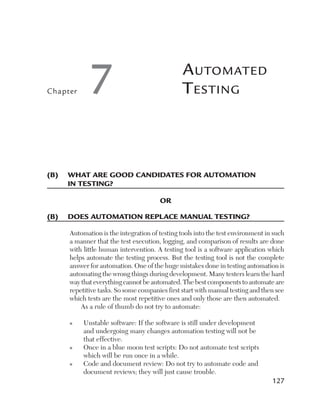
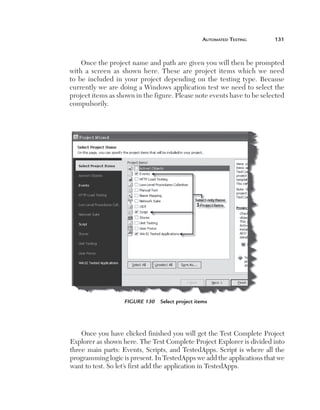
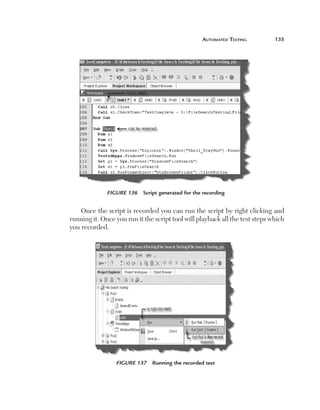
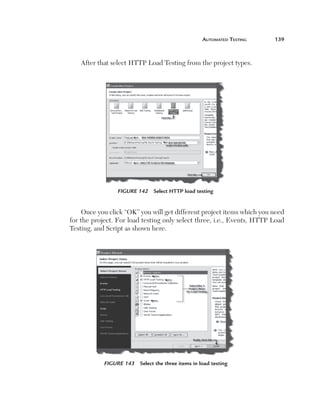
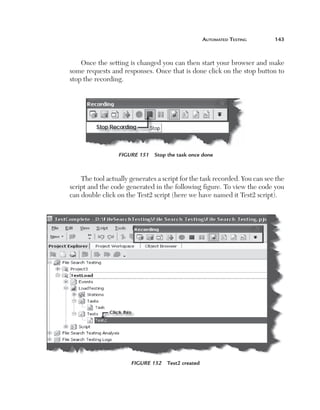
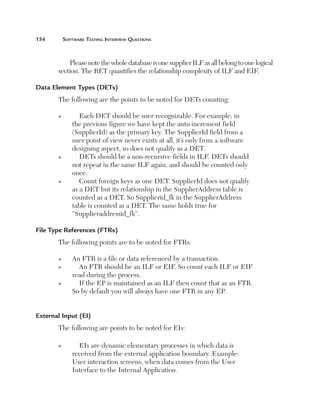
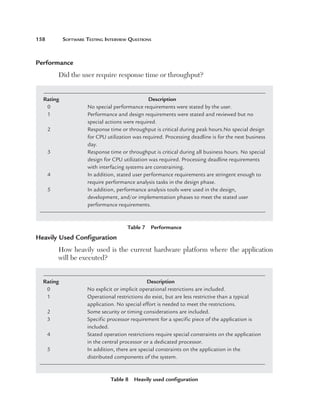
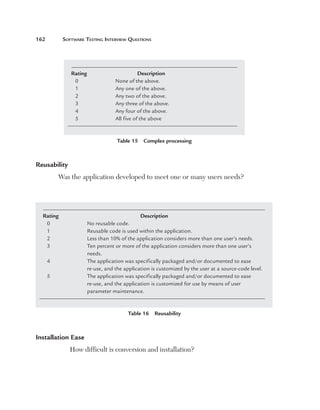
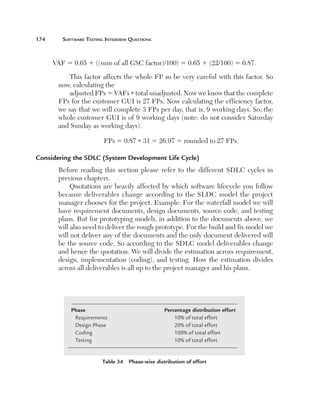
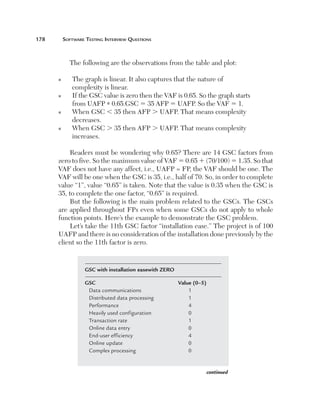
(i) can you explain data-driven testing?
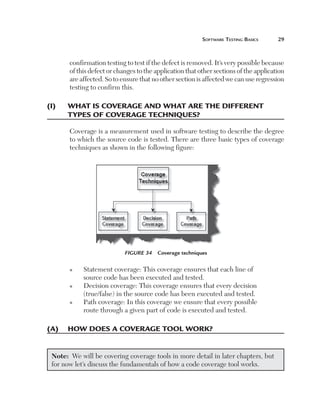
Normally an application has to be tested with multiple sets of data. For
instance, a simple login screen, depending on the user type, will give different
rights. For example, if the user is an admin he will have full rights, while a
user will have limited rights and support if he only has read-only support
rights. In this scenario the testing steps are the same but with different user
ids and passwords. In data-driven testing, inputs to the system are read from
data files such as Excel, CSV (comma separated values), ODBC, etc. So
the values are read from these sources and then test steps are executed by
automated testing.
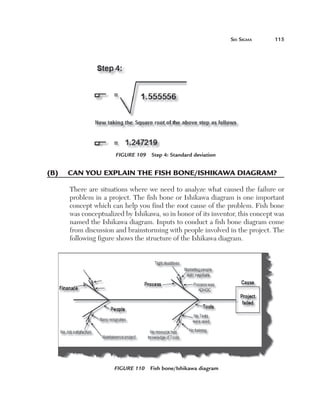
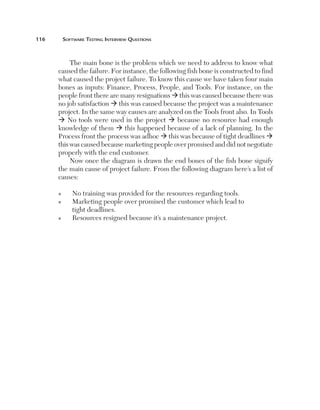
Figure 153 Data-driven testing
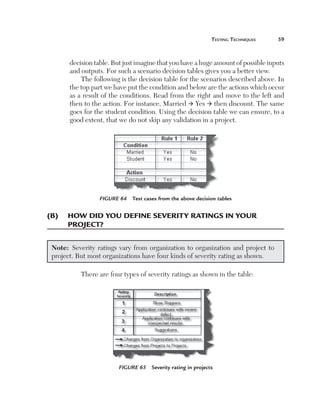
(i) can you explain taBle-driven testing?
or
(i) hoW can you perform data-driven testing using
automated Qa?
[This question is left to the user. Please install the tool and try for yourself.]](https://image.slidesharecdn.com/1934015245-120223141926-phpapp01/85/1934015245-171-320.jpg)

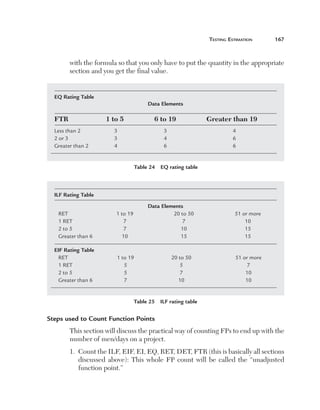
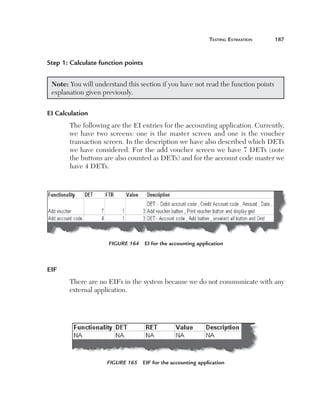
![teSting eStimation 149
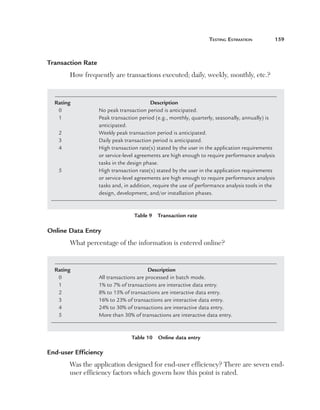
Function Point Analysis was developed first by Allan J. Albrecht in the
mid-1970s. It was an attempt to overcome difficulties associated with lines of
code as a measure of software size, and to assist in developing a mechanism to
predict efforts associated with software development. The method was first
published in 1979, then later in 1983. In 1984 Albrecht refined the method
and since 1986, when the International Function Point User Group (IFPUG)
was set up, several versions of the Function Point Counting Practices Manual
have come out.
Note: The best way to understand any complicated system is to break the system
down into smaller subsystems and try to understand those smaller sub-systems
first. In a function point you break complicated systems into smaller systems
and estimate those smaller pieces, then total up all the subsystem estimates to
come up with a final estimate.
Basics of Function Points
The Following are some terms used in FPA: [Function Point analysis].
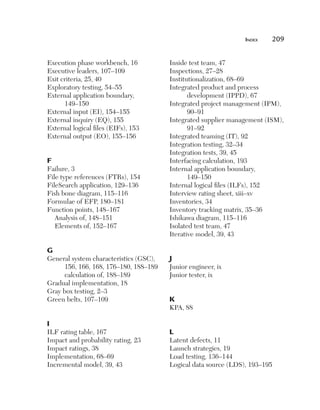
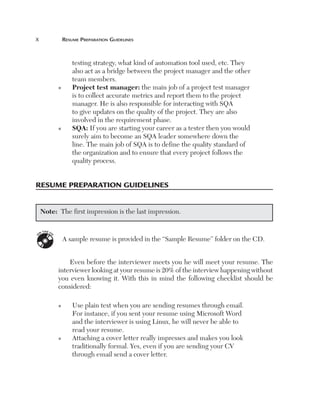
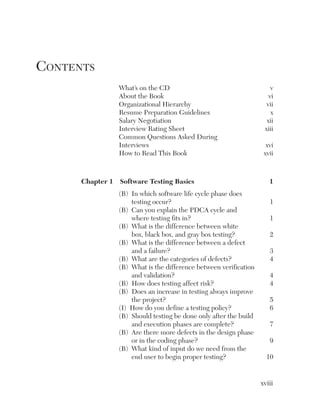
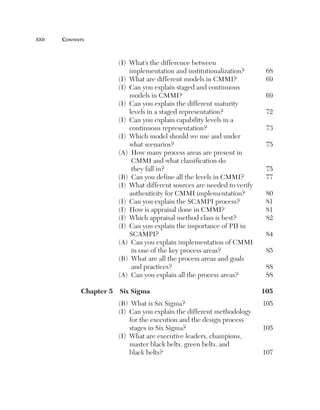
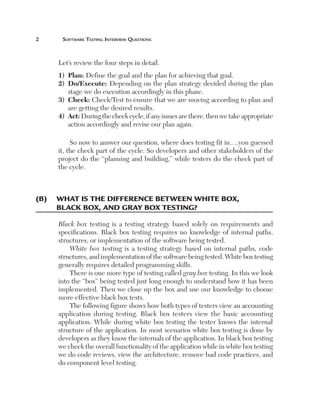
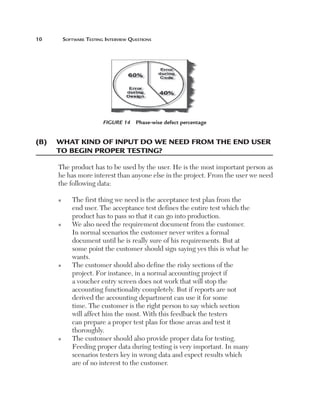
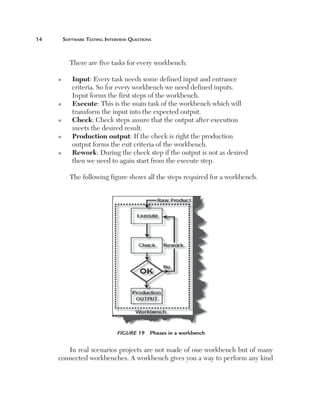
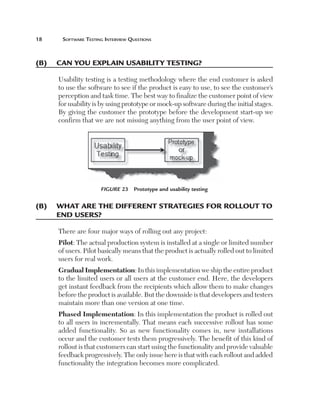
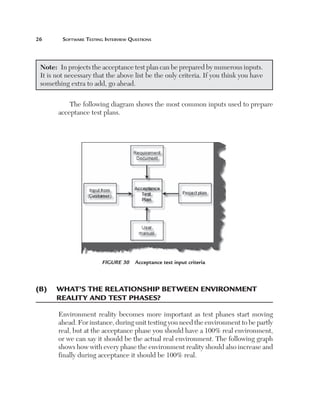
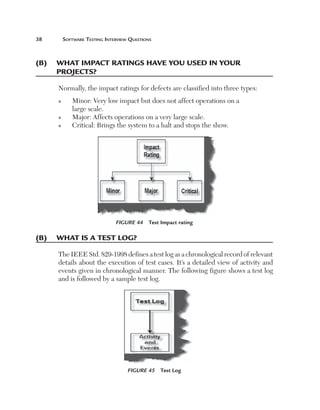
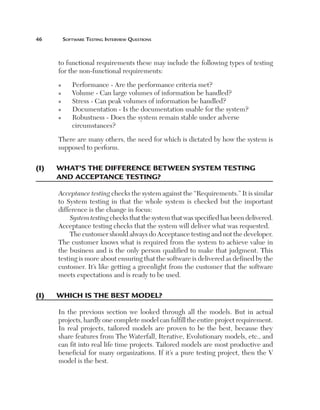
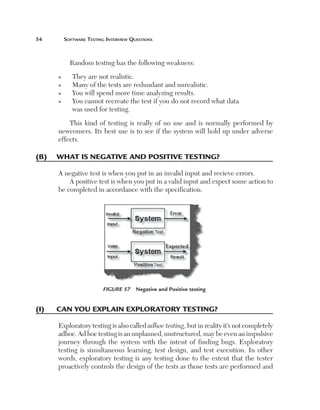
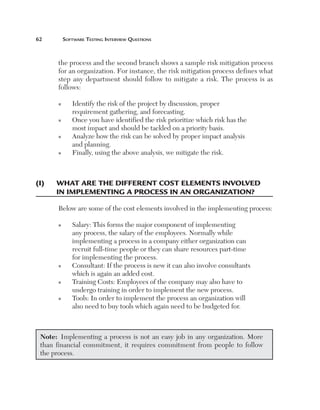
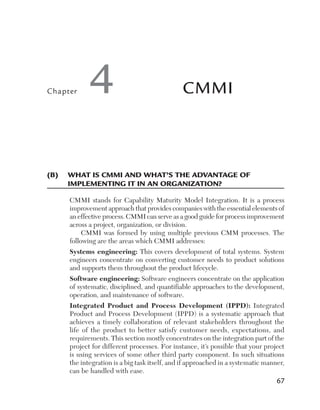
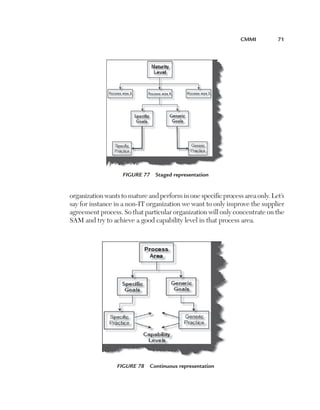
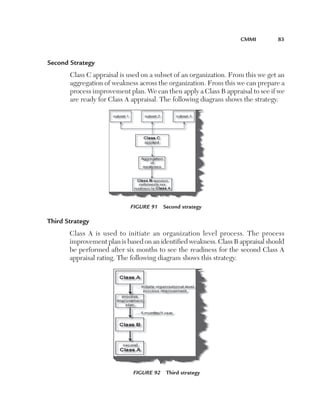
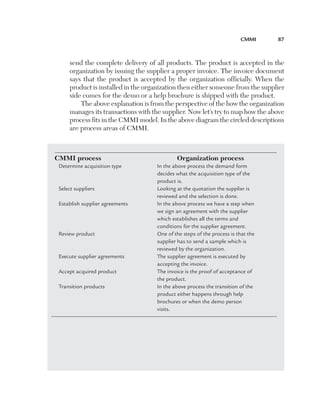
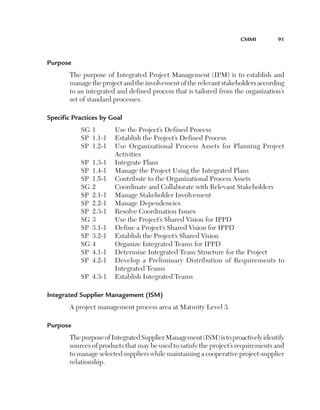
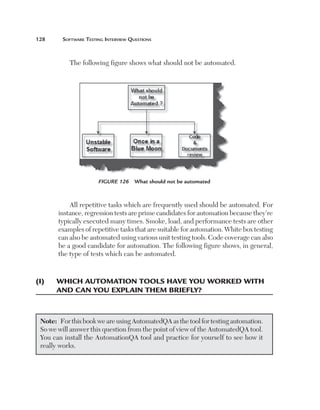
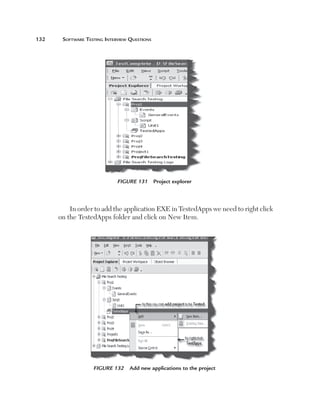
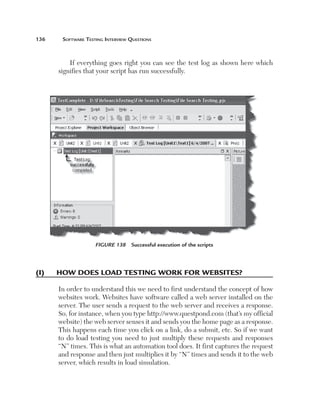
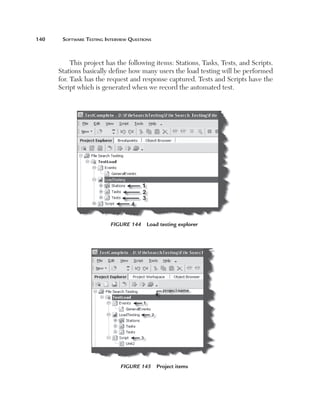
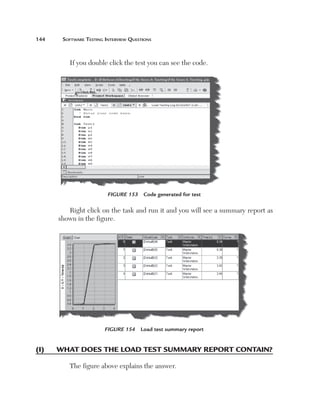
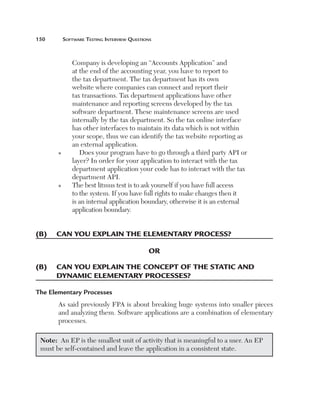
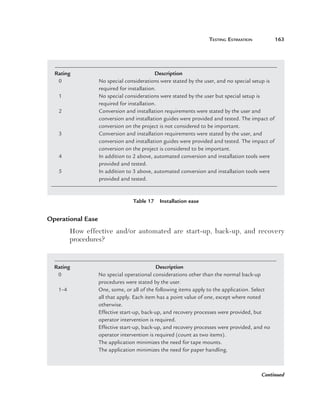
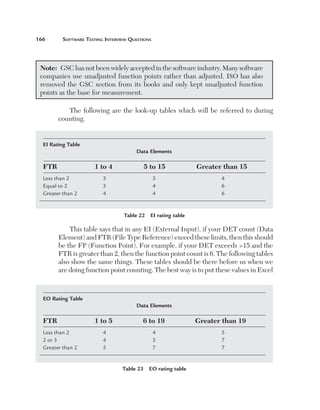
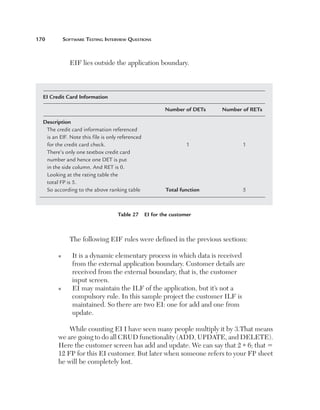
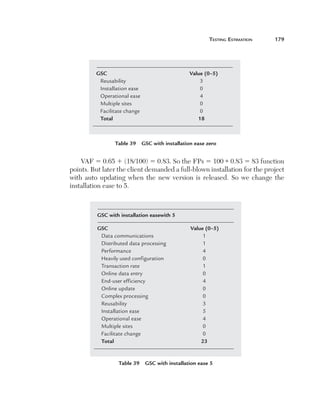
(B) an you explain an application Boundary?
c
Application Boundary
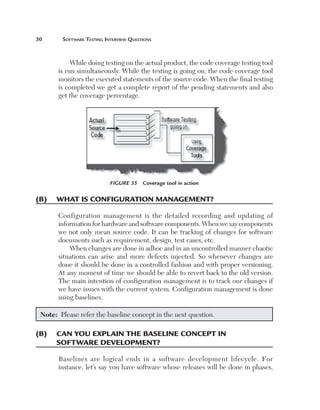
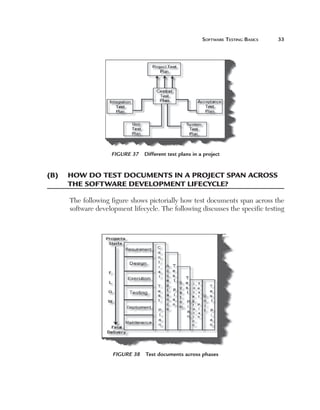
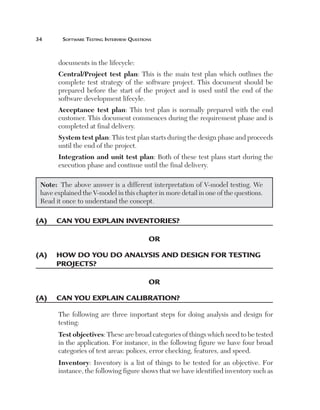
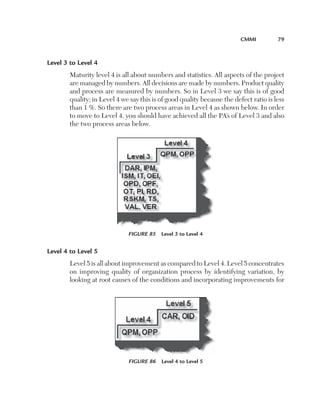
The first step in FPA is to define the boundary. There are two types of major
boundaries:
n Internal Application Boundary
n External Application Boundary
We will give the features of external application boundaries and the
internal application boundaries will be obvious.
The external application boundary can be identified using the following
litmus test:
n D
oes it have or will it have any other interface to maintain
its data, which was not developed by you?. Example: Your](https://image.slidesharecdn.com/1934015245-120223141926-phpapp01/85/1934015245-175-320.jpg)
![teSting eStimation 181
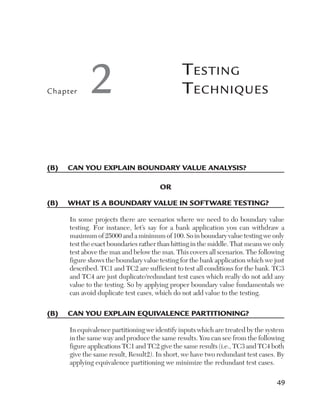
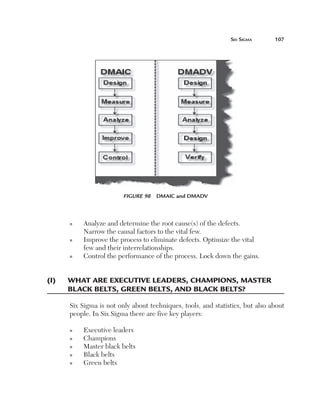
Total Function points 5 [UFPB 1 ADD 1 CHGA]2[CHGB2DELFP]
UFPB: Function points previously counted before enhancement.
ADD: Newly dded functionality which leads to new function points after
a
enhancements.
CHGA: Changed function points counted after enhancements.
CHGB: Changed function points before enhancements.
DELFP: Deleted function points.
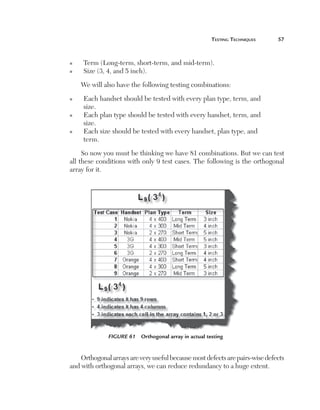
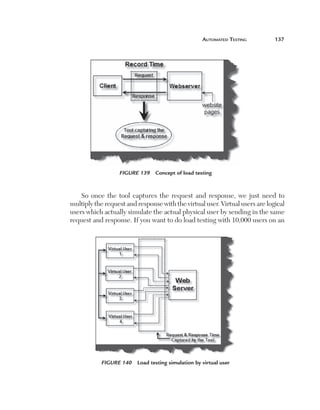
(a) an you explain hoW tpa Works?
c
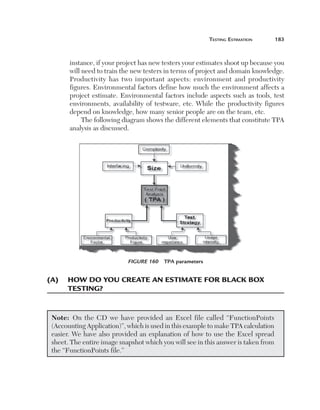
There are three main elements which determine estimates for black box
testing: size, test strategy, and productivity. Using all three elements we can
determine the estimate for black box testing for a given project. Let’s take a
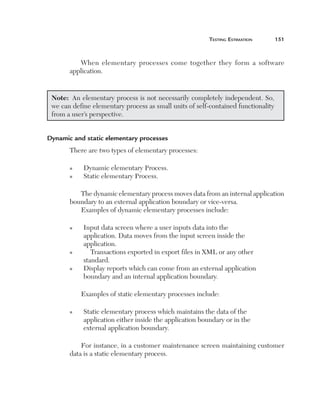
look at these elements.
Size: The most important aspect of estimating is definitely the size of the
project. The size of a project is mainly defined by the number of function
points. But a function point fails or pays the least attention to the following
factors:
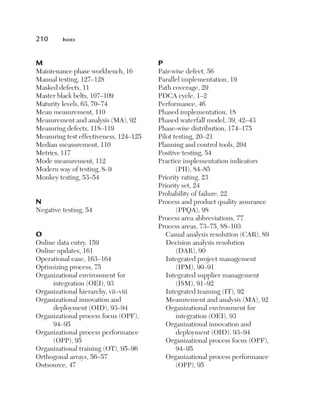
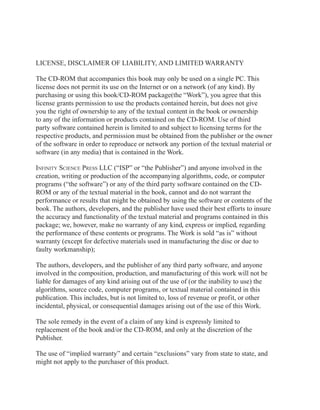
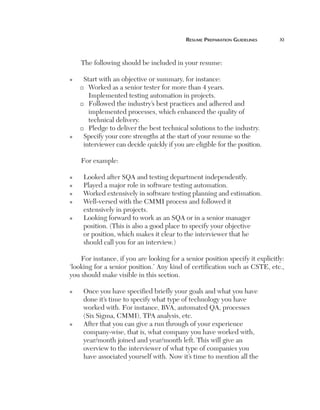
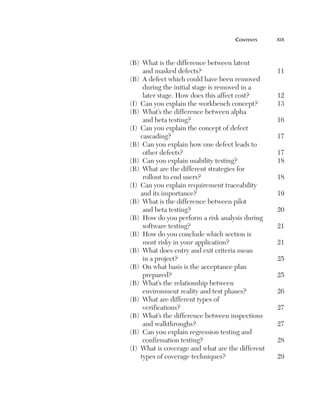
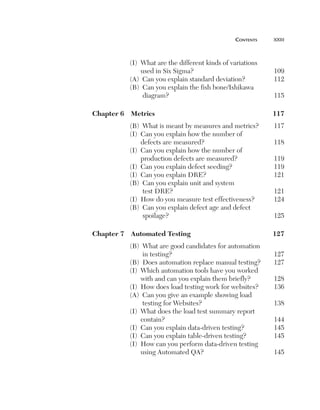
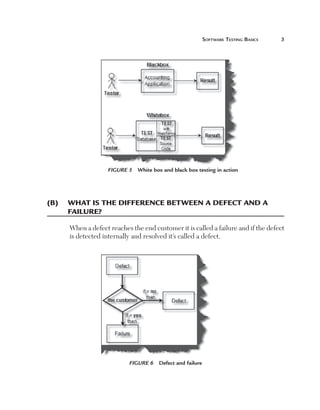
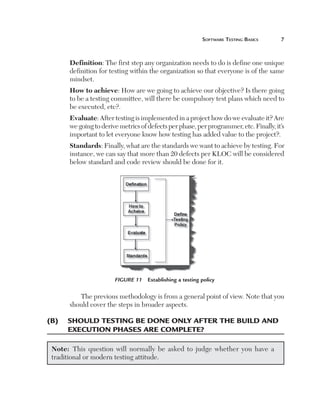
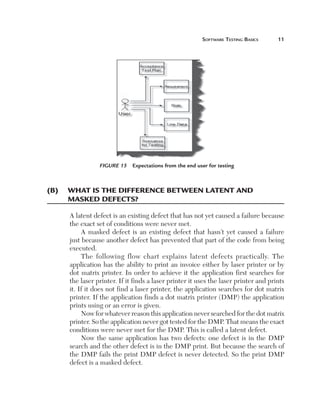
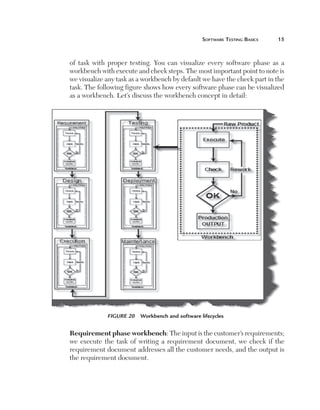
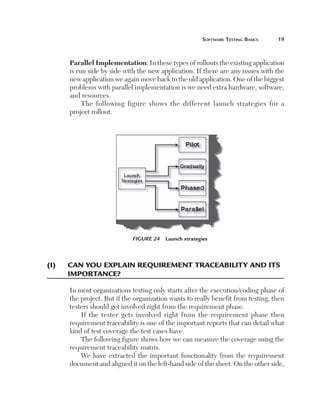
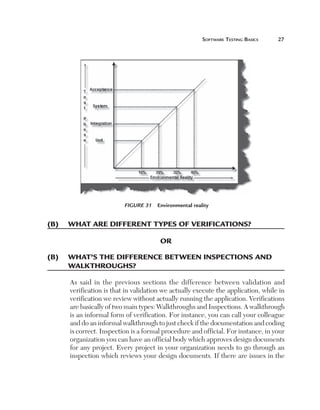
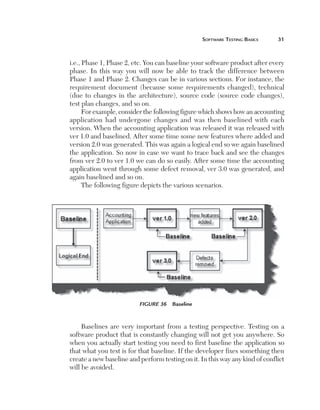
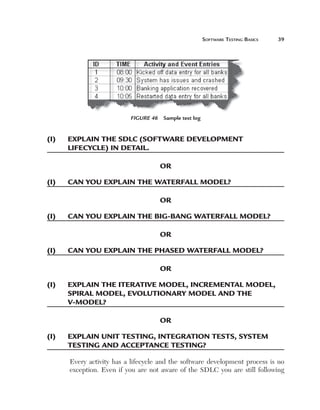
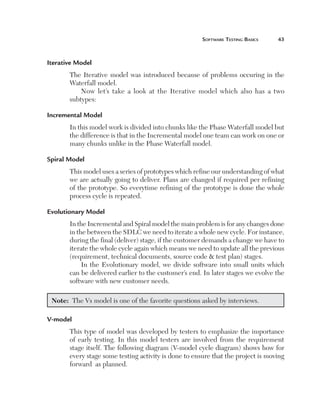
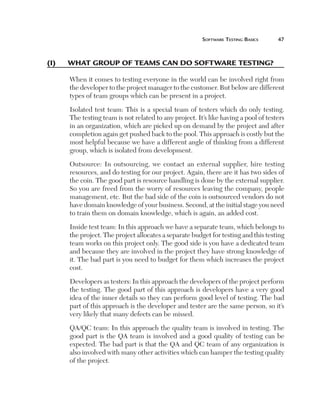
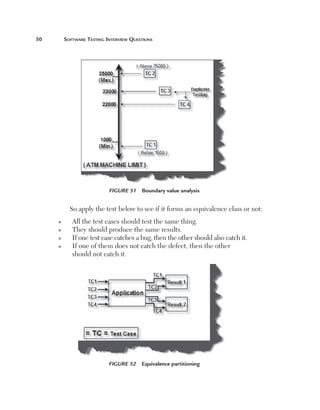
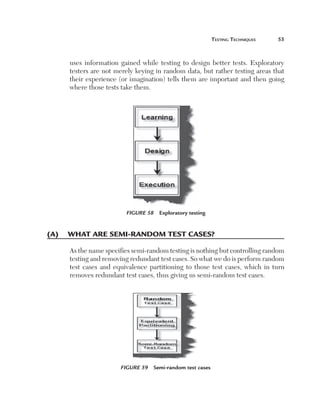
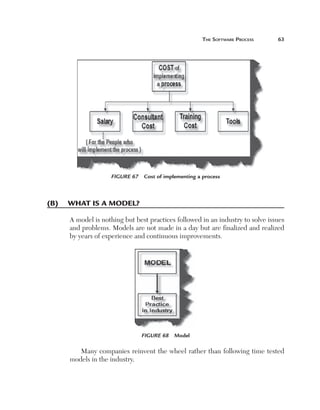
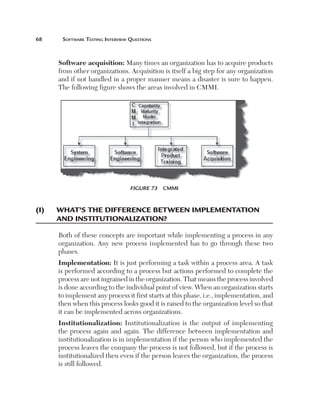
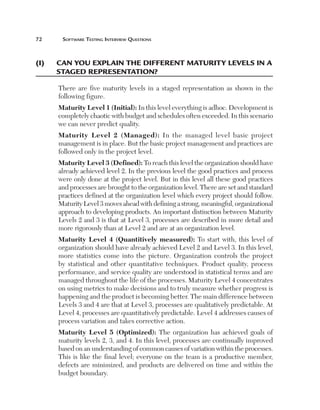
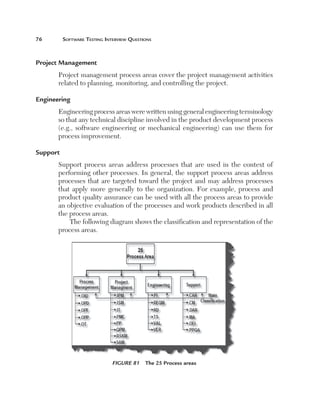
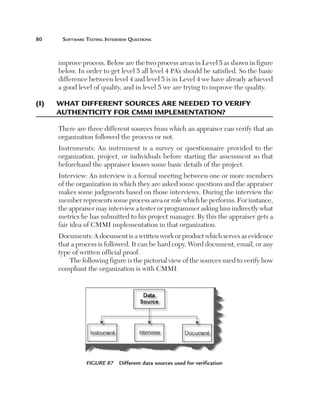
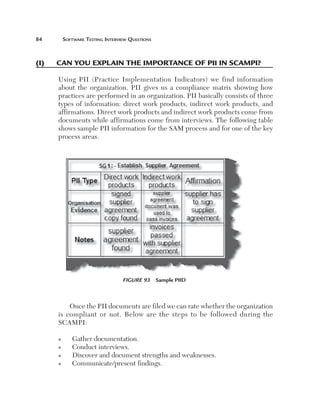
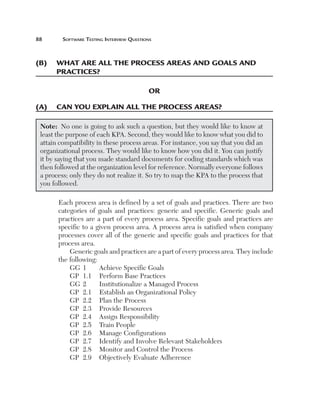
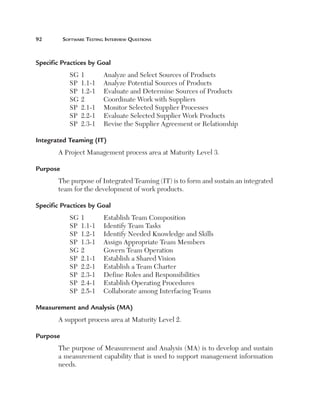
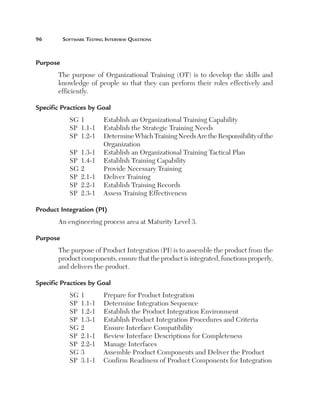
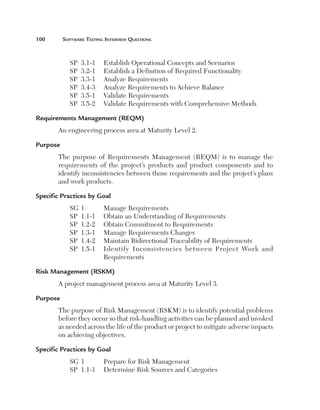
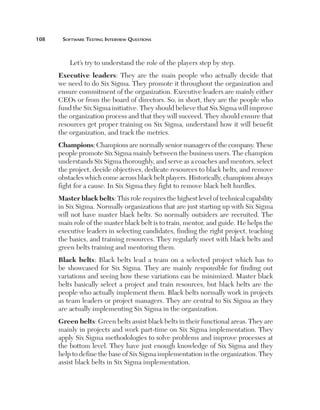
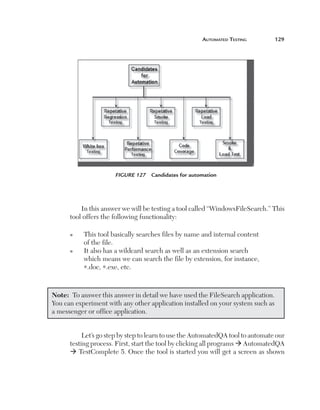
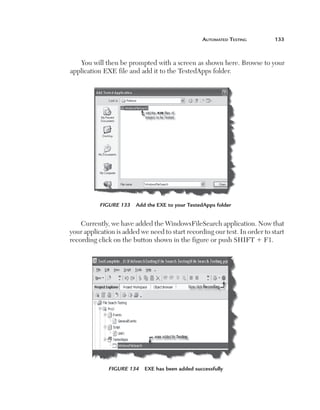
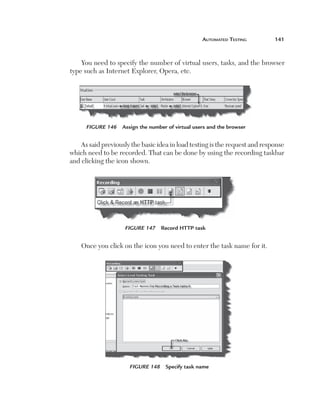
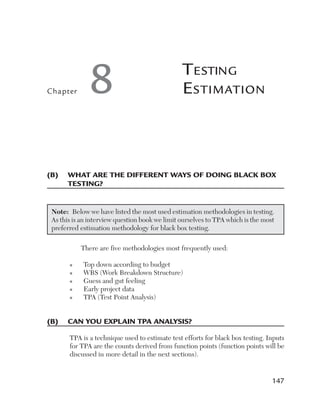
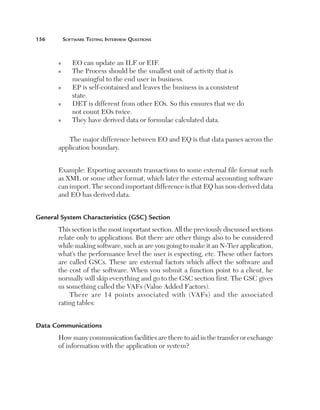
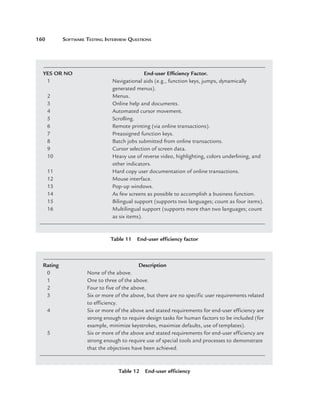
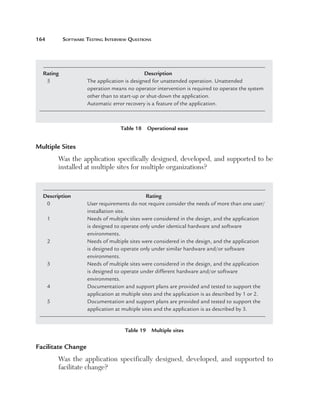
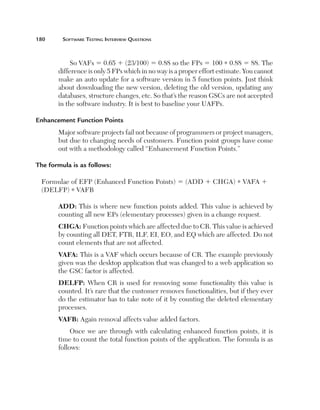
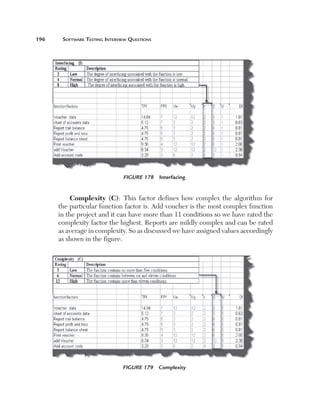
n Complexity: Complexity defines how many conditions exist
in function points identified during a project. More conditions
means more test cases which means more testing estimates.
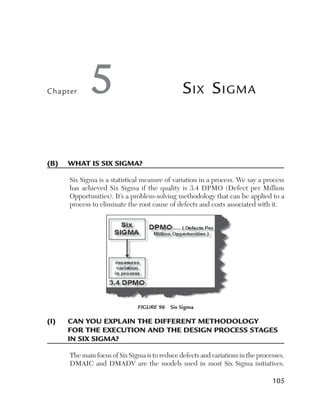
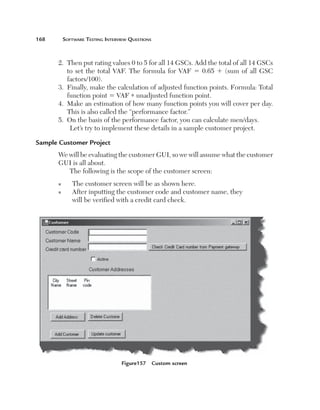
For instance, the following is an application which takes the
customer name from the end user. If the customer name is
greater than 20 characters then the application should give
an error. So for this case there will be one test case. But let’s
say the end user also puts one more condition that if the user
inputs any invalid character then the application should give
an error. Because there is one more extra condition in the
project the complexity has increased, which also means that
we need to test two cases. The following illustrates this figure.](https://image.slidesharecdn.com/1934015245-120223141926-phpapp01/85/1934015245-207-320.jpg)
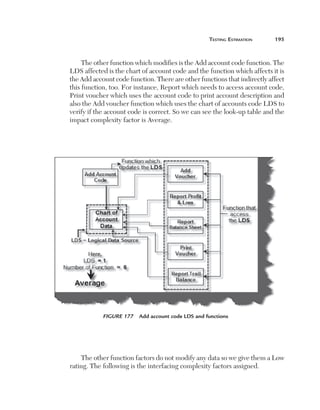
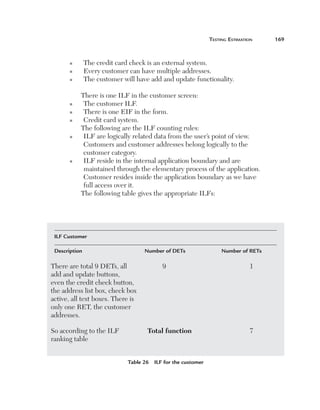
![teSting eStimation 197
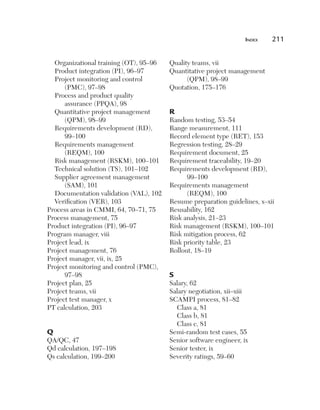
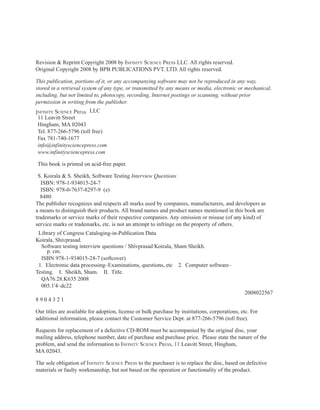
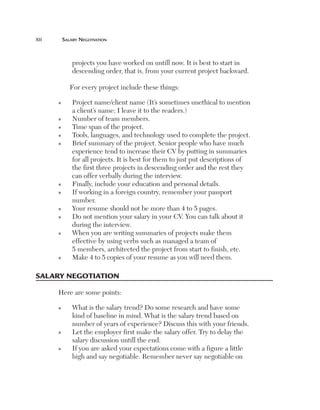
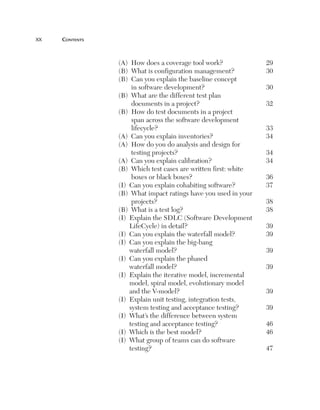
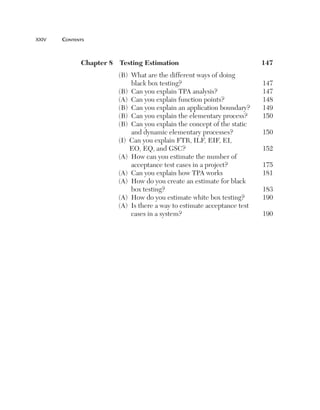
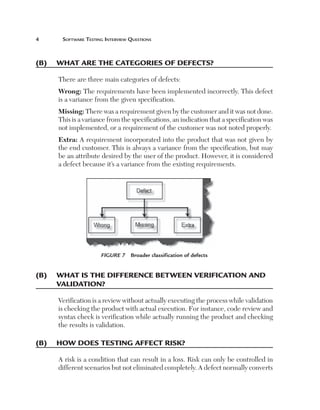
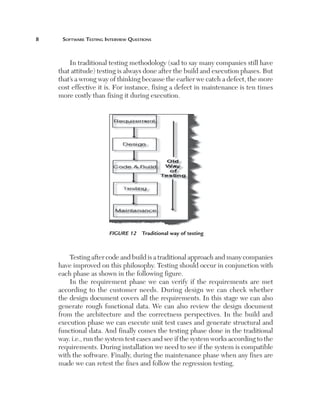
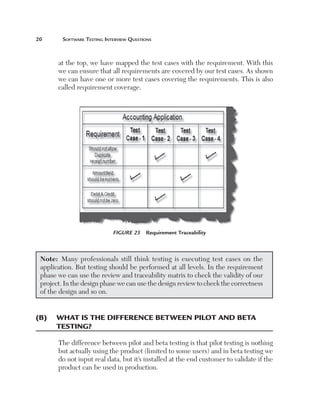
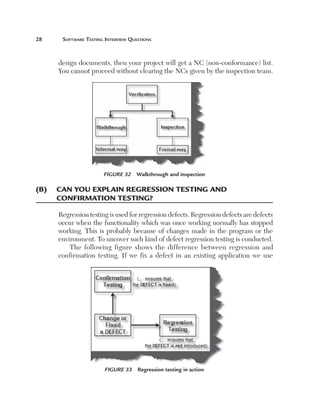
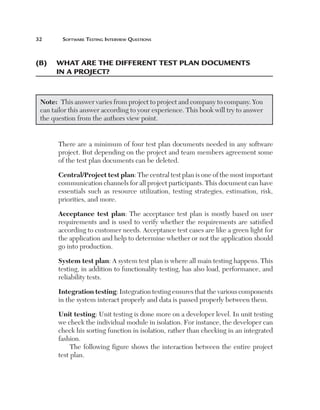
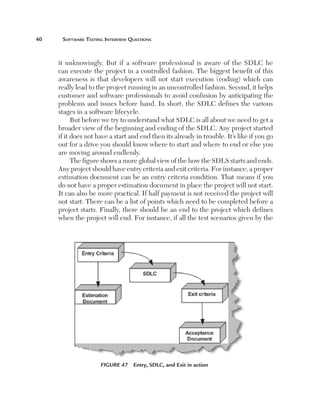
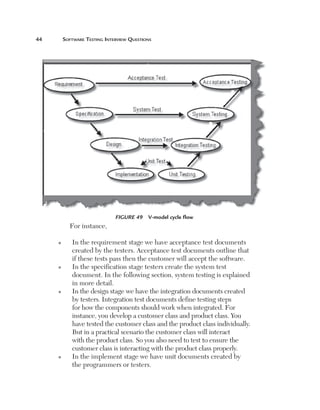
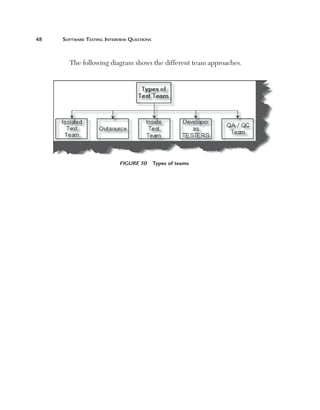
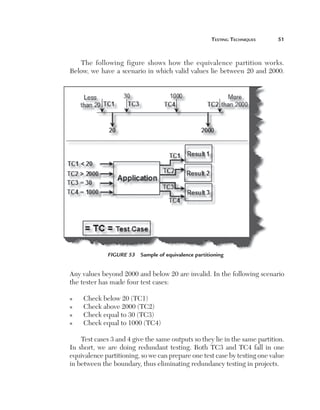
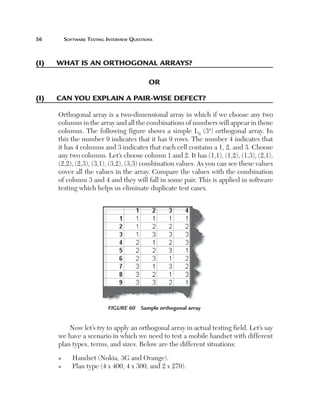
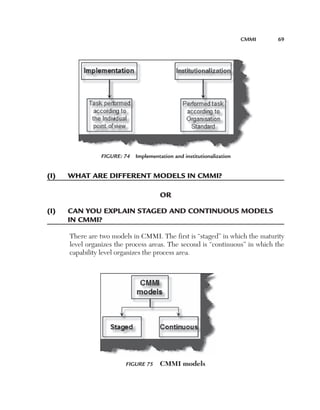
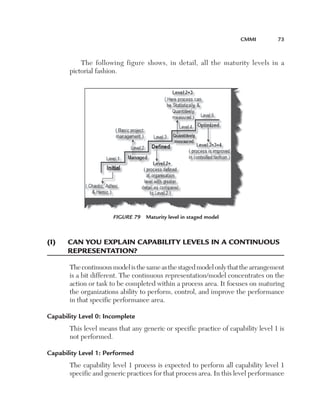
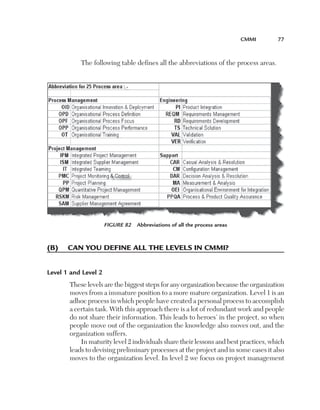
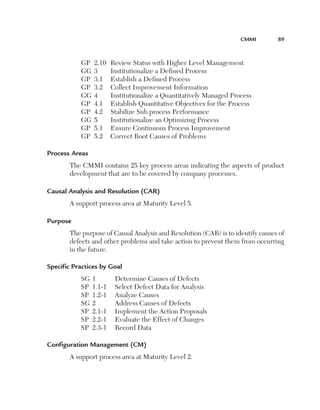
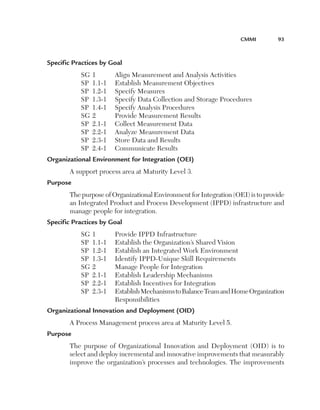
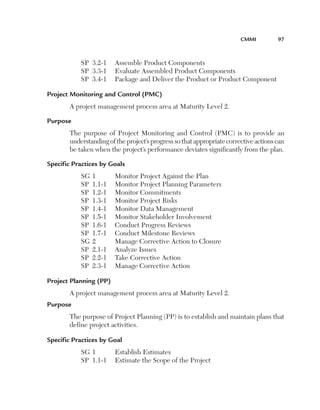
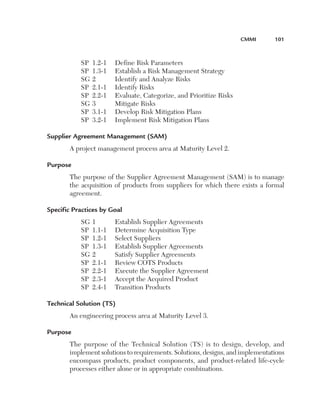
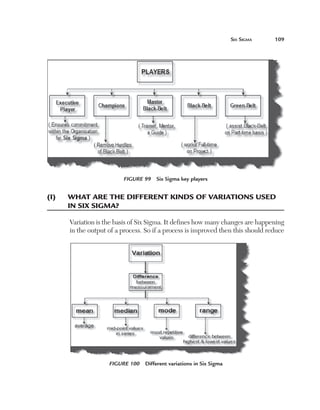
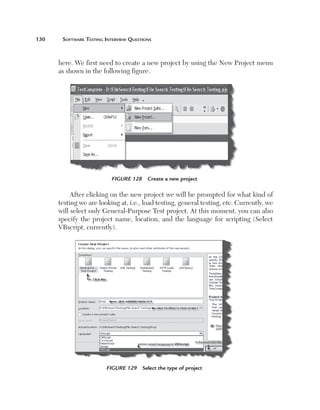
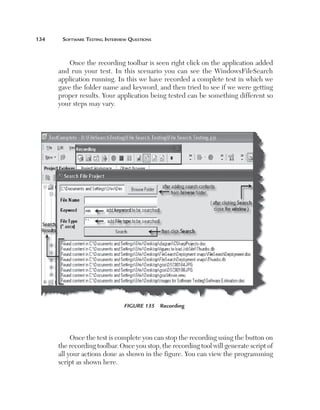
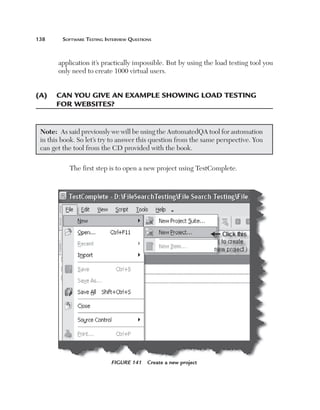
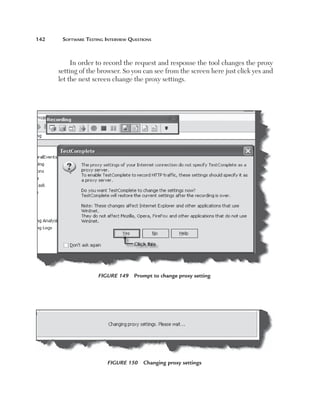
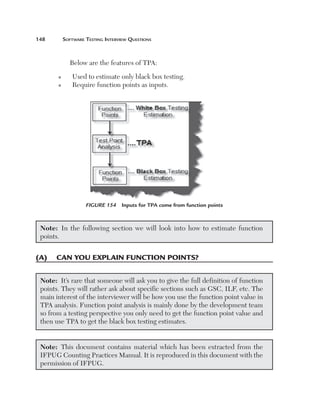
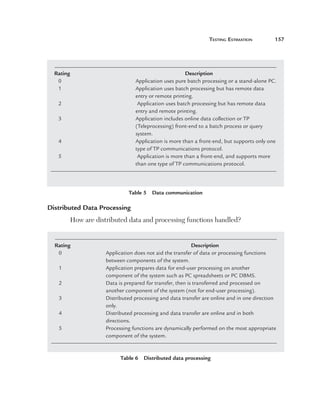
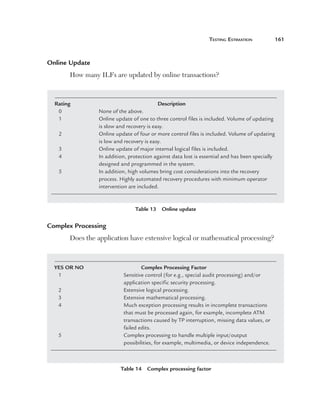
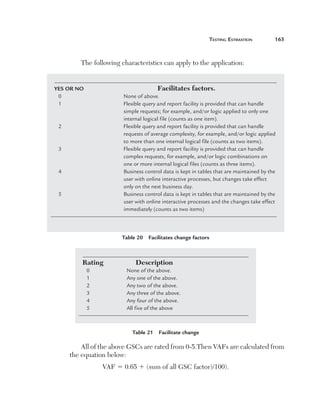
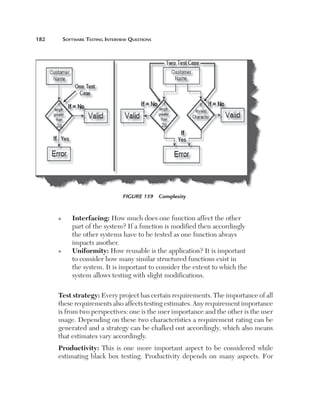
Uniformity (U): This factor defines how reusable a system is. For
instance, if a test case written for one function can be applied again then
it affects the testing estimates accordingly. Currently, for this project, we
have taken a uniformity factor of 1. So, for example, if the customer had a
requirement to also update the accounts code then we could have used two
functions, Add voucher and Update voucher.
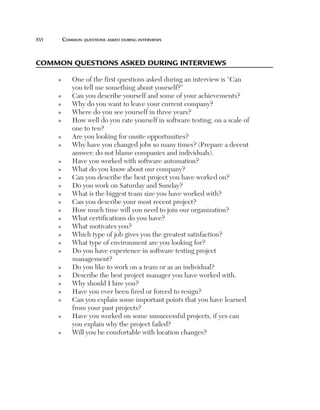
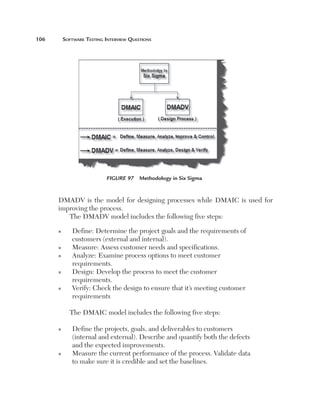
Figure 180 Uniformity
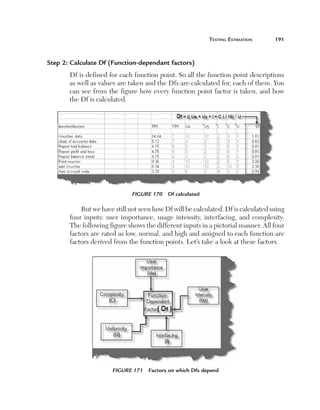
One we have all the five factors we apply the following formula to calculate
Df for all the function factors:
Df 5 [(Ue 1 Uy 1 I 1 C)/16] * U
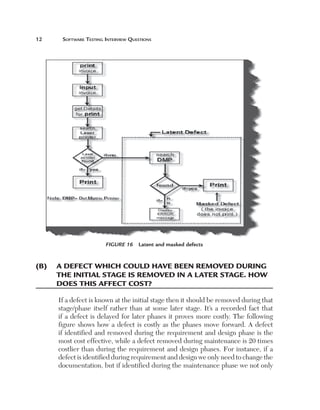
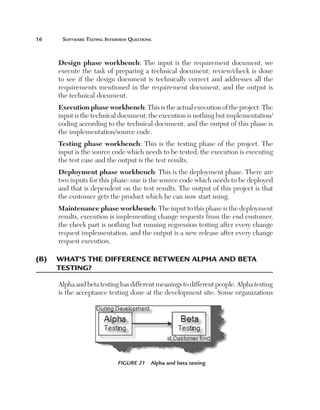
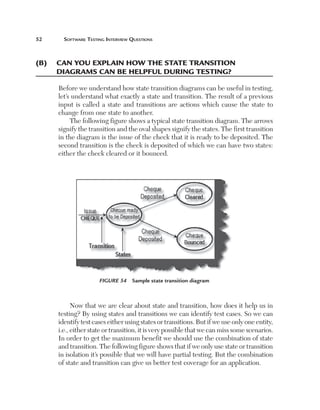
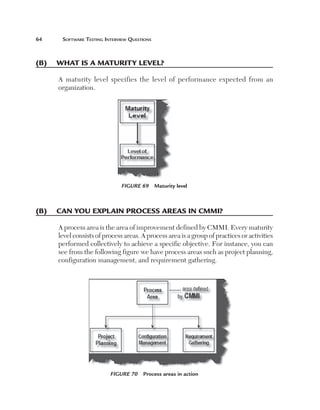
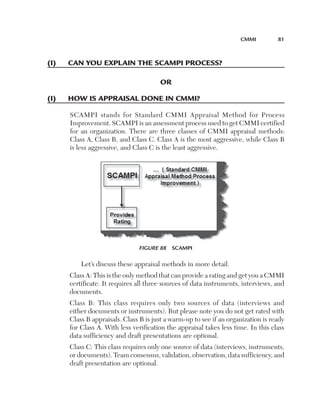
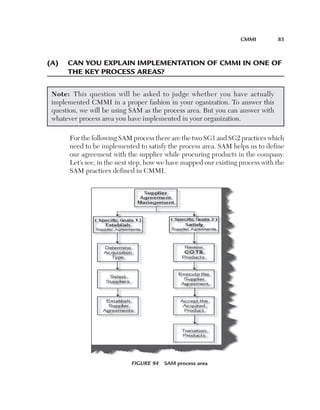
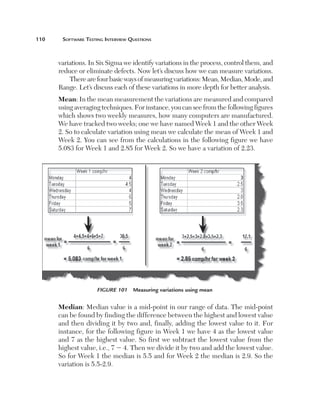
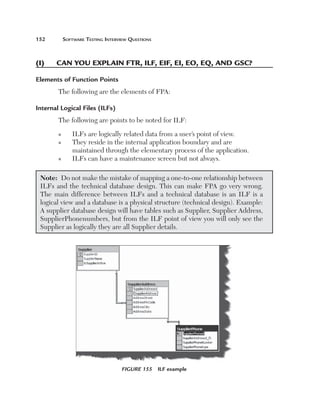
Step 3: Calculate Qd
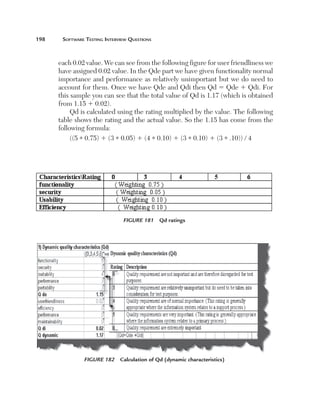
The third step is to calculate Qd. Qd, i.e, dynamic quality characteristics, have
two parts: explicit characteristics (Qde) and implicit characteristics (Qdi).
Qde has five important characteristics: Functionality, Security, Suitability,
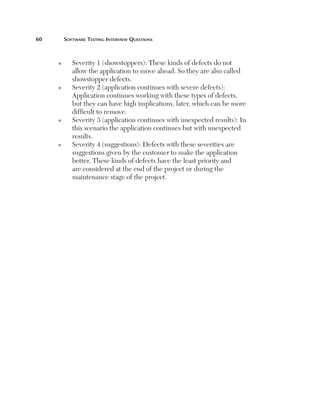
Performance, and Portability. The following diagram shows how we rate those
ratings. Qdi defines the implicit characteristic part of the Qd. These are not
standard and vary from project to project. For instance, we have identified
for this accounting application four characteristics: user friendly, efficiency,
performance, and maintainability. From these four characteristics we assign](https://image.slidesharecdn.com/1934015245-120223141926-phpapp01/85/1934015245-223-320.jpg)