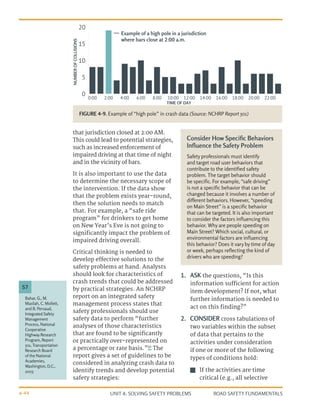
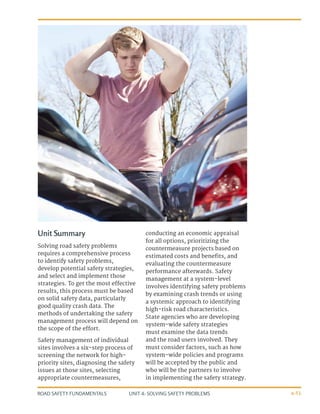
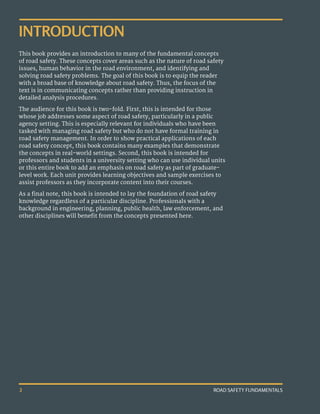
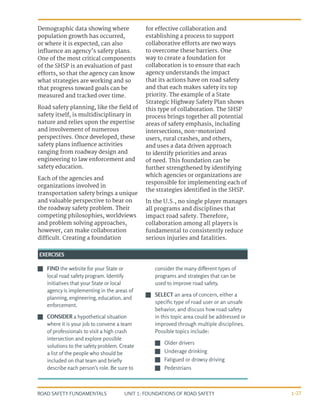
This document provides an introduction to road safety fundamentals. It discusses how road safety is an important public health issue, as motor vehicle crashes kill over 1 million people worldwide each year. In the U.S., around 37,000 people are killed in crashes annually. The document defines key road safety terms and metrics used to measure safety such as crash frequency, rates, outcomes, and surrogate safety measures. It also distinguishes between nominal and substantive safety, and how both are important when evaluating roadway design. Improving road safety requires a comprehensive approach across many disciplines.


![UNIT 4: SOLVING SAFETY PROBLEMS
ROAD SAFETY FUNDAMENTALS 4-13
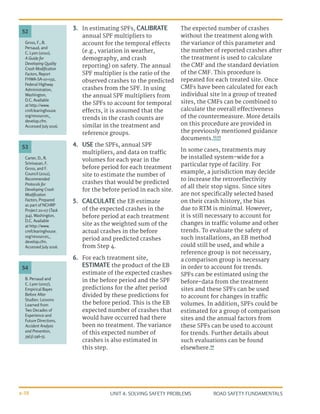
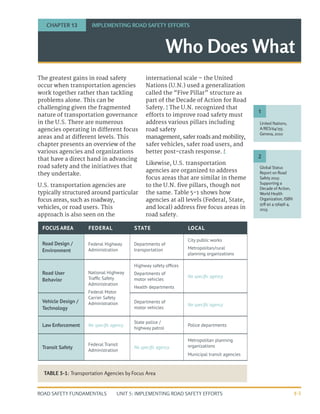
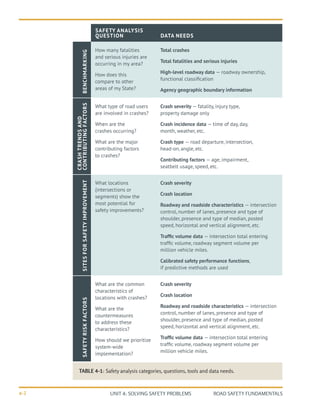
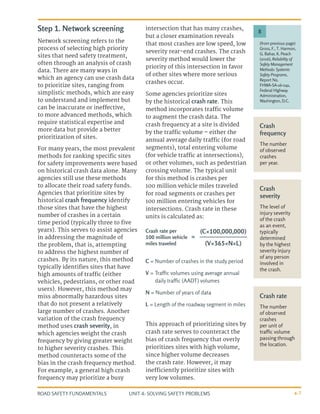
on high short-term average crash
history, crashes at those sites may
be lower in the following years due
to RTM, even if the agency does not
install countermeasures at those
sites.
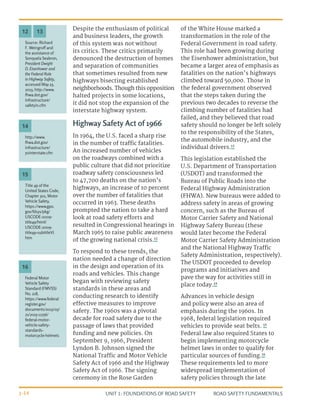
If RTM is not properly accounted for,
sites with a randomly high count
of crashes in the short term could
be incorrectly identified as having
a high potential for improvement,
and vice versa. In this case, scarce
resources may be inefficiently used
on such sites while sites with a truly
high potential for cost effective
safety improvement remain
unidentified.
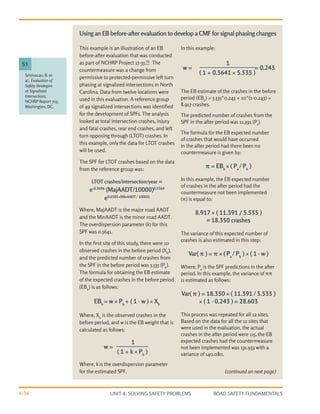
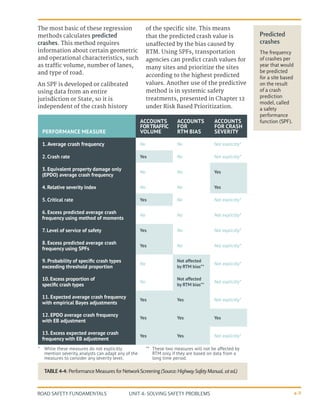
One approach to address RTM bias
is to use the EB method. The EB
method is a statistical method
that combines the observed crash
frequency (obtained from crash
reports) with the predicted crash
frequency (derived from the
appropriate SPF) to calculate the
expected crash frequency for a site of
interest. This method pulls the crash
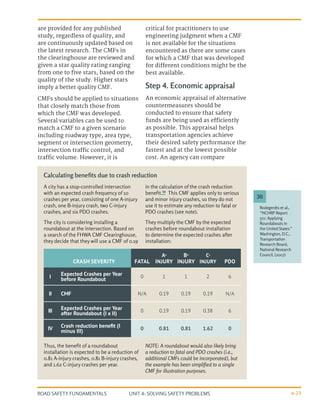
count towards the mean, accounting
for the RTM bias.
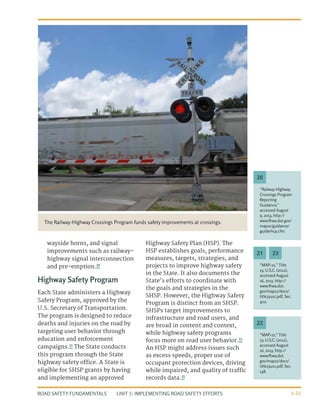
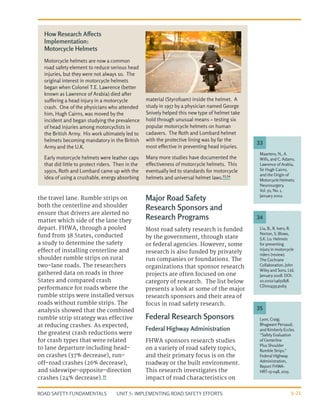
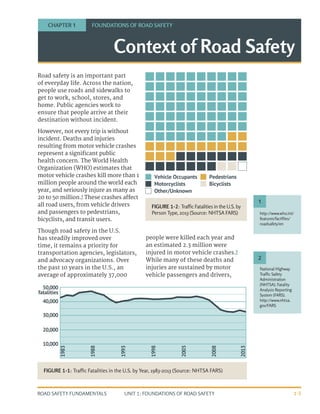
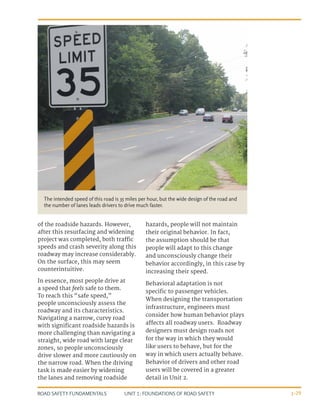
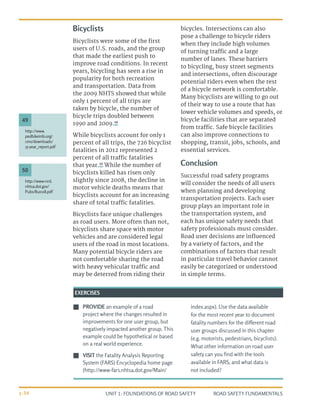
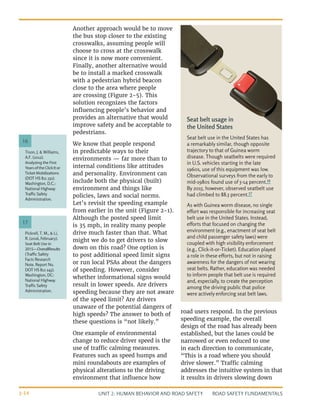
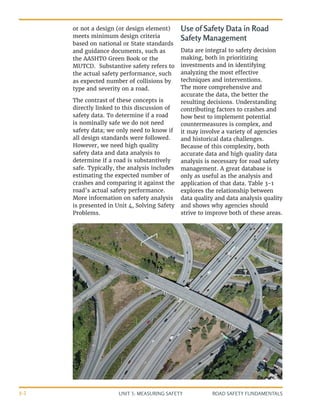
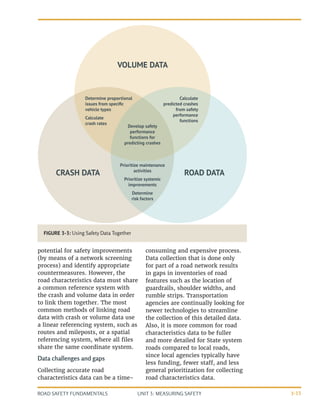
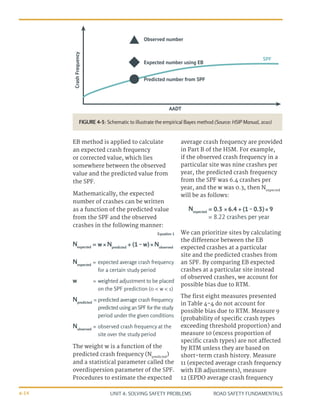
The EB method is illustrated in
Figure 4-5, which illustrates how
the observed crash frequency is
combined with the predicted crash
frequency based on the SPF.18
The
Bauer and Harwood17
provide a more
complex SPF for fatal and injury crashes on
rural two lane roads. This model provides
a crash prediction that is more tailored to
characteristics of the site, such as curve
radius and vertical grade of the road:
NFI
= fatal-and-injury crashes
per mile per year
AADT = annual average daily traffic
(vehicles/day)
G = absolute value of percent grade; 0%
for level tangents; ≥ 1% otherwise
R = curveradius(ft);missingfortangents
IHC
= horizontal curve indicator:
1 for horizontal curves; 0 otherwise
LC
= horizontal curve length (mi);
not applicable for tangents
ln = natural logarithm function
Bauer, K. and
Harwood, D., Safety
Effects of Horizontal
Curve and Grade
Combinations on
Two-Lane Highways,
Federal Highway
Administration,
Report No. FHWA-
HRT-13-077, January
2014.
Susan Herbel,
Lorrie Laing,
Colleen McGovern
(2010), Highway
Safety Improvement
Program (HSIP)
Manual, FHWA-
SA-09-029,
Federal Highway
Administration,
Washington, DC.
17
18
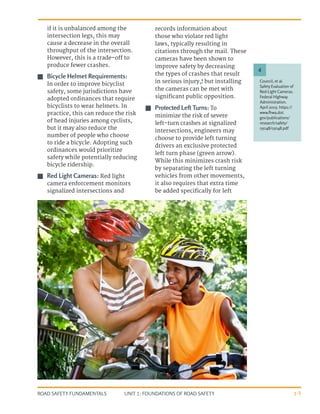
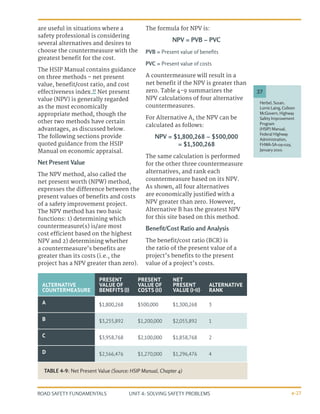
SPF Example 2
Observed
Crash
Frequency
Years
Short Term
average
Short Term
average
Long Term
average
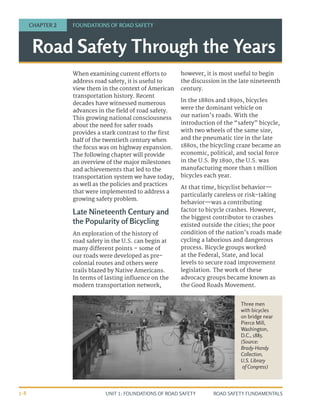
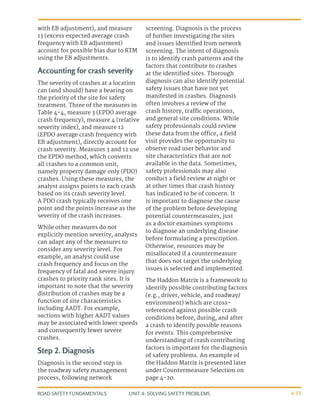
FIGURE 4-4: Chart to illustrate RTM phenomenon (Source: HSIP Manual, 2010)
NFI
= exp [-8.76+1.00×ln(AADT)+0.044×G+0.19×ln(2×5730/R)×IHC
+4.52×(1/R)(1/Lc
)×IHC
]](https://image.slidesharecdn.com/roadsafetyfundamentals-220212212204/85/Road-safety-fundamentals-111-320.jpg)

![UNIT 4: SOLVING SAFETY PROBLEMS
ROAD SAFETY FUNDAMENTALS 4-33
that the comparison is between two
distinct groups of sites. As such,
the observed difference in crash
experience can be due to known or
unknown factors, other than the
feature of interest. Known factors,
such as traffic volume or geometric
characteristics, can be controlled
for in principle by estimating a
multiple variable regression model
and inferring the CMF for a feature
from its coefficient. However, the
issue is not completely resolved
since it is difficult to properly
account for unknown, or known
but unmeasured, factors. For
these reasons, caution needs to
be exercised in making inferences
about CMFs derived from cross-
sectional designs. Where there are
sufficient applications of a specific
countermeasure, the before-after
design is clearly preferred.”45
Gross, F., B.
Persaud, and
C. Lyon (2010),
A Guide for
Developing Quality
Crash Modification
Factors, Report
FHWA-SA-10-032,
Federal Highway
Administration,
Washington,
D.C. Available
at http://www.
cmfclearinghouse.
org/resources_
develop.cfm.
Accessed July 2016.
45
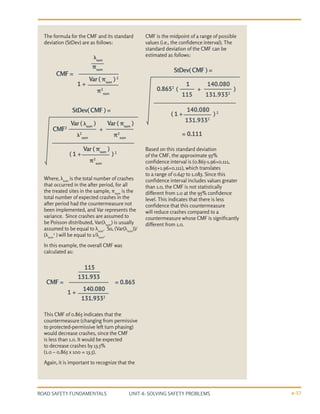
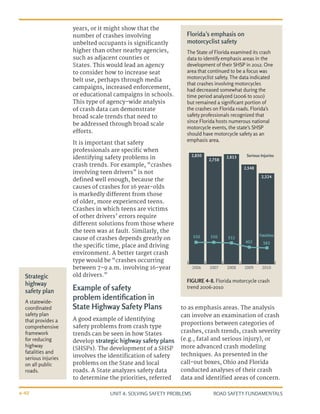
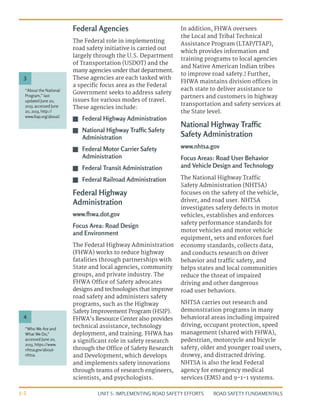
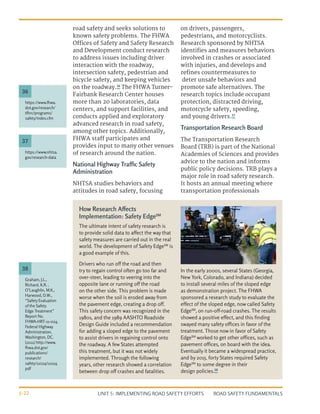
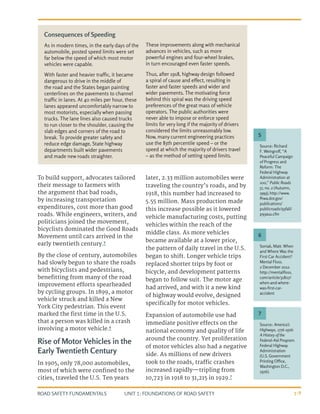
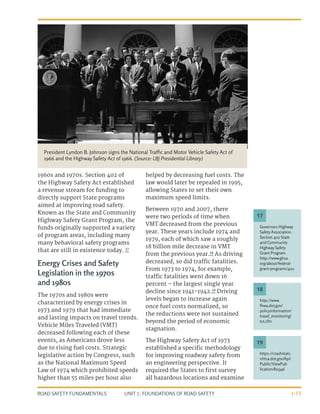
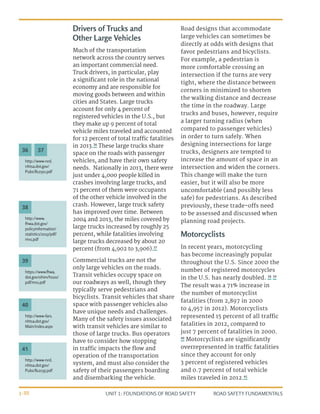
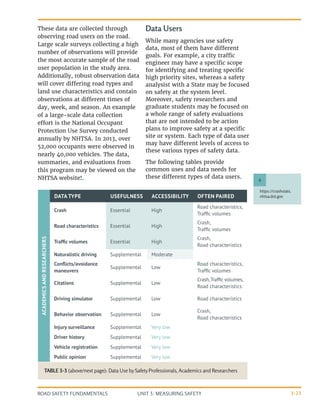
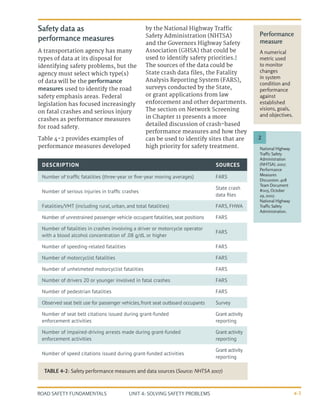
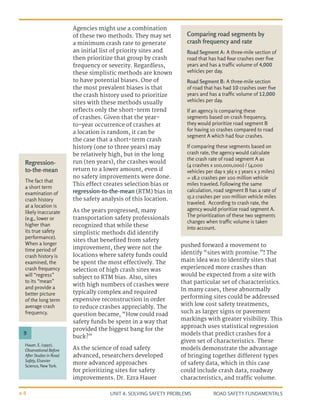
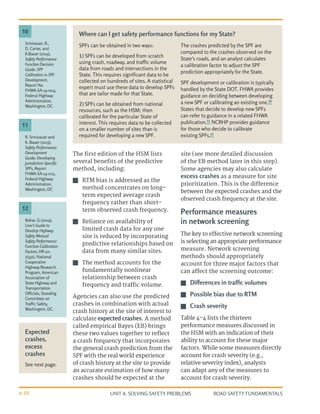
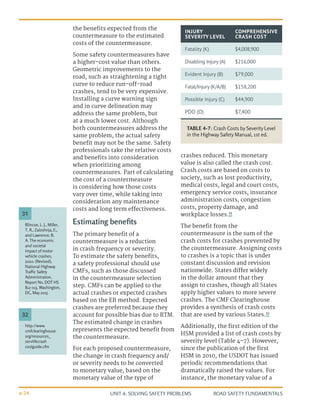
A CMF can be obtained from a cross
sectional model. Suppose the intent is
to estimate the CMF for shoulder width
based on the following SPF, which was
estimated to predict the number of crashes
per mile per year on rural two-lane roads in
mountainous roads with paved shoulders
(Appendix B of Srinivasan and Carter, 201144
):
Where, AADT is the annual average daily
traffic and SW is the width of the paved
shoulder in feet. If the intent is to estimate
the CMF of changing the shoulder width
from three to six feet, then the CMF can
be estimated as the ratio of the predicted
number of crashes when the shoulder
width is six feet to the predicted number
of crashes when the shoulder width is
three feet:
This ratio simplifies to:
CMF = exp [-0.0164 × (6-3) ] = 0.952
This CMF of 0.952 indicates that changing
the shoulder width from three to six feet
would be expected to reduce crashes (since
the CMF is less than 1.0). Specifically, the
expected change in crashes would be a
4.8% reduction (1.0 – 0.952 x 100 = 4.8).
However, it is important to recognize that
this CMF of 0.952 is the midpoint in a range
of possible values (i.e., the confidence
interval). This range can be calculated by
using the standard deviation of the CMF. In
order to estimate the standard deviation,
the standard error of the coefficient of SW
is needed, which was reported to be 0.0015
in the original study. The high and low ends
of the confidence interval are calculated
using -0.0164+0.0015, and then using
-0.0165-0.0015, and the difference between
the two is divided by two. The equation is
given below:
The approximate 95% confidence
interval for the CMF is (0.952-1.96×0.004,
0.952+1.96×0.004), which translates to a
range of 0.944 to 0.960. Since the entire 95%
confidence interval is below 1.0, the CMF is
statistically significant, thereby indicating
that widening the shoulder from three to six
feet is very likely to reduce crashes.
Srinivasan, R. and
D. Carter (2011),
Development of
Safety Performance
Functions for North
Carolina, Report
FHWA/NC/2010-
09, Submitted to
NCDOT, December
2011.
44
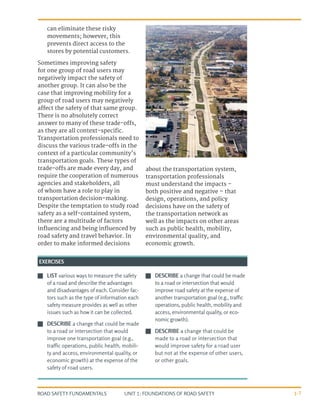
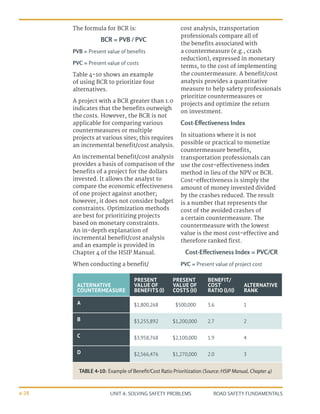
Using cross-sectional modeling to calculate a CMF for widening shoulders
Y = exp [ 0.8727 + 0.4414 × ln( ) + 0.4293 × ( ) -0.0164 × SW ]
StDev(CMF) = = 0.004
CMF=
exp [ 0.8727 + 0.4414 × ln( ) + 0.4293 × ( ) -0.0164 × 6 ]
exp [ 0.8727 + 0.4414 × ln( ) + 0.4293 × ( ) -0.0164 × 3 ]
AADT
10000
AADT
10000
AADT
10000
AADT
10000
AADT
10000
AADT
10000
exp [-0.0164+0.0015 × (6-3) ] - exp [-0.0164-0.0015 × (6-3) ]
2](https://image.slidesharecdn.com/roadsafetyfundamentals-220212212204/85/Road-safety-fundamentals-131-320.jpg)