ISMATDR : Statistics Project
•
1 like•155 views

Increase Student Math Achievement through Differentiation and Review We will present strategies that engage students in all levels of thinking and higher level questioning. Differentiated instruction in the math classroom will be highlighted as well. Two major topics will be an EOG review station plan and using cartoons to encourage reading and writing in the math content area.

Recommended
Recommended
More Related Content
More from North Carolina Association for Middle Level Education
More from North Carolina Association for Middle Level Education (20)
Recently uploaded
Recently uploaded (20)
ISMATDR : Statistics Project
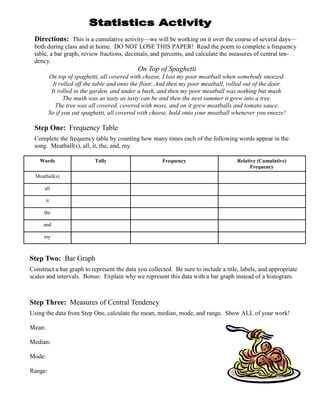
- 1. Directions: This is a cumulative activity—we will be working on it over the course of several days— both during class and at home. DO NOT LOSE THIS PAPER! Read the poem to complete a frequency table, a bar graph, review fractions, decimals, and percents, and calculate the measures of central ten- dency. On Top of Spaghetti On top of spaghetti, all covered with cheese, I lost my poor meatball when somebody sneezed. It rolled off the table and onto the floor, And then my poor meatball, rolled out of the door. It rolled in the garden, and under a bush, and then my poor meatball was nothing but mush. The mush was as tasty as tasty can be and then the next summer it grew into a tree. The tree was all covered, covered with moss, and on it grew meatballs and tomato sauce. So if you eat spaghetti, all covered with cheese, hold onto your meatball whenever you sneeze! Step One: Frequency Table Complete the frequency table by counting how many times each of the following words appear in the song. Meatball(s), all, it, the, and, my. Words Tally Frequency Relative (Cumulative) Frequency Meatball(s) all it the and my Step Two: Bar Graph Construct a bar graph to represent the data you collected. Be sure to include a title, labels, and appropriate scales and intervals. Bonus: Explain why we represent this data with a bar graph instead of a histogram. Step Three: Measures of Central Tendency Using the data from Step One, calculate the mean, median, mode, and range. Show ALL of your work! Mean: Median: Mode: Range:
- 2. Step Four: A Box and Whisker Plot Using the data from Step One, create a box and whisker plot. Use your box and whisker plot to identify the fol- lowing; Range: Minimum/Lower Extreme: 1st Quartile: Median/2nd Quartile: 3rd Quartile: Maximum/Upper Extreme: Interquartile Range: Outliers: Step Five: HomeFun Develop your own activity similar to this one. You must have at least 10 different words. (The above activity only used 6 words.) You may use a newspaper article, a poem, appropriate lyrics from a song, an advertise- ment,...be creative. You will need to complete each of the steps outlined previously with your data. Your pro- ject must include the following: 1. The source you used 2. A frequency table with tally, frequency and relative (cumulative) frequency. You must write the frequency and relative (cumulative) frequency fraction, decimal, and percent form (round to the nearest tenth.) 3. A bar graph or histogram 4. The mean, median, mode, and range of your data 5. A box and whisker plot of your data—include all required information from Step 4 You may put all your answers for your project on a poster board, create a 5 page report with a cover (each of the above on a separated page), make a mobile and hang your answers from different pieces of paper—check with me if you have another creative idea. Each part above will count as 18 points out of 100. The additional 10 points will be for neatness. This project will be due on _____________. It will count as a test grade. Please have your parents sign below. Keep the directions and return the signed portion to me tomorrow. I have read the directions for __________________________________________’s project. I understand it will count as a test grade and it is due______________________________________. ______________________________________________________ Parent Signature
- 3. Category 3 points 2 points 1 point 0 points Score Clearly identified Not Clearly Not Clearly Poem/lyrics not Labeled (author, title) identified identified included in final Poem/ Highlighted word count Not clearly labeled Not labeled product Lyrics Neat, no errors Highlighted word No highlighted count word count No errors errors Contains word frequency Contains word Contains word Frequency table Cumulative Frequency frequency frequency incomplete, Frequency Simplified Fraction Cumulative Frequency No Cumulative missing two or Table No math errors Not Simplified Frequency more Decimal equivalent Fraction Not Simplified categories and Percentage 1-2 math errors Fraction contains more Decimal equivalent 3-5 math errors than 5 Percentage Percentage mathematical errors Presents accurate Presents accurate Misleading graph Misleading graph information information Visual presentation Visual Bar Graph Visual presentation is Visual presentation is is below average presentation is accurate and exceptional adequate Scale is not ineffective Scale is reasonable Scale is reasonable reasonable Scale is not All Labels All Labels Labels missing reasonable Title Title Title Labels missing No Title Mathematically accurate Mathematically One or two More than 2 data accurate data mathematical errors mathematical Central Accurate mean, median, Accurate mean, errors Tendency mode, and range median, mode, and range Organization is less than adequate Completed neatly and Completed neatly and Completed Inaccurate accurately accurately accurately calculations Box and All data points clearly 4 of 5 data points Lack of 3 or more data Whisker labeled and accurately clearly labeled and organization points not Plot calculated accurately calculated 3 of 5 data points identified Number line is well Number line is well clearly labeled and Plot is messy and designed designed accurately inaccurately calculated completed Number line is messy Information was Information was Information was Information was Presentation organized, neat, well organized, well well presented with not well presented and accurate presented and accurate minor errors presented All requirements were Slightly messy Slightly messy Multiple errors exceeded All requirements were All but one Lacked aesthetic met requirement was appeal met More than one requirement was missing