Download to read offline


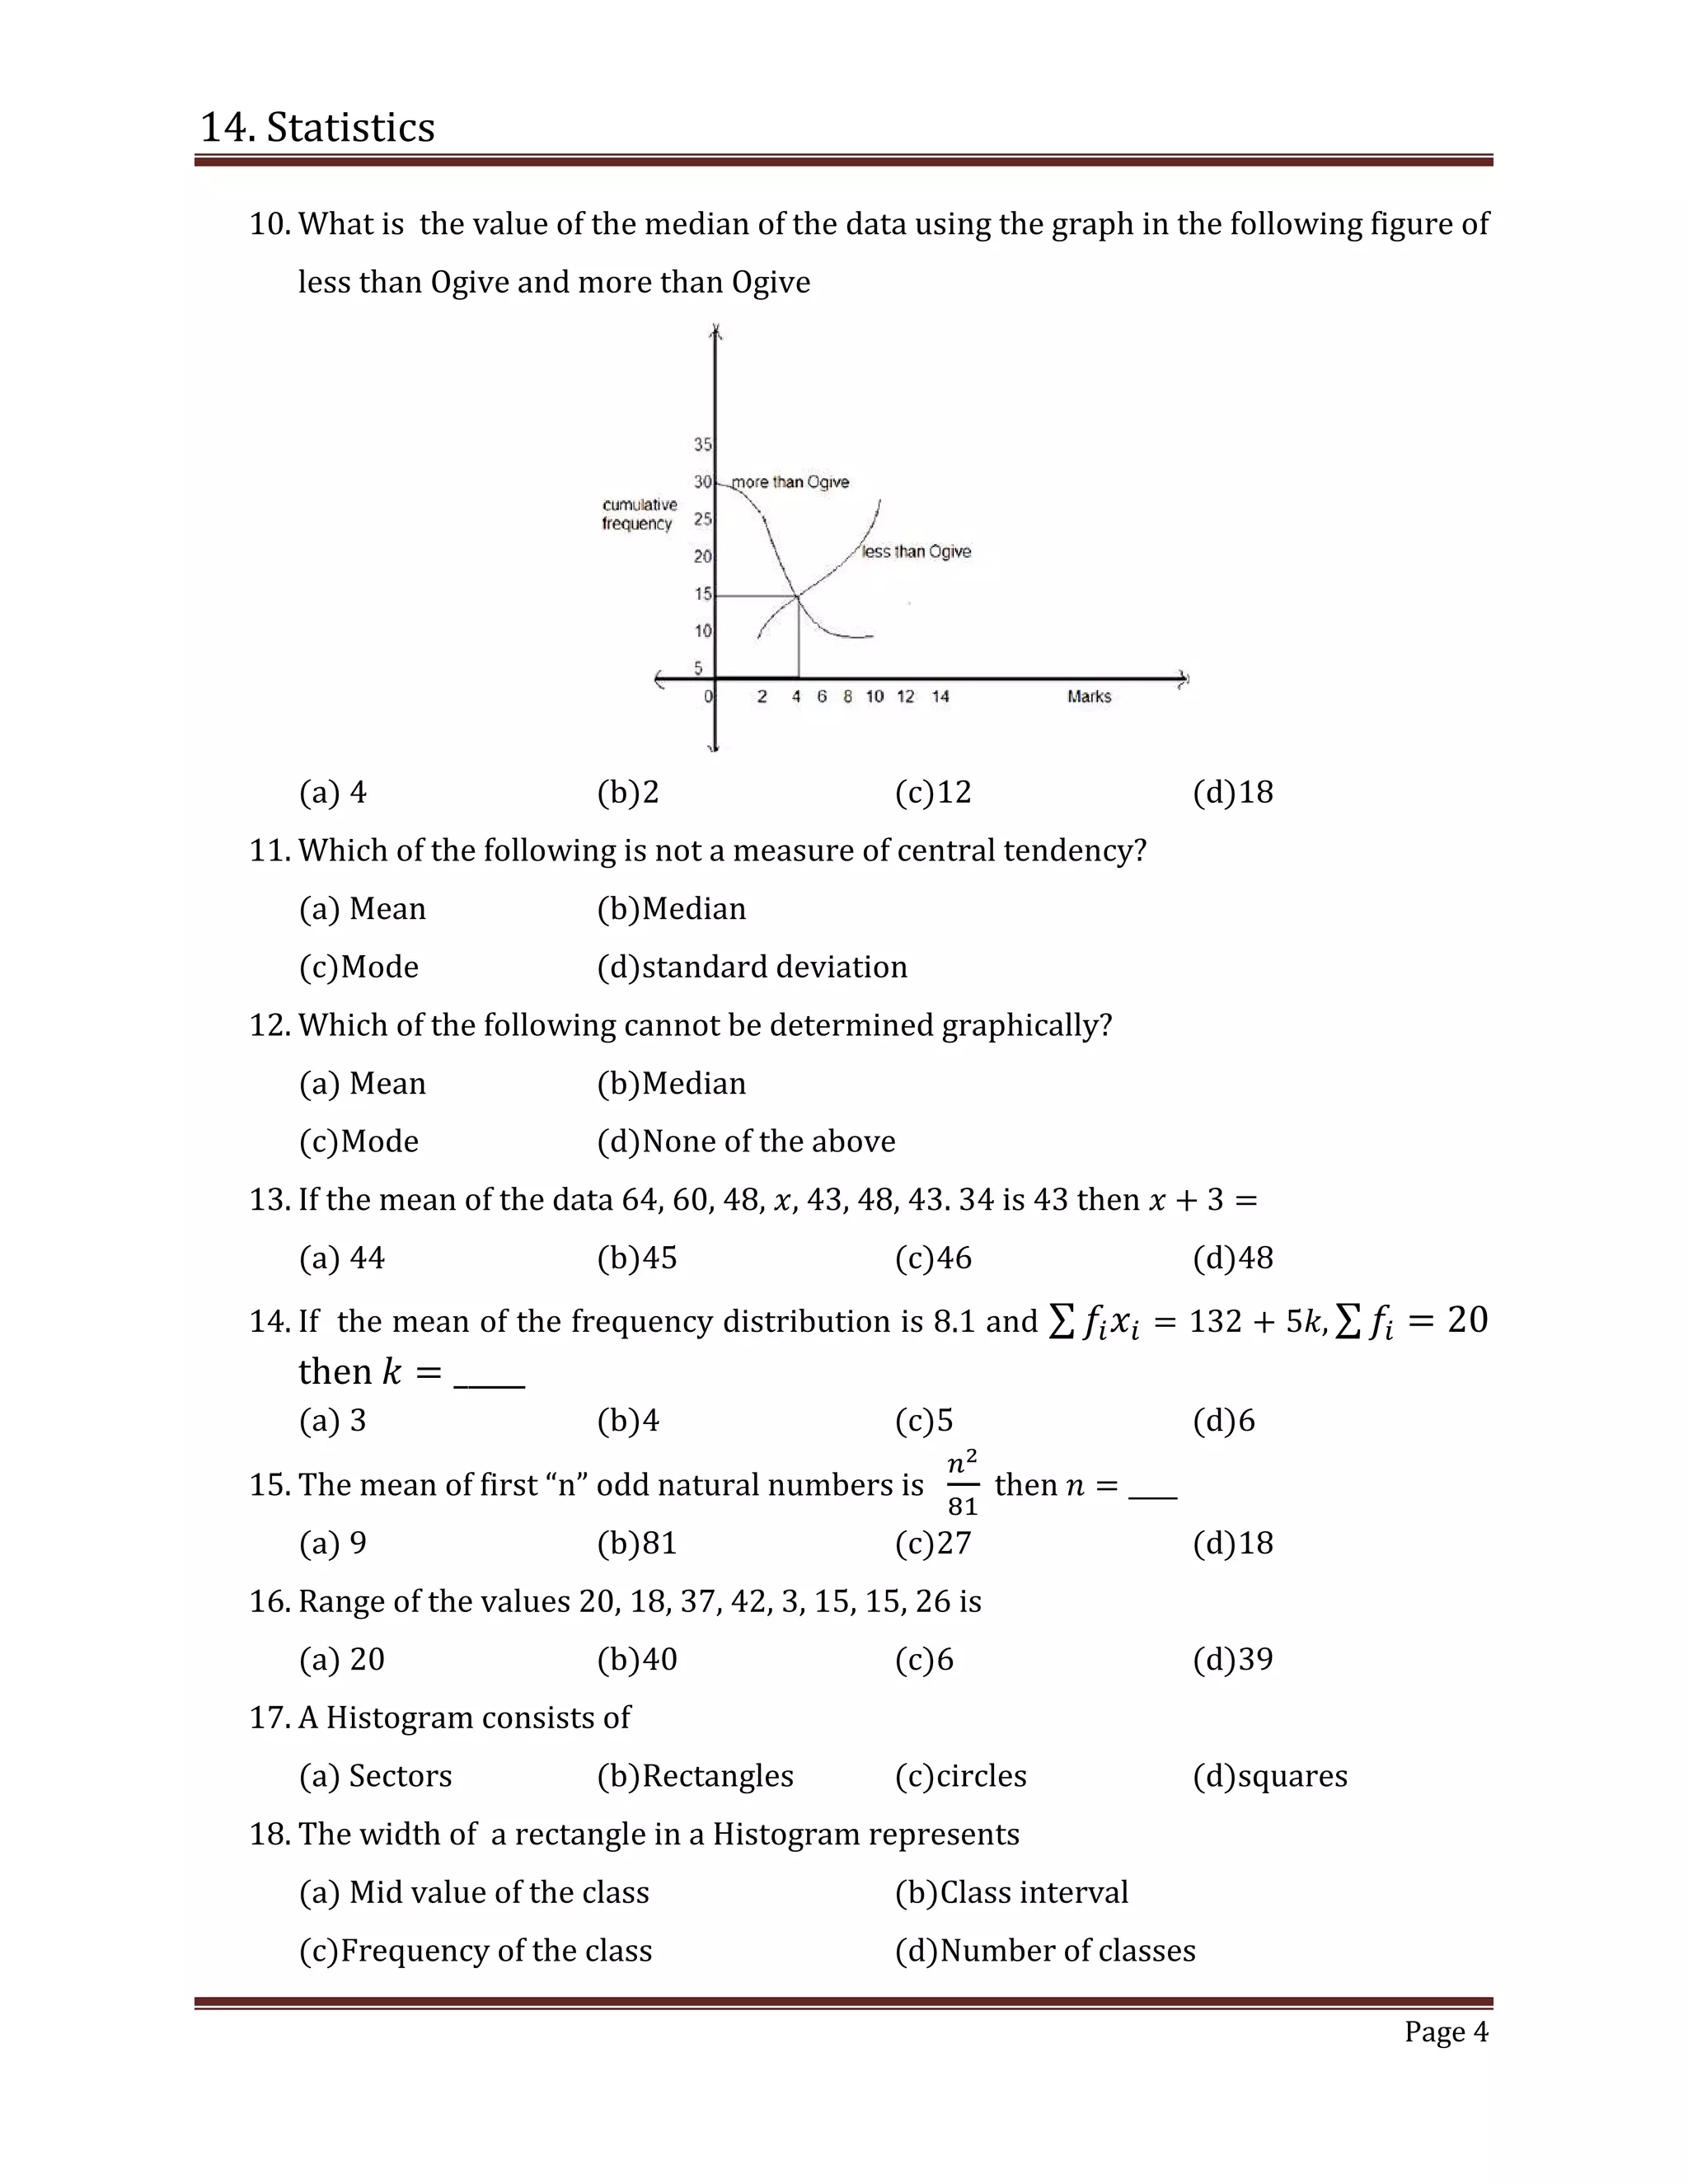


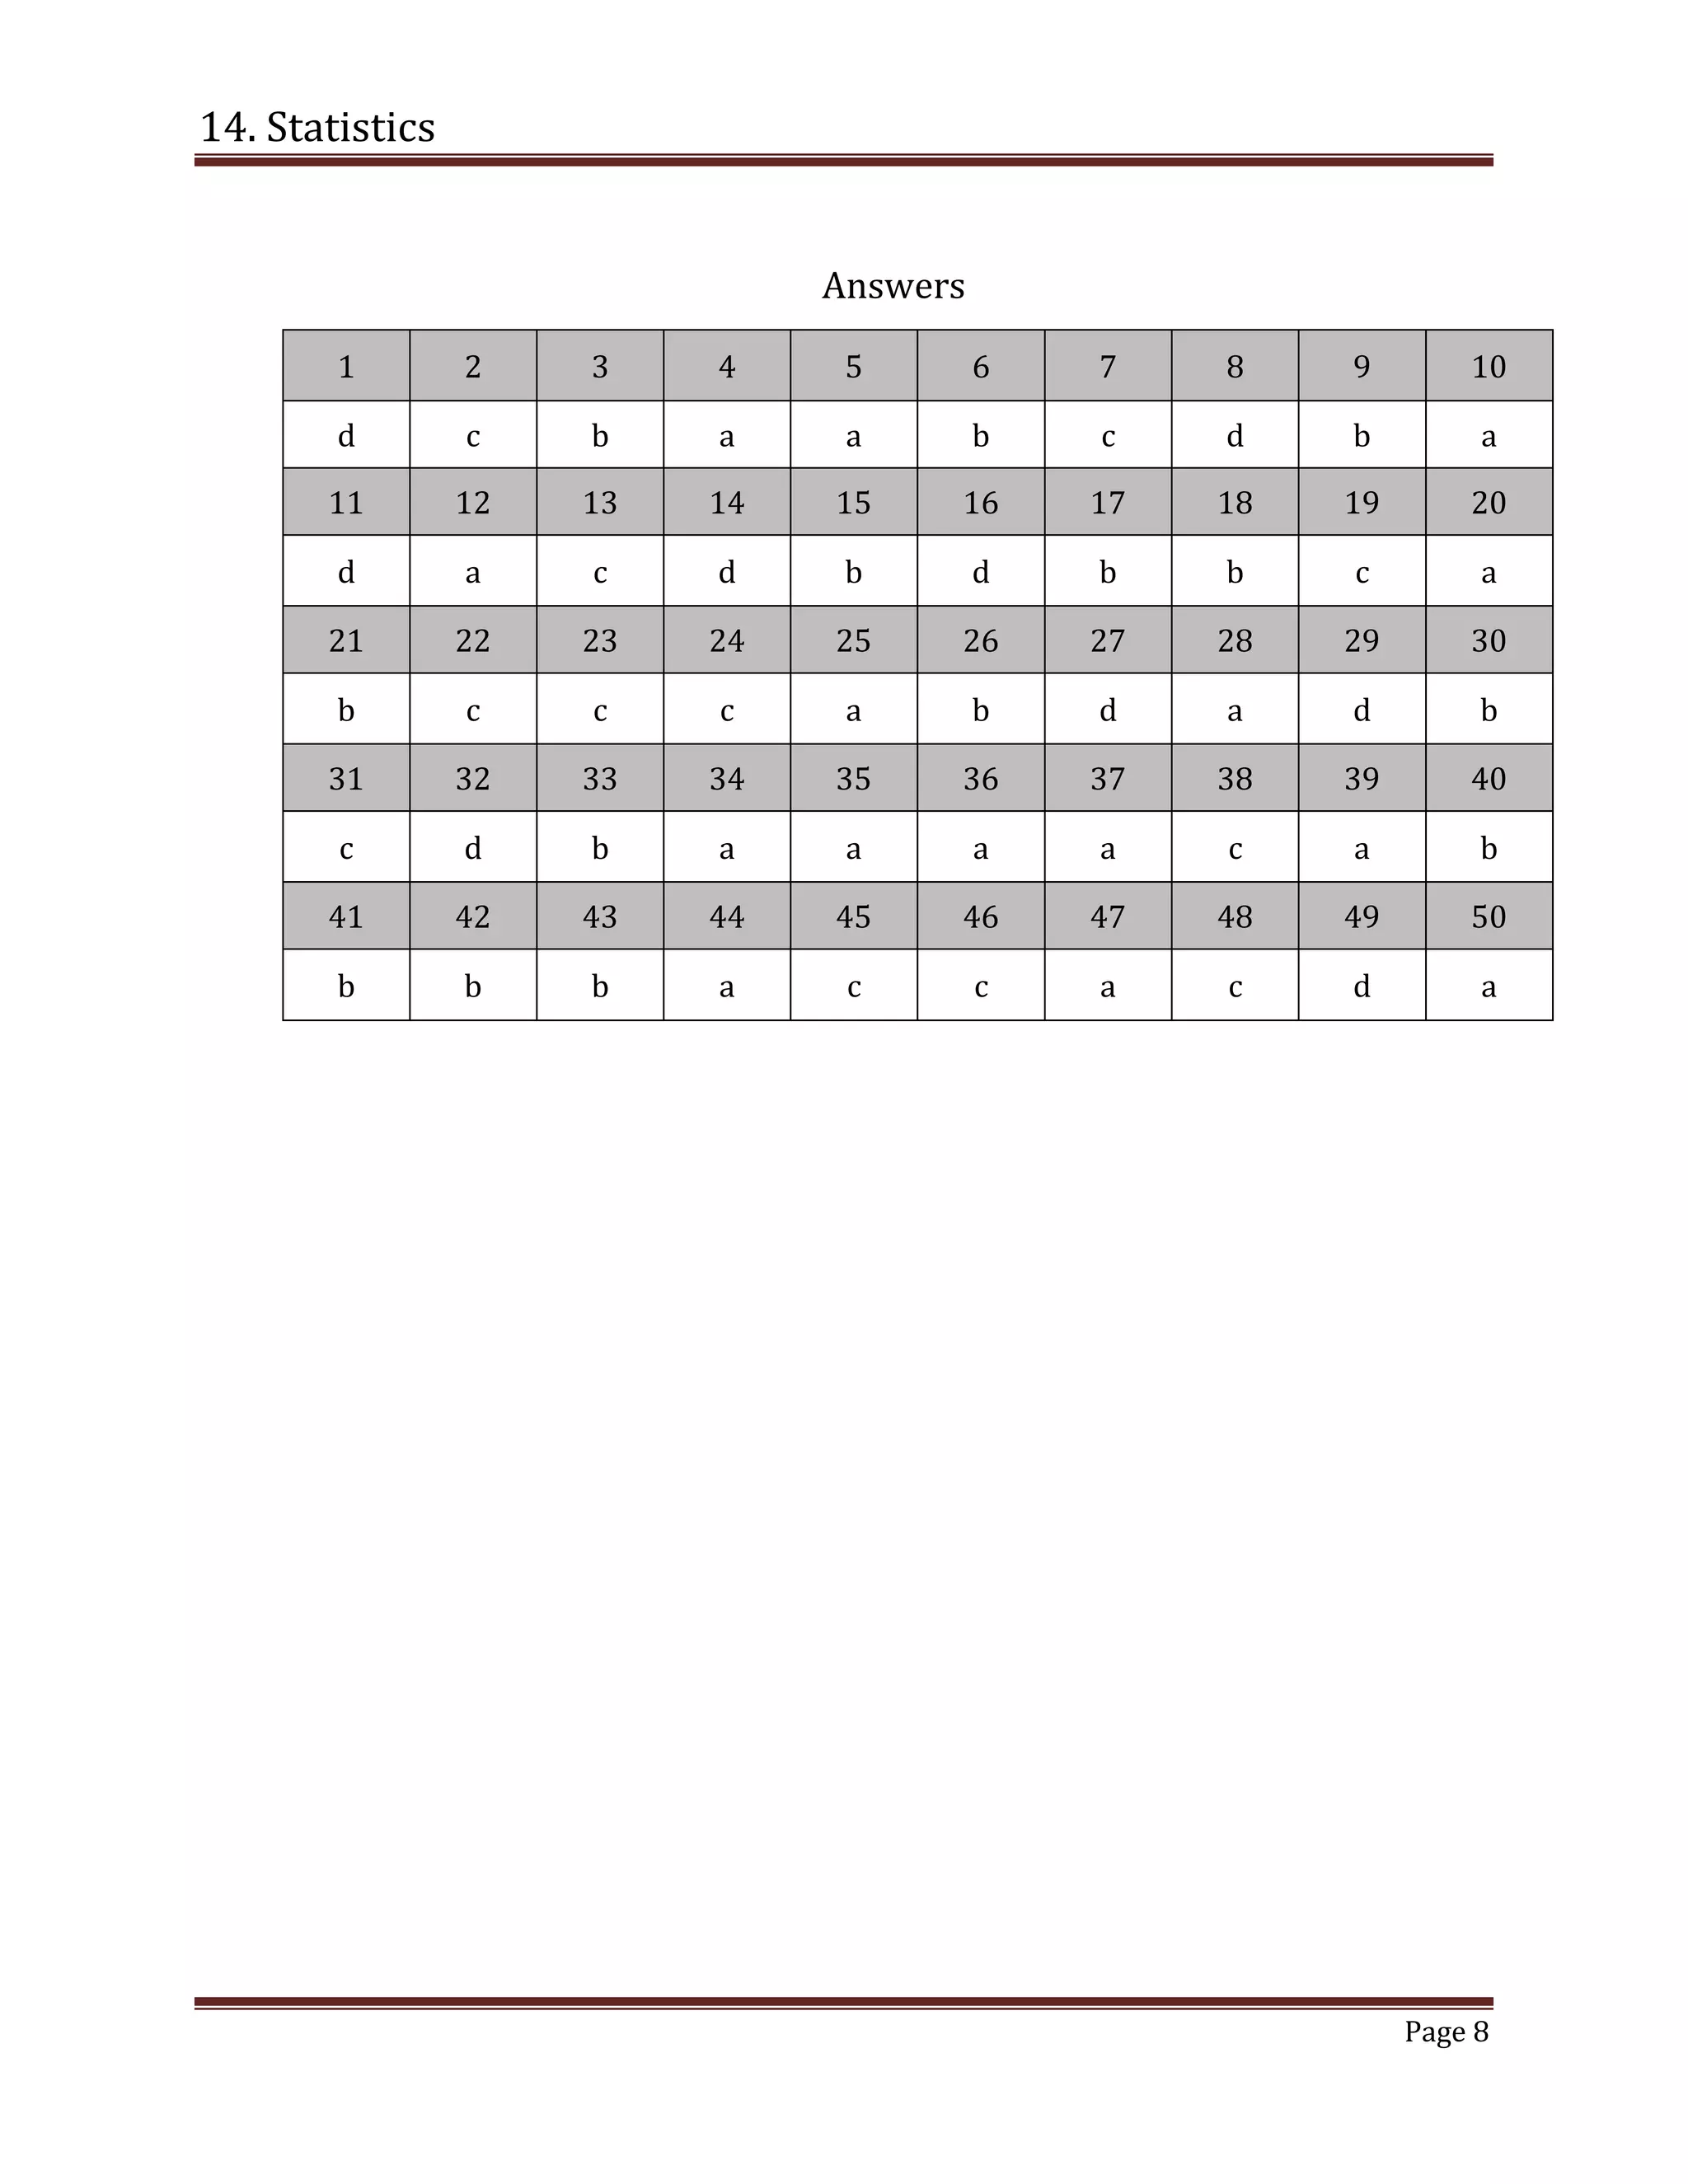

This document provides information about statistics concepts including measures of central tendency (mean, median, mode), calculating mean and median for grouped and ungrouped data, frequency distributions, and ogives. It also includes 50 multiple choice questions testing understanding of these statistical concepts. Key topics covered are calculating and comparing means, medians, and modes, determining class boundaries and mid-values, and identifying appropriate measures and formulas for grouped and ungrouped data sets.