Eva van Gorsel_The role of climate, disturbance and land management on water use and carbon uptake in a managed subalpine forest ecosystem
•
0 likes•803 views


Recommended
Recommended
More Related Content
What's hot
What's hot (11)
Similar to Eva van Gorsel_The role of climate, disturbance and land management on water use and carbon uptake in a managed subalpine forest ecosystem
Similar to Eva van Gorsel_The role of climate, disturbance and land management on water use and carbon uptake in a managed subalpine forest ecosystem (15)
More from TERN Australia
More from TERN Australia (20)
Eva van Gorsel_The role of climate, disturbance and land management on water use and carbon uptake in a managed subalpine forest ecosystem
- 1. The role of climate, disturbance and land management on water use and carbon uptake in a managed subalpine forest ecosystem Eva van Gorsel, A. Cabello-Leblic, H.A. Cleugh, V. Haverd, A. Held, H. Keith, and R. Leuning 20 February 2013
- 2. Variability of NEE: FLUXNET and Tumbarumba mean: -227 gC m-2 yr-1 standard deviation: 269 gC m-2 yr-1 minimum value: -1229 gC m-2 yr-1 maximum value: 450 gC m-2 yr-1. The Role of Climate, Disturbance and Management on Fluxes | Eva van Gorsel | Page 2
- 3. Drivers of NEE: radiation direct radiation diffuse radiation The Role of Climate, Disturbance and Management on Fluxes | Eva van Gorsel | Page 3
- 4. Drivers of NEE: temperature The Role of Climate, Disturbance and Management on Fluxes | Eva van Gorsel | Page 4
- 5. Drivers of NEE: vapor pressure deficit The Role of Climate, Disturbance and Management on Fluxes | Eva van Gorsel | Page 5
- 6. Climate at Bago State Forest (SILO data) 1380 mm 22.7 C -1.09 °C The Role of Climate, Disturbance and Management on Fluxes | Eva van Gorsel | Page 6
- 7. Climate at Bago State Forest (SILO data) d, h avg d, h avg wet, h The Role of Climate, Disturbance and Management on Fluxes | Eva van Gorsel | Page 7
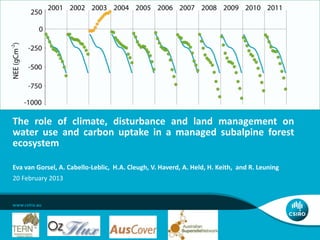
- 8. Interannual variability of NEE and ET 790 mm 801 686 598 732 792 881 802 813 918 858 812 d, h avg d, h avg wet, h The Role of Climate, Disturbance and Management on Fluxes | Eva van Gorsel | Page 8
- 9. Interannual variability of NEE and ET -580 gCm-2 -616 -331 230 -445 -534 -731 -546 -894 -913 -814 -793 d, h avg d, h avg wet, h The Role of Climate, Disturbance and Management on Fluxes | Eva van Gorsel | Page 9
- 10. Insect damage cool, wet hot, dry reduction in natural parasites and predators of Psyllids hot, dry reduction in photosynthetic activity reduction in biomass increase decrease in protein synthetic activity (defensive metabolites and enzymes) drought can trigger mortality in trees that have predisposing factors The Role of Climate, Disturbance and Management on Fluxes | Eva van Gorsel | Page 10
- 11. Insect damage leads to decreased biomass increments mortality increases and affects larger trees Keith, H., et al. (2011). doi:10.1016/j.agrformet.2011.07.019 The Role of Climate, Disturbance and Management on Fluxes | Eva van Gorsel | Page 11
- 12. Insect damage LAI Keith, H., et al. (2011). doi:10.1016/j.agrformet.2011.07.019 The Role of Climate, Disturbance and Management on Fluxes | Eva van Gorsel | Page 12
- 13. Insect damage change in albedo? The Role of Climate, Disturbance and Management on Fluxes | Eva van Gorsel | Page 13
- 14. Insect damage The Role of Climate, Disturbance and Management on Fluxes | Eva van Gorsel | Page 14
- 15. insect damage limited regenerative Insect damage capacity due to dry conditions precipitation back to average The Role of Climate, Disturbance and Management on Fluxes | Eva van Gorsel | Page 15 driest year on (our) record precipitation back to average above average rainfall logging activity
- 16. Selective and partial logging Last occurrence of logging activity Footprint climatology 1/10/2009-31/12/2009 2011 e.g.: N.Kljun, 2008, BLM DOI:10.1023/B:BOUN.0000030653.71031.96 The Role of Climate, Disturbance and Management on Fluxes | Eva van Gorsel | Page 16
- 17. Insect attack: a local effect? percentile rank area: 305.047 km2 The Role of Climate, Disturbance and Management on Fluxes | Eva van Gorsel | Page 17
- 18. what drives the exchanges of carbon, water and energy between Bago State forest and atmosphere? daily seasonal annual multi-annual max max The Role of Climate, Disturbance and Management on Fluxes | Eva van Gorsel | Page 18
- 19. NEE NA 1 5 4 2 6 3 The Role of Climate, Disturbance and Management on Fluxes | Eva van Gorsel | Page 19
- 20. LE NA 1 3 2 4 6 5 The Role of Climate, Disturbance and Management on Fluxes | Eva van Gorsel | Page 20
- 21. Climatic drivers The Role of Climate, Disturbance and Management on Fluxes | Eva van Gorsel | Page 21
- 22. Impact of logging on fluxes model input models model output model validation met PM rad DHP foot lidar print hyper- spectral Responses of carbon and water exchanges to prolonged dry and wet periods | Eva van Gorsel | Page 22
- 23. Impact of logging on fluxes CORRELATION TIME STEP SLOPE FRACTIONAL BIAS NMSE COEFFICIENT hourly (area LAI) 1.18 0.75 -0.14 0.13 hourly (footprint weighted) 1.00 0.73 0.04 0.13 5day 0.96 0.88 0.06 0.03 Responses of carbon and water exchanges to prolonged dry and wet periods | Eva van Gorsel | Page 23
- 24. Impact of logging on fluxes 2.56 mm/day 3.06 mm/day 3.32 mm/day Responses of carbon and water exchanges to prolonged dry and wet periods | Eva van Gorsel | Page 24
- 25. Conclusions Highly dynamic forest ecosystem Climate impacts on the exchanges of carbon and water: direct: changes in temperature, precipitation, vpd etc. indirect: disturbance as a consequence of changes in climatic conditions Responses of carbon and water exchanges to prolonged dry and wet periods | Eva van Gorsel | Page 25
- 26. Conclusions Highly dynamic forest ecosystem Climate impacts on the exchanges of carbon and water: direct: changes in temperature, precipitation, vpd etc. coherence is generally strongest between incoming shortwave radiation and fluxes in Bago State forest temperature is generally a stronger driver than vpd, swc or precipitation coherences are generally strongest on annual time scale impact of drivers is (time) scale dependent on multi-annual time scales MEI is well correlated to NEE and LE Responses of carbon and water exchanges to prolonged dry and wet periods | Eva van Gorsel | Page 26
- 27. Conclusions Highly dynamic forest ecosystem Climate impacts on the exchanges of carbon and water: direct: changes in temperature, precipitation, vpd etc. indirect: disturbance as a consequence of changes in climatic conditions affects different species differently (epicormic growth) reduced photosynthetic active leaf area reduced stomatal conductance and photosynthetic capacity reduced biomass increment increased mortality Responses of carbon and water exchanges to prolonged dry and wet periods | Eva van Gorsel | Page 27
- 28. Conclusions Highly dynamic forest ecosystem Climate impacts on the exchanges of carbon and water: direct: changes in temperature, precipitation, vpd etc. indirect: disturbance as a consequence of changes in climatic conditions Human induced disturbance can only be assessed with a combined observational (flux measurements and remote sensing) and modelling approach using footprint weighted model output for comparison with observations improved results. impact of logging on (carbon and) water fluxes can be quantified and related to changes in stand structure. Responses of carbon and water exchanges to prolonged dry and wet periods | Eva van Gorsel | Page 28
- 29. Thank you and thank you to Steve Zegelin and Dale Hughes who kept the measurements going during all these years… Thanks also to Natascha Kljun, Chris Hopkinson, Laura Chasmer, Marta Yebra, Jose Jimenez –Berni and Stijn Hantson for contributing to this work. CSIRO/CMAR Eva van Gorsel t +61 2 6246 5611 e eva.vangorsel@csiro.au w www.cmar.csiro.au w www.ozflux.org.au ENVIRONMENT/MARINE AND ATMOSPHERE
Editor's Notes
- Eva van Gorsel, A. Cabello-Leblic, H.A. Cleugh, V. Haverd, A. Held, H. Keith, and R. Leuning
- Histogram showing the distribution of Net Ecosystem Exchange in the LaThuile dataset (Agarwal D.A. et al., 2010). The data contains 227 site years (open policy dataset, used where full year available), the distribution has a mean value of -227 gC m-2 yr-1, a standard deviation of 269 gC m-2 yr-1 and ranges from a minimum value of -1229 gC m-2 yr-1 to a maximum value of 450 gC m-2 yr-1. Darker bars indicate bins that include data from Tumbarumba, the number of years is displayed on top. The mean value of the distribution in Tumbarumba is -581 gC m-2 yr-1, has a standard deviation of 328 gC m-2 yr-1 and ranges from -913 gC m-2 yr-1 to 230 gC m-2 yr-1, spanning a wide range of that observed in the global network.ecosystems losing the most carbon (positive sign) have been *disturbed recently.Ecosystems gaining the most carbon (negative sign) tend to be *evergreen mid-age forests, *having year-round growing seasonsTumbarumba: large spread: in this talk we investigate why.
- net ecosystem exchange versus net shortwave radiation, which is a good measure of the radiation absorbed within the canopy (Haverd et al., 2012). Light quality has an effecct on NEE.Clear sky ->conditions part of the canopy receives direct radiation while some leaves remain in the shade some leaves saturated some leaves low exposure -> low light use efficiencyCloudy -> sunlit leaves direct and diffuse shaded leaves diffuse radiationlow light conditions: respiration dominates the NEEhigh amounts of incoming radiation (i.e. when sun angles are high) the decreased sensitivity is most likely due to light saturation reached by the leaves.Light quality, the amount of direct and diffuse radiation, can have an impact on Net Ecosystem Exchange (NEE). Under clear sky conditions part of the canopy receives direct radiation while some leaves remain in the shade. This can leave sunlit leaves light saturated and shaded leaves with low light exposure. The combined effect will lead to low light use efficiency (Mercado et al., 2009). A higher light use efficiency has been observed when incoming radiation is more diffuse and sunlit leaves receive both direct and diffuse and shaded leaves receive diffuse radiation (e.g.: Law et al., 2002) . To investigate if this effect is relevant in this quite open, but clumped canopy we have pooled our measurements into two classes: first we calculated the 95 percentile of global incoming shortwave radiation (Sd) for each hour of the day for each month in the whole data set. Data with values between 20 and 80% of the 95 percentile represent data measured during cloudy conditions while higher insolation values are interpreted as clear sky or partly cloudy conditions. The two classes of data group into different light use efficiency curves for all except very low and very high values of incoming radiation. Under low light conditions respiration dominates the NEE. Under conditions with high amounts of incoming radiation (i.e. when sun angles are high) the decreased sensitivity is most likely due to light saturation reached by the leaves. To ensure that ecosystem respiration is consistent between different light regimes we have excluded all data that was not in a temperature range between 12°C and 14°C and have observed the same behaviour that, depending on radiation quality, data grouped into different light use efficiency classes. This confirms that photosynthesis is more efficient under diffuse light conditions.
- Temperature and vapour pressure deficit modulate the amount of carbon exchanged for a specific amount of radiationTemperature response of Net Ecosystem exchange of CO2 in Tumbarumba. Carbon uptake increases with temperature in the low temperature range, reaches a maximum, and then rapidly declines with increasingly higher temperatures. Uncertainties have been derived through bootstrapping (100000 times randomly selecting data with replacement (A.C. Davison and Hinkley, 1997))with increasing temperatures NEE increases until an optimum temperature is reached at 18 oC. If temperatures rise higher there is a rapid decline in in the amount of carbon that is taken up. When temperatures are high and vapour pressure deficit are low plants need to prevent the leaf water potential from reducing below a critical level. A decrease of stomatal conductance prevents water loss but also leads to a short term reduction in assimilation because stomatal closure reduces CO2 diffusion into the leaf. NEE observations during dry periods with high VPD therefore often have an asymmetric shape, that is partly caused by stomatal limitations of carbon uptake and partly during higher respiration in the afternoon (Lasslop et al., 2009). Figure 10 shows that NEE drops sharply when a critical vapour pressure deficit of 12 hPa is reached, a value that is in good agreement with the value used by Lasslop et al. (2009) when separation net ecosystem into assimilation and respiration using a light response curve approach.
- Temperature and vapour pressure deficit modulate the amount of carbon exchanged for a specific amount of radiationTemperature response of Net Ecosystem exchange of CO2 in Tumbarumba. Carbon uptake increases with temperature in the low temperature range, reaches a maximum, and then rapidly declines with increasingly higher temperatures. Uncertainties have been derived through bootstrapping (100000 times randomly selecting data with replacement (A.C. Davison and Hinkley, 1997))with increasing temperatures NEE increases until an optimum temperature is reached at 18 oC. If temperatures rise higher there is a rapid decline in in the amount of carbon that is taken up. When temperatures are high and vapour pressure deficit are low plants need to prevent the leaf water potential from reducing below a critical level. A decrease of stomatal conductance prevents water loss but also leads to a short term reduction in assimilation because stomatal closure reduces CO2 diffusion into the leaf. NEE observations during dry periods with high VPD therefore often have an asymmetric shape, that is partly caused by stomatal limitations of carbon uptake and partly during higher respiration in the afternoon (Lasslop et al., 2009). Figure 10 shows that NEE drops sharply when a critical vapour pressure deficit of 12 hPa is reached, a value that is in good agreement with the value used by Lasslop et al. (2009) when separation net ecosystem into assimilation and respiration using a light response curve approach.
- The climate is *cool, moist sub-alpine *characterised by cold winters (-1 / 6 °C). *summer temp reach ( 10/23)*in winter snow fall occurs regularly, few weeks of snow cover possible (1250 m asl) but soil does not freeze
- Top panel: max min temperatures, dashed lines == average 1970-2000, precipitation: cumulative 1 year, moving step 1 monthIdentify periodsDry periods 200-4 and even more severe 2006-7Average 2005 and 2008 onwards andwarmer than average more precipitation: 2010/2011
- ET dark line average 2001-2011, dots cumulative over each month to the year2002-2004 below average but not to same extent 2006/20072005 average, 2008-9 increasing but not so much 2011, despite high precipitation and temperatures (-> future publication: check temp optimum…)
- Overall very similar to ET but much stronger response in years 2002-2004, where ecosystem went from a average strong sink (-580) into source. What happed 2002-2004?
- Predisposing factors (age, site conditions/nutrients, competition)several processes to impact tree growth, in both the initiation of the damage and the recovery phase. First, occur- rence of insect outbreaks is often related to weather conditions. Psyllid outbreaks have been related to changes from cool and wet to hot and dry weather; that results in reduction in natural parasites and predators, such as birds and ants (White, 1969; Farrow, 1996). Psyllid outbreaks in the southern tablelands have been related to low temperatures and high rainfall that reduce the effectiveness of encyrtid parasites and restrict host-parasite synchronisation (Clark, 1962). These conditions occurred for several years prior to 2001–02, and in 2002–03 psyllid numbers increased to outbreak levels. Second, water deficit in plants confers a predisposition to attack by pests and pathogens. A decrease in photosynthetic activity under conditions of water deficit means that there is a decrease in protein synthetic activity including defensive metabolites and enzymes (Boyer, 1995). Third, drought can operate as a trigger that leads to mortality in trees that have predisposing factors such as old age, poor site conditions or competition that result in low storage of carbohydrates, and then succumb to damage from insects or fun gal pathogens. Protracted stress from moisture limitation and leaf damage leads to a plant carbon deficit resulting in metabolic limitations and reduced capacity for defence against insects and fungi. Fourth, recovery of the canopy depends on favourable conditions for new leaf production after the insects have dissipated. Peak leaf loss occurred in autumn 2003 but was followed by a prolonged
- Average annual biomass C increment compared during ‘stress’ years (2002 – 04) with years with previous years (1999 – 2002) for 16 inventory plots across Bago State Forest. Reduction in increment during the drought/insect attack averaged 54% with a range from 45 to 80% across the plots.
- Litter traps and DHP at 30 plots,*marked increase in leaf fall occurred in May – June 2003: additional 27% to the annual leaf fallLAI: Patchy response: depends on species compositionInsect damage summer 2002 - 2003A marked increase in leaf fall occurred in May – June 2003 that deviated from the normal seasonal pattern and represented an additional 27% to the annual leaf fallpeak leaf fall earlier in the summer of 2002 – 03Depends on species composition: The greatest decrease in LAI and peak in leaf fall occurred in plots with predominantly E. delegatensis, and the effect decreased with lower proportions of E. delegatensiin plots. The sensitivity of E. delegatensis, a species in the ‘ash’ group of eucalypts, has been recorded previously as it appears to have less epicormic regeneration (Shepherd 1957). Considerable variation exists in the susceptibility of individual trees to psyllid damage (Clark 1962). In patches very high loss of LAI
- Information on leaf area over time?
- C:\\Users\\van363\\Desktop\\LUE WUE\\data\\6_SloFast_GapFilled_0100101-120101_slow.xlsx
- Logging occurred around footprint, 2011 within footprint
- Remote sensingLandsatPoster
- We use wavelet coherence to identify frequency bands in which meteorological drivers or stand structure and carbon and water exchanges are covarying. Coherence is defined as the square of the cross-spectrum normalized by the individual power spectra. Coherence is a measure of cross correlation between two time series as a function of frequency and takes values between 0 and 1. -what timescales are we interested in (interannual: is there a local max >2years)
- Coherence between NEE, sd, Tsoil…. On daily to multi-annual time scaleCoherence depends strongly on time scaleDominant: annual and dailyOverall strongest: incoming shortwaveOther annual are +- equally strong, but vpd and swc > Ta and TsTa > Ts on annual but Ta < Ts on daily time scale (important for simple models for e.g. respiration, where drivers need to be chosen carefully and are under debate every so often)-> time scale mattersPrecip no coherence on daily time scale (no pulses after rain)
- LE very similar to NEE but coherence T > vpd, swc and prec on annual and daily time scales
- Multivariate ENSO Index strong coherence with local precip, but also with NEE, LE (as compered to other locally measured drivers)