SlideShare a Scribd company logo
1 of 25
Download to read offline
Draft Final Report:

      Monitoring Protocol and Data Collection:
 Comparison of the Runoff Water Quantity, Quality and
Thermal Performances of Two Green Roof Technologies;
                                 Thin vs. Thick
            University of Pittsburgh Project Number 703543
                                       August 2009
                      Prepared for: Three Rivers Wet Weather
                               Sub Grant # 03-01-GRM
                               Pittsburgh, Pennsylvania

                                    Prepared by:
            The University of Pittsburgh, Swanson School of Engineering
                 Department of Civil & Environmental Engineering
                        949 Benedum Hall, 3700 O’Hara St.
                          Pittsburgh, Pennsylvania 15261

                           PRINCIPAL INVESTIGATOR
                            Dr. Ronald D. Neufeld, P.E.
                      Board Certified Environmental Engineer
                   Professor of Civil & Environmental Engineering
                              University of Pittsburgh
                                Pittsburgh, PA 15261
                                  neufeld@pitt.edu

                             CONTRIBUTING AUTHORS

   Dr. Jason Monnell, Research Assistant Professor, University of Pittsburgh;
  Dr. Robert J. Ries 1 Assistant Professor in Sustainability; University of Florida

                  with University of Pittsburgh Graduate Students:
                   Mr. Viral Shah, Mr. Daniel Bliss, Ms. Jiayin Ni
                  Department of Civil & Environmental Engineering


  1
      Current Address: RNK 304 / Box 115703, Rinker School of Building Construction,
                     University of Florida Gainesville, FL 32611-5703
EXECUTIVE SUMMARY

        This report presents the use of a green roof compared to a conventional (control) roof using
modern construction methods. A green roof has many environmental, economic, and aesthetic benefits
over a conventional roof. This study examined the environmental benefits of a thick and a thin green roof,
with focus on stormwater management and thermal benefits. The results demonstrated that in comparison
to the conventional roofs, green roofs retained significantly more water, moderated temperature increases
and decreases of the roof, and had marginal effect on the chemistry of the discharged runoff. Two
different technologies of green roofs were analyzed and the enhanced performance of two green roofs
over their associated conventional roof was found to depend on soil (roof) thickness. Concise descriptions
and major distinctions between control and green roof, and comparisons of thick and thin green roof
technologies are summarized in Table 0-1 and Table 0-2 of this executive summary.


        Monitoring systems were developed to capture the water flows and temperature profiles of both
the green roof and control roof. The monitoring systems captured electronic data from sensors and
transmitted them to the University of Pittsburgh via modem and electronic network. The portion of the
roof at Giant Eagle devoted to this research had conventional and green roof segment of sizes 3,520
square feet each while both the conventional and green roofs at Homestead were approximately 2,000 sq.
ft. each. The monitoring systems at two sites included (for green and control roofs) separate flumes (at
Giant Eagle) or weir boxes (at Homestead) ultrasonic sensors; soil moisture sensors, rain gauge,
thermocouples, temperature probes, and net radiometers to measure the runoff and thermal performance
of the two roof types over time. Runoff water samples from each roof were collected at both sites and
tested in the laboratory for water quality characteristics. The system was implemented and environmental
data was collected continuously over a first seven-month period from July 2006 through January 2007 at
the Giant Eagle location. This phase encompassed periods of summer, fall, and winter climate conditions.
A total of 24 storms, ranging from 0.07 inches to 2.2 inches, occurred during that test period, and the
chemical data from most storms was captured during the first phase. A second phase of the study was
implemented from April 2008 through April 2009 monitoring both the Homestead and Giant Eagle sites.
In sum total, the sensors and data loggers at the two sites recorded 95 storms ranging from 0.02 inches to
2.42 inches of precipitation.


                                                        i
Table 0-1 General Characteristics of the Control and Green roof

                                  Green roof                                 Control roof
                  1% to 100% of overall flow rate reduction     Usually has a higher peak flow rate
                  (compared to control roof) observed –         than green roof, but became less
                  high percent under light storm and low        different for heavy storm and high
                  percent under heavy storm                     soil moisture content
                  2% to 100% reduction of total runoff          Usually in a higher level runoff than
                  volume (compared to control roof) –           the runoff for green roof – more
                  green roof retained all the stormwater for    stormwater discharged from control
Runoff quantity   100%                                          roof
 performances     Comparing with control roof, initial
                  runoff retardation is ranged from 0 to 16.7
                  hours. Time delay of maximum peak flow
                                                              Runoff water started to discharge in a
                  is between 0 to 16 hours. Runoff
                                                              short time after occurrence of rainfall.
                  discharge begins after 0.035-0.6 inches of
                  water released from control roof,
                  depending on soil moisture condition.
                  The soil moisture content, soil thickness as well as the extent of rainfall influenced
                  runoff quantity performances of green roof.

                  Approximately 90°F (or below) of surface Approximately 100°F (or above) of
                  temperature observed on a hot summer surface temperature observed on a hot
                  day                                      summer day
                                                             Large thermal fluctuation from day to
                  Experience less thermal fluctuation from
                                                             night, particularly during summer.
                  day to night; protect roof membrane and
                                                             Exposure of the roof membrane to
                  reduce its thermal stress during days with
                                                             ambient conditions may reduce its
   Thermal        high ambient temperature
                                                             usage life
 performances     Solar energy absorbed by the system and
                                                             Reflect more solar energy to the
                  for photosynthesis by the vegetation.
                                                             atmosphere and may result in an
                  Water trapped in soil can be evaporated
                                                             urban heat island effect.
                  resulting in cooling.

                  During the night in summer, the green roof had a slightly higher roof membrane
                  surface temperature than the control roof, which indicates that a green roof
                  releases heat slowly.

                  No first flush detected
                  Neutralize the acidic rainfall
Runoff quality                                                  No change in water runoff quality.
                  (Homestead); act as a filter for pollutant
                                                                Direct flow to the roof drain.
 performances     particles from atmosphere

                  Fertilization during the summer of 2008 by the owner of the Homestead green roof
                  influenced the runoff quality results.


                                                     ii
Table 0-2 Characteristic differences between the thin and thick Green roof technologies

                          Thin roof (Homestead)                     Thick roof (Giant Eagle)
                   Thickness of soil medium: 1 ½ inches
                                                             Thickness of soil medium: 4 ½ inches.
                   Manufacturer: Green Living
                                                             Manufacturer: The Garland Company.
                   Technology
General features                                             Type of plants: a mix of sedum
                   Type of plants: a mix of sedum
                                                             acre,album, sexagular, kamtschaticum,
                   kamtschaticum,worm grass sedum and
                                                             etc.
                   thymus x citriodorus
                                                        For total runoff volume, large capacity
                   For total runoff volume, more
                                                        of water retention under dry soil
                   stormwater discharged under dry soil
                                                        condition, due to an additional 4-inches
                   condition, due to the limited soil
                                                        of soil thickness as compared to the thin
                   thickness and retention capacity.
                                                        roof.
Runoff quantity    Initial runoff retardation is ranged      Initial time of retardation of runoff
 performance       from 0 to 8.7 hours. Significant          ranged from 0 to 16.7 hours. Significant
                   retardation of time of maximum peak       retardation of time of maximum peak
                   flow for initially dry soils.             flow for initially dry soils.

                   For initially wet soils: small differences in time of runoff or retardation of peak
                   flow were observed between thin and thick roofs.


                   Reflect less heat and lower ambient
                   temperature; less insulation effect Better insulation due to thicker soil
   Thermal         between the roof surface and roof deck substrate.
 performances      below

                   No significant differences in thermal performance between the two green roofs
                   were found during cold weather months.

                   The runoff samples from two sites indicated different rainfall pH, however metal
Runoff quality
                   constituents were marginally less at Giant Eagle. No statistically significant
performances
                   differences were observed in runoff quality at either green roof except for N & P.


                                                   iii
Part I: Water Quality Results

         The results of two green roof studies indicate the potential of green roofs as an effective system in
stormwater management. The benefits of a green roof over the conventional membrane “control roof” are
as follows:


 1.      The peak flow rate (normalized as cubic feet per second of flow per unit roof area) from the green
roof was lower than the control roof in most cases.


         In the first study phase, the reduction of the runoff from the thick (Giant Eagle) green roof as
compared to the control roof was between 5 to 70%. The peak flow rate reductions during the second
study phase were in a ranged from 1% to 100%. The highest comparative reduction in flow rate occurred
during light storms while smaller flow rate reductions occurred under heavy storm conditions.


         A graphic relationship of the water runoff parameters considered to be of importance for this
research is shown on the sketch of Figure 0-1. The dashed line represents a typical runoff flow rate of
control roof and the solid line represents the green roof runoff flow rate. The designations “A, B and C”
are three significant performance parameters of (A) time of initial runoff retardation, (B) time of peak
runoff retardation and (C) magnitude of differences in normalized quantities peak runoff flow rates.


         For most rainfall events, both the time of occurrence and magnitude of green roof runoff water
flow rates are attenuated as compared to control roof flow rates. This observation however was highly
dependent on the soil moisture content (relating to time of occurrence of the previous storm event) and
overall magnitude of rainfall precipitation. There was virtually no difference between the green roof water
retardation of retention capability once the soil reached water saturation (due to heavy and/or prolonged
rain fall events).


                                                          iv
(C
  Flow Rate


                                                     )

                                                                                                 Control
                                   (B)                                                           Roof Flow


                                         Green
                                         Roof Flow


                     (A)                                  Time

              Figure 0-1 Runoff parameters of importance: control and green roof discharges.

(A) Initial runoff retardation: the time difference between which green roof starts discharges stormwater and control
roof starts to discharge;

(B) Maximum peak flow retardation: the difference in time between the control roof and the green roof of
occurrence of normalized maximum peak flows.

(C) Maximum normalized peak flow rate variation: the difference in maximum peak normalized flow rates between
the control roof runoff and green roof runoff.


 2.           The total quantity of runoff from the green roof was dependent on the soil moisture, the intensity,
and duration of the storm. As soil moisture content increased, the capacity of the green roofs to retain
water decreased. For heavy storms, the reduction in total flow was less than that under lighter storms, but
the reduction was still observable. The reduction observed in both study phases ranged from 100% for the
lightest storm to 2% for the heaviest. A reduction of 20% in the total runoff volume was observed in
several large storms. For smaller storms (usually less than 0.1 inch of precipitation or slightly higher)
where the soil was dry, 100% of reduction of the total runoff volume was often observed. In these cases,
the green roof was able to absorb all the stormwater and no runoff was measured.


                                                              v
3.      The thickness layer of soil media as well as soil moisture of the green roof impacts the capacity of
stormwater retention. Under dry soil conditions, the thick roof (at the Giant Eagle site) retained more
water than the thin roof (at the Homestead site). A larger mass of dry soil (from a thicker soil layer) has
more available capacity (field capacity) for water retention. However, as the soils became saturated, any
additional water that fell on the green roof soil was discharged and little differences in further water
retention are observed.


The water cup reservoir specifically incorporated into the thin roof technology is designed to retain part of
the stormwater and may yield additional water storage capacity, but this effect was minimally observable.
The water cup reservoir, however, can provide moisture during prolonged drought conditions for the
plants on the thin roof, and thus has an important benefit.


4.      The time of initial discharge from green roof was significantly delayed relative to the initial time
of discharge from the control roof. The average retardation time for green roof runoff under dry soil
condition was 3 hours behind the control roof runoff and only 1.5 hours under wet soil condition.


It was observed that towards the end of a storm, the runoff from green roof has a prolonged tail consisting
of a very low flow rate that did not occur for the control roof. This tailing of flow occurred for a
significant amount of time after rain ceased and the runoff from the control roof stopped.


                                                          vi
Part II: Temperature Profile Results

        There are significant benefits in reduced heat gain and loss that are observed to be a function of
roof type and thickness. The most significant results are:


 1.     The temperature profile shows the stone ballast covering the “rubber” membrane on the control
 roof at Giant Eagle cannot protect the membrane from the ambient conditions and incoming radiation.
 Despite the light color of the stone ballast on the roof surface, that membrane surface reached extreme
 temperatures on a hot summer day. During summer time, the control roof surface reached a temperature
 above 100°F when the ambient temperature is close to 90°F. The green roof surface temperature
 remained at or below 90°F during the day, which was about the same as ambient temperature.


 The green roof provided protection to the roof membrane and reduced the thermal stress on the roof
 membrane during days with ambient temperatures greater than 75°F. During summer nights, the green
 roof temperature closely followed the ambient temperature. These observations suggest that the green
 roof has the ability to absorb and release of energy that it was exposed to during the day.


 2.      Temperature profiles show that the wintertime surface temperature of the green roof and control
 roof showed little difference during the day when the sun shines. During the night, however, the green
 roof was able to retain a portion of the heat it absorbed during the day. Although the temperature profiles
 suggest that the thermal benefits of the green roof in winter is not as significant as it is the summer, the
 green roof was able to save a small amount of energy by showing reduced heat loss in comparison to the
 control roof.


3.      The net radiation at the site was observed to influence the roof performance. In the summer and
fall when the roof is exposed to 400-800 W*m-2 net of incoming radiation throughout the day, the control
roof easily stores this energy, while the soil and plants on the green roof store and use that energy. The
data from the summer and fall indicate that the green roof shows slightly higher positive radiation during
the day, meaning the green roof is reflecting less energy during the day, and slightly higher negative
radiation at night, meaning the green roof is releasing less energy at night. This suggests there is
significant potential for green roofs in mitigating the urban heat island effect. During the winter the two
roofs perform nearly the same as the short days, lower sun, and shading by the apartment building greatly
limited the energy transfer during the day.


                                                         vii
Part III: Water Quality Considerations


        Runoff water quality results for the green roof and associated control roof are compared. In
addition, T-statistics at the 95% confidence level are utilized to evaluate if the green roof and control roof
runoff water quality concentration differences are statistically significant. This is done for both locations.
The major conclusions drawn from this information are:


1.      No “first flush” effect (elevation in contaminant level during the initial water runoff) for the
green roof was observed for any test parameter. The “first flush” effect was noticeable for the control
roof.


2.      There was a significant difference between the green roof and control roof pH at the Homestead
site indicating the ability of that green roof to neutralize acidic stormwater (from acid rain falling at that
location).


3.      There is a statistically significant difference in total suspended solids (TSS) between the control
and green runoff samples at Homestead, with a relatively lower concentration coming from the green
roof. There was not such a difference observed at the Giant Eagle site for TSS.


4.      The results of Chemical Oxygen Demand (COD) at Giant Eagle or Homestead sites do not show
any significant differences between the control and green roof. Metal ions were not detected at significant
levels from runoff samples with the exception of zinc.


5.      Chemical fertilization of the Homestead green roof by the building owner during the latter part of
the project period was observed to influence green roof runoff water quality. All nutrient contaminants in
runoff waters from the Homestead green roof show a significant increase in concentration after
fertilization; however, the foliage appeared beautiful.


        In summary, green roof technology is an effective and practical way to improve the stormwater
management, thermal performance, as well as stormwater quality. The body of the report document
provides supporting data and analysis leading to technical insights for the use of this “green” technology
for urban stormwater management.


                                                          viii
ACKNOWLEDGEMENTS

The principal investigator and contributing authors which to thank John Schombert (director)
and Janie French (project manager) of the 3-Rivers Wet Weather Demonstration Program for
their financial support and encouragement, and ability to expedite the installation of green roof
technologies at two locations within the Pittsburgh, PA area.


We thank the Giant Eagle Corporation and Ms Fran Rossi from Echo Real Estate for their
cooperation in the installation of the thick roof technology and patience in allowing students to
monitor that roof located at the site of a large store and condo complex.


 We thank Mr. Daniel Steinitz, owner and “hands-on” project manager for the rehabilitation and
creation of a multi-unit apartment building in Homestead, PA for facilitating the installation of
the thin roof technology and for his patience in allowing students to monitor that roof site.


In addition, the PI wishes to acknowledge and thank the multiple graduate students whose
diligent assistance made accomplishing this project possible; Dr. Robert Ries, co-principal
investigator and now at the University of Florida-Gainesville; and Dr. Jason Monnell, Research
Associate Professor at the University of Pittsburgh.


                                                                       Ronald D. Neufeld, PE, PhD
                                                            Board Certified Environmental Engineer
                                                                     Professor of Civil Engineering
                                                                            University of Pittsburgh


                                                       ix
TABLE OF CONTENTS


EXECUTIVE SUMMARY ..................................................................................... i 


ACKNOWLEDGEMENTS .................................................................................. ix 


1.  MOTIVATION AND OBJECTIVES OF THE STUDY ................................1 


2.  INTRODUCTION TO GREEN ROOFS .........................................................3 

    2.1     Types of green roofs ...................................................................................3 

    2.2     History of green roofs .................................................................................5 

    2.3     Components of green roofs.........................................................................9 

    2.4     Environmental Benefits of Green Roofs ...................................................11 

    2.5     Economic benefits of green roofs .............................................................13 

    2.6     Aesthetic benefits of green roofs ..............................................................14 

    2.7     Green roof demonstration projects ..........................................................15 


3.  3 RIVERS WET WEATHER GREEN ROOF .................................................

    DEMONSTRATION PROJECT ....................................................................28 

    3.1     The Shadyside Giant Eagle Location .......................................................29 

    3.2     The Homestead Green Roof .....................................................................47 


                                                             x
4.  RESULTS AND DISCUSSION .......................................................................55 

   4.1     Giant Eagle Runoff performance .............................................................55 

   4.2     Discussion: Giant Eagle Runoff ...............................................................67 

   4.3     Runoff Quality ..........................................................................................74 

   4.4     Discussion: Giant Eagle Runoff Quality Results .....................................89 

   4.5     Thermal Performance of the Giant Eagle Roof .......................................91 

   4.6     Net Radiation ..........................................................................................115 

   4.7     Discussion: Thermal Data......................................................................119 


5.  COMPARISON OF GIANT EAGLE AND HOMESTEAD ...........................

   GREEN ROOF TECHNOLOGIES ..............................................................121 

   5.1     Runoff quantity performances ................................................................121 


6.  DISCUSSION AND ANALYSIS: COMPARATIVE RUNOFF .....................

   QUALITY, AND HEAT ABSORPTION .....................................................137 

   6.1     Runoff Retardation (Delay from rain onset to time when flow begins) .139 

   6.2     Runoff Quantity Reduction .....................................................................148 

   6.3     Thermal performance .............................................................................151 

   6.4     Physical and Chemical Environmental Analysis of Runoff Waters .......172 


                                                             xi
7.  SUMMARY OF EXPERIMENTS ................................................................188 


8.  CONCLUSIONS .............................................................................................191 


9.  SUGGESTIONS FOR FURTHER STUDIES .............................................196 


10. REFERENCES................................................................................................197 


APPENDIX I.  STORMWATER RUNOFF DATA ........................................... I-1 


APPENDIX II.  TEMPERATURE PROFILES ............................................... II-1 


                                                           xii
LIST OF FIGURES

Figure 0-1 Runoff parameters of importance: control and green roof discharges. ...................................... v 

Figure 2-1 Hanging gardens at the Tower of Babylon were an early example of green roofs. .................... 6 

Figure 2-2 Examples of green roofs at different locations in around the world. .......................................... 8 

Figure 2-3 Stormwater hydrograph before and after urbanization.............................................................. 12 

Figure 3-1 Post-installation photographs of the Shadyside Giant Eagle control roof and green roof ........ 30 

Figure 3-2 Monitoring locations at the Shadyside Giant Eagle roof........................................................... 31 

Figure 3-3 Relative humidity sensor for recording ambient air temperature .............................................. 34 

Figure 3-4 Thermocouple wire for temperature monitoring Attached to Tripod (Giant Eagle) ................. 36 

Figure 3-5 Net radiometer for measuring net radiation at the roof surface (Giant Eagle) .......................... 37 

Figure 3-6 Wind Sentry Set (Giant Eagle) ................................................................................................. 38 

Figure 3-7 Rain Gauge Installed on the Green Roof (Giant Eagle) ............................................................ 39 

Figure 3-8 Two flumes (circled) for discharging stormwater runoff (Giant Eagle) ................................... 40 

Figure 3-9 Ultrasonic sensors installed atop the flumes for measuring stormwater runoff (Giant Eagle).. 40 

Figure 3-10 Soil Moisture Sensor ............................................................................................................... 41 

Figure 3-11 Solenoid Valve Sampling Manifold (Giant Eagle) ................................................................. 43 

Figure 3-12 Solenoid Valves and Sample Bottles ...................................................................................... 43 

Figure 3-13 National Instrument Fieldpoint Dataloggers. .......................................................................... 47 

Figure 3-14 Typical Green Roof Cross-Section (similar to Giant Eagle) ................................................... 48 

Figure 3-15 GLT Green Roof system Cross-Section similar to the one installed at the Homestead site. .. 48 

Figure 3-16 GLT Green Roof at Homestead ............................................................................................. 49 

Figure 3-17 Control Roof at Homestead .................................................................................................... 50 

Figure 3-18 Drainage system at Homestead Site (located in the basement of the building). .................... 51 

Figure 3-19 Ultrasonic sensors monitored changes in water level over weirs at the Homestead Site. ...... 52 

Figure 3-20 National Instruments Fieldpoint Dataloggers at Homestead Site........................................... 52 


                                                                             xiii
Figure 3-21 Runoff sample collection system at Homestead site. ............................................................. 53 

Figure 4-1 Runoff as Rainfall - November 11, 2006 Storm ....................................................................... 58 

Figure 4-2 Runoff Flow Rates - November 11, 2006 Storm....................................................................... 58 

Figure 4-3 Runoff Volumes - November 11, 2006 Storm .......................................................................... 59 

Figure 4-4 Runoff Reduction - November 11, 2006 Storm ........................................................................ 59 

Figure 4-5 Runoff as Rainfall - October 31, 2006 Storm ........................................................................... 61 

Figure 4-6 Runoff Flow Rates - October 31, 2006 Storm........................................................................... 61 

Figure 4-7 Runoff Volumes - October 31, 2006 Storm .............................................................................. 62 

Figure 4-8 Runoff Reduction - October 31, 2006 Storm ............................................................................ 62 

Figure 4-9 Green Roof Water Content - October 31, 2006 Storm. ............................................................. 63 

Figure 4-10 Runoff as Rainfall - October 17, 2006 Storm ......................................................................... 64 

Figure 4-11 Runoff Flow Rates - October 17, 2006 Storm......................................................................... 65 

Figure 4-12 Runoff Volumes - October 17, 2006 Storm ............................................................................ 65 

Figure 4-13 Runoff Reduction - October 17, 2006 Storm .......................................................................... 66 

Figure 4-14 Green Roof Moisture Content - October 17, 2006 Storm ....................................................... 66 

Figure 4-15 Soil Water Content versus Rainfall Depth at the Start of Runoff Flow .................................. 70 

Figure 4-16 Intensity-Duration-Frequency Curve - Shadyside Green Roof and NOAA Data ................... 72 

Figure 4-17 Fraction Runoff reductions versus Rainfall Depth (inches) .................................................... 72 

Figure 4-18 Fraction Runoff reductions versus Storm Duration ................................................................ 73 

Figure 4-19 Fraction Runoff reductions versus Storm Intensity ................................................................. 73 

Figure 4-20 Turbidity - Rainwater Samples ............................................................................................... 75 

Figure 4-21 Turbidity in runoff during the 12/1/2006 storm - Control Roof Samples ............................... 75 

Figure 4-22 Turbidity - Green Roof Samples - December 1, 2006 Storm .................................................. 76 

Figure 4-23 Turbidity of samples collected during the 11/15/2006 storm: Control Roof .......................... 76 

Figure 4-24 Turbidity of samples collected during the 11/15/2006 storm: Green Roof ............................. 77 

Figure 4-25 Phosphorus - Rainwater Samples - November 11, 2006 Storm .............................................. 78 

                                                                         xiv
Figure 4-26 Phosphorus - Unfiltered Green Roof Samples collected during the 11/1/2006 storm ............ 79 

Figure 4-27 Phosphorus - Filtered Green Roof Samples - November 1, 2006 Storm ................................ 79 

Figure 4-28 Phosphorus - Unfiltered Control Roof Samples - November 1, 2006 Storm .......................... 80 

Figure 4-29 Soluble Phosphorus – Collected during the 11/1/2006 storm, Control Roof .......................... 80 

Figure 4-30 Sulfate - Unfiltered Control Roof Samples - December 1, 2006 Storm .................................. 82 

Figure 4-31 Sulfate - Filtered Control Roof Samples - December 1, 2006 Storm ...................................... 82 

Figure 4-32 Sulfate - Unfiltered Green Roof Samples - December 1, 2006 Storm .................................... 83 

Figure 4-33 Sulfate - Filtered Green Roof Samples - December 1, 2006 Storm ........................................ 83 

Figure 4-34 COD - Rainwater Samples - December 1, 2006 Storm ........................................................... 84 

Figure 4-35 COD – Unfiltered Control Roof Samples - December 1, 2006 Storm .................................... 85 

Figure 4-36 COD - Filtered Control Roof Samples - December 1, 2006 Storm......................................... 85 

Figure 4-37 COD - Unfiltered Green Roof Samples - December 1, 2006 Storm ....................................... 86 

Figure 4-38 COD - Filtered Runoff Samples - December 1, 2006 Storm .................................................. 86 

Figure 4-39 Zinc - All Storms ..................................................................................................................... 87 

Figure 4-40 Lead - All Samples .................................................................................................................. 88 

Figure 4-41 Green Roof Location A Temperature Profile for 7/28/06 through 8/1/06 .............................. 93 

Figure 4-42 Green Roof Location B Temperature Profile for 7/28/06 through 8/1/06............................... 94 

Figure 4-43 Control Roof Location C Temperature Profile for 7/28/06 through 8/1/06 ............................ 95 

Figure 4-44 Control Roof Location D Temperature Profile for 7/28/06 through 8/1/06 ............................ 96 

Figure 4-45 Green Roof Location A Temperature Profile for 10/20/06 – 10/25/06 ................................. 101 

Figure 4-46 Green Roof Location B Temperature Profile for 10/20/06 – 10/25/06 ................................. 102 

Figure 4-47 Control Roof Location C Temperature Profile for 10/20/06 – 10/25/06............................... 103 

Figure 4-48 Control Roof Location D Temperature Profile for 10/20/06 – 10/25/06 .............................. 104 

Figure 4-49 Green Roof Location A Temperature Profile for 01/23/07 – 01/29/07 ................................. 108 

Figure 4-50 Green Roof Location B Temperature Profile for 01/23/07 – 01/29/07 ................................. 109 

Figure 4-51 Control Roof Location C Temperature Profile for 01/23/07 – 01/29/07............................... 110 

                                                                               xv
Figure 4-52 Control Roof Location D Temperature Profile for 01/23/07 – 01/29/07 .............................. 111 

Figure 4-53 Summer Net Radiometer at Giant Eagle Data for 7/27/06 – 8/1/06...................................... 116 

Figure 4-54 Fall Net Radiometer at Giant Eagle Data for 10/20/06 – 10/25/06 ....................................... 117 

Figure 4-55 Winter Net Radiometer at Giant Eagle Data for 1/23/07 – 1/29/07 ...................................... 118 

Figure 5-1 Runoff Flow Rates and Rainfall Intensity – April 20, 2008 Storm (Homestead) ................... 123 

Figure 5-2 Runoff and Rainfall Volumes – April 20, 2008 Storm (Homestead) ...................................... 123 

Figure 5-3 Runoff Flow Rates and Rainfall Intensity – June 13-14, 2008 Heavy Storm (Homestead)... 125 

Figure 5-4 Runoff and Rainfall Volumes – June 13-14, 2008 Heavy Storm (Homestead) ..................... 125 

Figure 5-5 Runoff Flow Rates and Rainfall Intensity – September 9, 2008 Storm (Homestead)............. 127 

Figure 5-6 Runoff and Rainfall Volumes – September 9, 2008 Storm (Homestead) ............................... 127 

Figure 5-7 Runoff Flow Rates and Rainfall Intensity – February 18, 2009 Storm (Homestead) ............. 129 

Figure 5-8 Runoff and Rainfall Volumes – February 18, 2009 Storm (Homestead) ................................ 129 

Figure 5-9 Runoff Flow Rates – April 20, 2008 Storm (Giant Eagle) ...................................................... 131 

Figure 5-10 Cumulative Runoff Volumes – April 20, 2008 Storm (Giant Eagle) .................................... 131 

Figure 5-11 Runoff Flow Rates and Rainfall Intensity – June 13-14, 2008 Storm (Giant Eagle) ........... 132 

Figure 5-12 Runoff and Rainfall Volumes – June 13-14, 2008 Storm (Giant Eagle).............................. 133 

Figure 5-13 Runoff Flow Rates and Rainfall Intensity ............................................................................. 134 

Figure 5-14 Normalized Runoff and Rainfall Volumes .................................................................................

                – September 9, 2008 Moderate Storm (Giant Eagle) ........................................................... 134 

Figure 5-15 Runoff Flow Rates and Rainfall Intensity – February 18-19, 2009 Storm (Giant Eagle) ..... 136 

Figure 5-16 Normalized Runoff and Rainfall Volumes – February 18-19, 2009 Storm (Giant Eagle) .... 136 

Figure 6-1 Different measuring parameters related to green and control roof runoff flow rate ............... 139 

Figure 6-2 Time of initial runoff retardation under different soil condition and thickness ...................... 140 

Figure 6-3 Retardation of occurrence (hr) of maximum peak flow with wet/dry & thick/thin soils ....... 141 

Figure 6-4 Probability of occurrence of maximum peak flow rate under dry soil condition .................... 143 

Figure 6-5 Probability of occurrence of maximum peak flow rate under wet soil condition ................... 143 

                                                                      xvi
Figure 6-6 Ratio of water released from green roof to control roof vs. control roof runoff: .................... 145 

Figure 6-7 Ratio of water released from green roof to control roof vs. control roof runoff: .................... 145 

Figure 6-8 Ratio of water released from green roof to control roof vs. control roof runoff: .................... 146 

Figure 6-9 Ratio of water released from green roof to control roof vs. control roof runoff: .................... 146 

Figure 6-10 Comparative runoff performance of thin and thick green roofs for wet and dry soils .......... 150 

Figure 6-11 Vertical Layout of temperature monitoring positions of green (left) and control (right) roof ....

                  ............................................................................................................................................. 153 

Figure 6-12        January, 2008 temperature profile at Homestead. There is no temperature differences

measured between the green and control roofs in cold weather conditions. ............................................. 155 

Figure 6-13 April, 2008 temperature profile at Homestead. Moderate weather conditions .................... 157 

Figure 6-14 June, 2008 temperature profile at Homestead Summer (hot) weather conditions................. 159 

Figure 6-15 January, 2009 temperature profile at Giant Eagle. Winter (cold) weather conditions ......... 161 

Figure 6-16 April 2008 temperature profile at Giant Eagle. Moderate weather conditions .................... 163 

Figure 6-17 June, 2008 temperature profile at Giant Eagle ..................................................................... 165 

Figure 6-18 Day-time monthly average temperature of ambient and soil/roof surface ............................ 168 

Figure 6-19 Night-time monthly average temperature of ambient and soil/roof surface. ......................... 169 

Figure 6-20 Day-time monthly average temperature of green roof soil surface and below roof deck ..... 171 

Figure 6-21 Night-time monthly average temperature of green roof soil surface and below roof deck ... 171 

Figure 6-22 Runoff water from control roof stored in the weir box (Homestead).................................... 173 

Figure 6-23 Runoff water from the green roof stored in the weir box (Homestead) ................................ 173 

Figure 6-24 pH results (Homestead, 2008) ............................................................................................... 174 

Figure 6-25 TSS results (Homestead, 2008) ............................................................................................. 175 

Figure 6-26 Sulfate results (Homestead, 2008) ........................................................................................ 176 

Figure 6-27 Nitrogen results (Homestead, 2008)...................................................................................... 177 

Figure 6-28 Phosphorus results (Homestead, 2008) ................................................................................. 178 

Figure 6-29 COD results (Homestead, 2008) ........................................................................................... 179 

                                                                                   xvii
Figure 6-30 pH results (Giant Eagle, 2006) .............................................................................................. 180 

Figure 6-31 Turbidity results (Giant Eagle, 2006) .................................................................................... 181 

Figure 6-32 Sulfate results (Giant Eagle, 2006) ....................................................................................... 181 

Figure 6-33 Nitrogen results (Giant Eagle, 2006)..................................................................................... 182 

Figure 6-34 Phosphorus results (Giant Eagle, 2006) ................................................................................ 182 

Figure 6-35 COD results (Giant Eagle, 2006) .......................................................................................... 183 

Figure 8-1 Runoff parameters of importance: control and green roof discharges. .................................. 192 

Figure I-1 Runoff Flow Rates and Rainfall intensity – April 28, 2008 Storm (Homestead) ..................... I-7 

Figure I-2 Runoff and rainfall volumes – April 28, 2008 Storm (Homestead) .......................................... I-7 

Figure I-3 Runoff Flow Rates and Rainfall intensity – May 7-8, 2008 Storm (Homestead) ..................... I-8 

Figure I-4 Runoff and rainfall volumes – May 7-8, 2008 Storm (Homestead) ......................................... I-8 

Figure I-5 Runoff flow Rates – May 7-8, 2008 Storm (Giant Eagle) ........................................................ I-9 

Figure I-6 Runoff Volumes – May 7-8, 2008 Storm (Giant Eagle) ........................................................... I-9 

Figure I-7 Runoff Flow Rates and Rainfall intensity – May 9-10, 2008 Storm (Homestead) ................. I-10 

Figure I-8 Runoff and rainfall volumes – May 9-10, 2008 Storm (Homestead) ..................................... I-10 

Figure I-9 Runoff flow Rates – May 9-10, 2008 Storm (Giant Eagle) .................................................... I-11 

Figure I-10 Runoff Volumes – May 9-10, 2008 Storm (Giant Eagle) ..................................................... I-11 

Figure I-11 Runoff Flow Rates and Rainfall intensity – May 11-12, 2008 Storm (Homestead) ............. I-12 

Figure I-12 Runoff and rainfall volumes – May 11-12, 2008 Storm (Homestead) ................................. I-12 

Figure I-13 Runoff flow Rates – May 11-12, 2008 Storm (Giant Eagle) ................................................ I-13 

Figure I-14 Runoff Volumes – May 11-12, 2008 Storm (Giant Eagle) ................................................... I-13 

Figure I-15 Runoff Flow Rates and Rainfall intensity – May 11-12, 2008 Storm (Homestead) ............. I-14 

Figure I-16 Runoff and rainfall volumes – May 11-12, 2008 Storm (Homestead) ................................. I-14 

Figure I-17 Runoff flow Rates – May 11-12, 2008 Storm (Giant Eagle) ................................................ I-15 

Figure I-18 Runoff Volumes – May 11-12, 2008 Storm (Giant Eagle) ................................................... I-15 

Figure I-19 Runoff Flow Rates and Rainfall Intensity – May 17, 2008 Storm (Homestead) .................. I-16 

                                                                         xviii
Figure I-20 Runoff and Rainfall Volumes – May 17, 2008 Storm (Homestead)..................................... I-16 

Figure I-21 Runoff Flow Rates and Rainfall intensity – May 17, 2008 Storm (Giant Eagle) ................. I-17 

Figure I-22 Runoff and Rainfall Volumes – May 17, 2008 Storm (Giant Eagle).................................... I-17 

Figure I-23 Runoff Flow Rates and Rainfall Intensity – May 18, 2008 Storm (Homestead) .................. I-18 

Figure I-24 Runoff and Rainfall Volumes – May 18, 2008 Storm (Homestead)..................................... I-18 

Figure I-25 Runoff Flow Rates and Rainfall intensity – May 18, 2008 Storm (Giant Eagle) ................. I-19 

Figure I-26 Runoff and Rainfall Volumes – May 18, 2008 Storm (Giant Eagle).................................... I-19 

Figure I-27 Runoff Flow Rates and Rainfall Intensity – May 17, 2008 Storm (Homestead) .................. I-20 

Figure I-28 Runoff and Rainfall Volumes – May 17, 2008 Storm (Homestead)..................................... I-20 

Figure I-29 Runoff Flow Rates and Rainfall intensity – May 17, 2008 Storm (Giant Eagle) ................. I-21 

Figure I-30 Runoff and Rainfall Volumes – May 17, 2008 Storm (Giant Eagle).................................... I-21 

Figure I-31 Runoff Flow Rates and Rainfall Intensity – May 18, 2008 Storm (Homestead) .................. I-22 

Figure I-32 Runoff and Rainfall Volumes – May 18, 2008 Storm (Homestead)..................................... I-22 

Figure I-33 Runoff Flow Rates and Rainfall intensity – May 18, 2008 Storm (Giant Eagle) ................. I-23 

Figure I-34 Runoff and Rainfall Volumes – May 18, 2008 Storm (Giant Eagle).................................... I-23 

Figure I-35. Runoff Flow Rates and Rainfall Intensity – May 31, 2008 Storm (Homestead) ................. I-24 

Figure I-36 Runoff and Rainfall Volumes – May 31, 2008 Storm (Homestead)..................................... I-24 

Figure I-37 Runoff Flow Rates and Rainfall intensity – May 31, 2008 Storm (Giant Eagle) ................. I-25 

Figure I-38 Runoff and Rainfall Volumes – May 31, 2008 Storm (Giant Eagle).................................... I-25 

Figure I-39 Runoff Flow Rates – June 3-4, 2008 Storm (Homestead) .................................................... I-26 

Figure I-40 Runoff Volumes – June 3-4, 2008 Storm (Homestead) ........................................................ I-26 

Figure I-41 Runoff Flow Rates and Rainfall intensity – June 3-4, 2008 Storm (Giant Eagle) ................ I-27 

Figure I-42 Runoff and Rainfall Volumes – June 3-4, 2008 Storm (Giant Eagle) .................................. I-27 

Figure I-43 Runoff Flow Rates and Rainfall Intensity – June 5, 2008 Storm (Homestead) .................... I-28 

Figure I-44 Runoff and Rainfall Volumes – June 5, 2008 Storm (Homestead)....................................... I-28 

Figure I-45 Runoff Flow Rates and Rainfall intensity – June 5, 2008 Storm (Giant Eagle) ................... I-29 

                                                                xix
Figure I-46 Runoff and Rainfall Volumes – June 5, 2008 Storm (Giant Eagle)...................................... I-29 

Figure I-47 Runoff Flow Rates and Rainfall Intensity – June 16, 2008 Storm (Homestead) .................. I-30 

Figure I-48 Runoff and Rainfall Volumes – June 16, 2008 Storm (Homestead)..................................... I-30 

Figure I-49 Runoff Flow Rates and Rainfall intensity – June 16, 2008 Storm (Giant Eagle) ................. I-31 

Figure I-50 Runoff and Rainfall Volumes – June 16, 2008 Storm (Giant Eagle).................................... I-31 

Figure I-51 Runoff Flow Rates and Rainfall Intensity – June 20, 2008 Storm (Homestead) .................. I-32 

Figure I-52 Runoff and Rainfall Volumes – June 20, 2008 Storm (Homestead)..................................... I-32 

Figure I-53 Runoff Flow Rates and Rainfall Intensity – June 21, 2008 Storm (Homestead) .................. I-33 

Figure I-54 Runoff and Rainfall Volumes – June 21, 2008 Storm (Homestead)..................................... I-33 

Figure I-55 Runoff Flow Rates and Rainfall Intensity – June 22-23, 2008 Storm (Homestead) ............. I-34 

Figure I-56 Runoff and Rainfall Volumes – June 22-23, 2008 Storm (Homestead) ............................... I-34 

Figure I-57 Runoff Flow Rates – June 22-23, 2008 Storm (Giant Eagle) ............................................... I-35 

Figure I-58 Runoff Volumes – June 22-23, 2008 Storm (Giant Eagle) ................................................... I-35 

Figure I-59 Runoff Flow Rates and Rainfall Intensity – June 26-27, 2008 Storm (Homestead) ............. I-36 

Figure I-60 Runoff and Rainfall Volumes – June 26-27, 2008 Storm (Homestead) ............................... I-36 

Figure I-61 Runoff Flow Rates – June 26-27, 2008 Storm (Giant Eagle) ............................................... I-37 

Figure I-62 Runoff Volumes – June 26-27, 2008 Storm (Giant Eagle) ................................................... I-37 

Figure I-63 Runoff Flow Rates and Rainfall Intensity – June 28, 2008 Storm (Homestead) .................. I-38 

Figure I-64 Runoff and Rainfall Volumes – June 28, 2008 Storm (Homestead)..................................... I-38 

Figure I-65 Runoff Flow Rates – June 28, 2008 Storm (Giant Eagle)..................................................... I-39 

Figure I-66 Runoff Volumes – June 28, 2008 Storm (Giant Eagle) ........................................................ I-39 

Figure I-67 Runoff Flow Rates and Rainfall Intensity – June 29, 2008 Storm (Homestead) .................. I-40 

Figure I-68 Runoff and Rainfall Volumes – June 29, 2008 Storm (Homestead)..................................... I-40 

Figure I-69 Runoff Flow Rates – June 29, 2008 Storm (Giant Eagle)..................................................... I-41 

Figure I-70 Runoff Volumes – June 29, 2008 Storm (Giant Eagle) ........................................................ I-41 

Figure I-71 Runoff Flow Rates and Rainfall Intensity – June 30-July1, 2008 Storm (Homestead) ........ I-42 

                                                                 xx
Figure I-72 Runoff and Rainfall Volumes – June 30-July 1, 2008 Storm (Homestead) .......................... I-42 

Figure I-73 Runoff Flow Rates and Rainfall intensity – June 30-July 1, 2008 Storm (Giant Eagle) ...... I-43 

Figure I-74 Runoff and Rainfall Volumes – June 30-July 1, 2008 Storm (Giant Eagle) ......................... I-43 

Figure I-75 Runoff Flow Rates – July 3, 2008 Storm (Homestead) ........................................................ I-44 

Figure I-76 Runoff Volumes – July 3, 2008 Storm (Homestead) ............................................................ I-44 

Figure I-77 Runoff Flow Rates and Rainfall intensity – July 3, 2008 Storm (Giant Eagle) .................... I-45 

Figure I-78 Runoff and Rainfall Volumes – July 3, 2008 Storm (Giant Eagle) ...................................... I-45 

Figure I-79 Runoff Flow Rates and Rainfall intensity – July 7, 2008 Storm (Giant Eagle) .................... I-46 

Figure I-80 Runoff and Rainfall Volumes – July 7, 2008 Storm (Giant Eagle) ...................................... I-46 

Figure I-81 Runoff Flow Rates and Rainfall intensity – July 8-9, 2008 Storm (Giant Eagle)................. I-47 

Figure I-82 Runoff and Rainfall Volumes – July 8-9, 2008 Storm (Giant Eagle) ................................... I-47 

Figure I-83 Runoff Flow Rates and Rainfall Intensity – July 20, 2008 Storm (Homestead)................... I-48 

Figure I-84 Runoff and Rainfall Volumes – July 20, 2008 Storm (Homestead) ..................................... I-48 

Figure I-85 Runoff Flow Rates and Rainfall Intensity – July 21, 2008 Storm (Homestead)................... I-49 

Figure I-86 Runoff and Rainfall Volumes – July 21, 2008 Storm (Homestead) ..................................... I-49 

Figure I-87 Runoff Flow Rates and Rainfall intensity – July 21, 2008 Storm (Giant Eagle) .................. I-50 

Figure I-88 Runoff and Rainfall Volumes – July 21, 2008 Storm (Giant Eagle) .................................... I-50 

Figure I-89 Runoff Flow Rates and Rainfall Intensity – July 22, 2008 Storm (Homestead)................... I-51 

Figure I-90 Runoff and Rainfall Volumes – July 22, 2008 Storm (Homestead) ..................................... I-51 

Figure I-91 Runoff Flow Rates and Rainfall intensity – July 22, 2008 Storm (Giant Eagle) .................. I-52 

Figure I-92 Runoff and Rainfall Volumes – July 22, 2008 Storm (Giant Eagle) .................................... I-52 

Figure I-93 Runoff Flow Rates and Rainfall Intensity – July 27, 2008 Storm (Homestead)................... I-53 

Figure I-94 Runoff and Rainfall Volumes – July 27, 2008 Storm (Homestead) ..................................... I-53 

Figure I-95 Runoff Flow Rates and Rainfall intensity – July 30, 2008 Storm (Homestead) ................... I-54 

Figure I-96 Runoff and Rainfall Volumes – July 30, 2008 Storm (Homestead) ..................................... I-54 

Figure I-97 Runoff Flow Rates and Rainfall intensity – July 30, 2008 Storm (Giant Eagle) .................. I-55 

                                                                 xxi
Figure I-98 Runoff and Rainfall Volumes – July 30, 2008 Storm (Giant Eagle) .................................... I-55 

Figure I-99 Runoff Flow Rates and Rainfall intensity – August 5, 2008 Storm (Giant Eagle) ............... I-56 

Figure I-100 Runoff and Rainfall Volumes – August 5, 2008 Storm (Giant Eagle) ............................... I-56 

Figure I-101 Runoff Flow Rates and Rainfall Intensity – August 6, 2008 Storm (Homestead) .............. I-57 

Figure I-102 Runoff and Rainfall Volumes – August 6, 2008 Storm (Homestead) ................................ I-57 

Figure I-103 Runoff Flow Rates and Rainfall intensity – August 6, 2008 Storm (Giant Eagle) ............. I-58 

Figure I-104 Runoff and Rainfall Volumes – August 6, 2008 Storm (Giant Eagle) ............................... I-58 

Figure I-105 Runoff Flow Rates and Rainfall Intensity – August 8, 2008 Storm (Homestead) .............. I-59 

Figure I-106 Runoff and Rainfall Volumes – August 8, 2008 Storm (Homestead) ................................ I-59 

Figure I-107 Runoff Flow Rates – August 8, 2008 Storm (Giant Eagle) ................................................ I-60 

Figure I-108 Runoff Volumes – August 8, 2008 Storm (Giant Eagle) .................................................... I-60 

Figure I-109 Runoff Flow Rates and Rainfall Intensity – August 9-10, 2008 Storm (Homestead) ........ I-61 

Figure I-110 Runoff and Rainfall Volumes – August 9-10, 2008 Storm (Homestead) ........................... I-61 

Figure I-111 Runoff Flow Rates – August 10, 2008 Storm (Giant Eagle) .............................................. I-62 

Figure I-112 Runoff Volumes – August 10, 2008 Storm (Giant Eagle) .................................................. I-62 

Figure I-113 Runoff Flow Rates and Rainfall Intensity – August 14, 2008 Storm (Homestead) ............ I-63 

Figure I-114 Runoff and Rainfall Volumes – August 14, 2008 Storm (Homestead) .............................. I-63 

Figure I-115 Runoff Flow Rates – August 14, 2008 Storm (Giant Eagle) .............................................. I-64 

Figure I-116 Runoff Volumes – August 14, 2008 Storm (Giant Eagle) .................................................. I-64 

Figure I-117 Runoff Flow Rates and Rainfall Intensity – August 25, 2008 Storm (Homestead) ............ I-65 

Figure I-118 Runoff and Rainfall Volumes – August 25, 2008 Storm (Homestead) .............................. I-65 

Figure I-119 Runoff Flow Rates and Rainfall Intensity – August 27-28, 2008 Storm (Homestead) ...... I-66 

Figure I-120 Runoff and Rainfall Volumes – August 27-28, 2008 Storm (Homestead) ......................... I-66 

Figure I-121 Runoff Flow Rates and Rainfall intensity – August 27-28, 2008 Storm (Giant Eagle) ...... I-67 

Figure I-122 Runoff and Rainfall Volumes – August 27-28, 2008 Storm (Giant Eagle) ........................ I-67 

Figure I-123 Runoff Flow Rates and Rainfall Intensity – September 9, 2008 Storm (Homestead) ........ I-68 

                                                               xxii
Figure I-124 Runoff and Rainfall Volumes – September 9, 2008 Storm (Homestead) ........................... I-68 

Figure I-125 Runoff Flow Rates and Rainfall intensity – September 9, 2008 Storm (Giant Eagle) ....... I-69 

Figure I-126 Runoff and Rainfall Volumes – September 9, 2008 Storm (Giant Eagle) .......................... I-69 

Figure I-127 Runoff Flow Rates and Rainfall Intensity – September 12, 2008 Storm (Homestead) ...... I-70 

Figure I-128 Runoff and Rainfall Volumes – September 12, 2008 Storm (Homestead) ......................... I-70 

Figure I-129 Runoff Flow Rates and Rainfall intensity – September 12, 2008 Storm (Giant Eagle) ..... I-71 

Figure I-130 Runoff and Rainfall Volumes – September 12, 2008 Storm (Giant Eagle) ........................ I-71 

Figure I-131 Runoff Flow Rates and Rainfall Intensity – September 13, 2008 Storm (Homestead) ...... I-72 

Figure I-132 Runoff and Rainfall Volumes – September 13, 2008 Storm (Homestead) ......................... I-72 

Figure I-133 Runoff Flow Rates and Rainfall intensity – September 13, 2008 Storm (Giant Eagle) ..... I-73 

Figure I-134 Runoff and Rainfall Volumes – September 13, 2008 Storm (Giant Eagle) ........................ I-73 

Figure I-135 Runoff Flow Rates and Rainfall Intensity – October 1, 2008 Storm (Homestead) ............ I-74 

Figure I-136 Runoff and Rainfall Volumes – October 1, 2008 Storm (Homestead) ............................... I-74 

Figure I-137 Runoff Flow Rates and Rainfall Intensity – October 8, 2008 Storm (Homestead) ............ I-75 

Figure I-138 Runoff and Rainfall Volumes – October 8, 2008 Storm (Homestead) ............................... I-75 

Figure I-139 Runoff Flow Rates and Rainfall intensity – October 8, 2008 Storm (Giant Eagle) ............ I-76 

Figure I-140 Runoff and Rainfall Volumes – October 8, 2008 Storm (Giant Eagle) .............................. I-76 

Figure I-141 Runoff Flow Rates and Rainfall Intensity – October 24-25, 2008 Storm (Homestead) ..... I-77 

Figure I-142 Runoff and Rainfall Volumes – October 24-25, 2008 Storm (Homestead) ........................ I-77 

Figure I-143 Runoff Flow Rates and Rainfall intensity – October 24-25, 2008 Storm (Giant Eagle) .... I-78 

Figure I-144 Runoff and Rainfall Volumes – October 24-25, 2008 Storm (Giant Eagle) ....................... I-78 

Figure I-145 Runoff Flow Rates and Rainfall Intensity – November 15, 2008 Storm (Homestead) ...... I-79 

Figure I-146 Runoff and Rainfall Volumes – November 15, 2008 Storm (Homestead) ......................... I-79 

Figure I-147 Runoff Flow Rates and Rainfall intensity – November 15, 2008 Storm (Giant Eagle) ...... I-80 

Figure I-148 Runoff and Rainfall Volumes – November 15, 2008 Storm (Giant Eagle) ........................ I-80 

Figure I-149 Runoff Flow Rates and Rainfall Intensity – November 30, 2008 Storm (Homestead) ...... I-81 

                                                           xxiii
Figure I-150 Runoff and Rainfall Volumes – November 30, 2008 Storm (Homestead) ......................... I-81 

Figure I-151 Runoff Flow Rates– November 30-December 1, 2008 Storm (Giant Eagle) ..................... I-82 

Figure I-152 Runoff Volumes – November 30-December 1, 2008 Storm (Giant Eagle) ........................ I-82 

Figure I-153 Runoff Flow Rates and Rainfall Intensity – February 10, 2009 Storm (Homestead) ......... I-83 

Figure I-154 Runoff and Rainfall Volumes – February 10, 2009 Storm (Homestead)............................ I-83 

Figure I-155 Runoff Flow Rates and Rainfall intensity – February 10, 2009 Storm (Giant Eagle) ........ I-84 

Figure I-156 Runoff and Rainfall Volumes – February 10, 2009 Storm (Giant Eagle)........................... I-84 

Figure I-157 Runoff Flow Rates and Rainfall Intensity – February 18, 2009 Storm (Homestead) ......... I-85 

Figure I-158 Runoff and Rainfall Volumes – February 18, 2009 Storm (Homestead)............................ I-85 

Figure I-159 Runoff Flow Rates and Rainfall intensity – February 18-19, 2009 Storm (Giant Eagle) ... I-86 

Figure I-160 Runoff and Rainfall Volumes – February 18-19, 2009 Storm (Giant Eagle) ..................... I-86 

Figure I-161 Runoff Flow Rates and Rainfall Intensity – March 8-9, 2009 Storm (Homestead)............ I-87 

Figure I-162 Runoff and Rainfall Volumes – March 8-9, 2009 Storm (Homestead) .............................. I-87 

Figure I-163 Runoff Flow Rates and Rainfall intensity – March 8, 2009 Storm (Giant Eagle) .............. I-88 

Figure I-164 Runoff and Rainfall Volumes – March 8, 2009 Storm (Giant Eagle)................................. I-88 

Figure I-165 Runoff Flow Rates and Rainfall intensity – March 25, 2009 Storm (Giant Eagle) ............ I-89 

Figure I-166 Runoff and Rainfall Volumes – March 25, 2009 Storm (Giant Eagle)............................... I-89 

Figure I-167 Runoff Flow Rates and Rainfall intensity – March 26, 2009 Storm (Giant Eagle) ............ I-90 

Figure I-168 Runoff and Rainfall Volumes – March 26, 2009 Storm (Giant Eagle)............................... I-90 

Figure I-169 Runoff Flow Rates and Rainfall intensity – March 27-28, 2009 Storm (Giant Eagle) ....... I-91 

Figure I-170 Runoff and Rainfall Volumes – March 27-28, 2009 Storm (Giant Eagle) ......................... I-91 

Figure I-171 Runoff Flow Rates and Rainfall intensity – March 29, 2009 Storm (Giant Eagle) ............ I-92 

Figure I-172 Runoff and Rainfall Volumes – March 29, 2009 Storm (Giant Eagle)............................... I-92 

Figure II-1 February, 2008 temperature profile at Homestead ................................................................. II-6 

Figure II-2 March, 2008 temperature profile at Homestead ..................................................................... II-7 

Figure II-3 May, 2008 temperature profile at Homestead ........................................................................ II-8 

                                                                    xxiv

More Related Content

What's hot

Using Drought Tolerant Plants in Our Gardens - Acton Garden Club, Massachusetts
Using Drought Tolerant Plants in Our Gardens - Acton Garden Club, MassachusettsUsing Drought Tolerant Plants in Our Gardens - Acton Garden Club, Massachusetts
Using Drought Tolerant Plants in Our Gardens - Acton Garden Club, MassachusettsFrida85y
 
[Challenge:Future] 'paper zero' for envisioned landloss
[Challenge:Future] 'paper zero' for envisioned landloss[Challenge:Future] 'paper zero' for envisioned landloss
[Challenge:Future] 'paper zero' for envisioned landlossChallenge:Future
 
Control of tropical_microclimates_through_landscape_design
Control of tropical_microclimates_through_landscape_designControl of tropical_microclimates_through_landscape_design
Control of tropical_microclimates_through_landscape_designShatabdi Mahanta
 
Planning Green roofs and Green Walls Structural design
Planning Green roofs and Green Walls Structural designPlanning Green roofs and Green Walls Structural design
Planning Green roofs and Green Walls Structural designOláh András Béla
 
Drought Continues Again This Summer: Green Roofs A Growing Option - Oklahoma ...
Drought Continues Again This Summer: Green Roofs A Growing Option - Oklahoma ...Drought Continues Again This Summer: Green Roofs A Growing Option - Oklahoma ...
Drought Continues Again This Summer: Green Roofs A Growing Option - Oklahoma ...Fabienne22Q
 
Dessication near trees cameron 01
Dessication near trees cameron 01Dessication near trees cameron 01
Dessication near trees cameron 01igbindrawan
 
PA: Philadelphia: Green Roof Demonstration Project
PA: Philadelphia: Green Roof Demonstration ProjectPA: Philadelphia: Green Roof Demonstration Project
PA: Philadelphia: Green Roof Demonstration ProjectSotirakou964
 
MN: Anoka County: Curb-Cut Raingardens - Reducing Stormwater Going into Lakes
MN: Anoka County: Curb-Cut Raingardens - Reducing Stormwater Going into LakesMN: Anoka County: Curb-Cut Raingardens - Reducing Stormwater Going into Lakes
MN: Anoka County: Curb-Cut Raingardens - Reducing Stormwater Going into LakesSotirakou964
 
Example for green roof buildings
Example for green roof buildingsExample for green roof buildings
Example for green roof buildingsTanzil Faraz
 
Long-Term Patterns of Vegetation Change Following Fire
Long-Term Patterns of Vegetation Change Following FireLong-Term Patterns of Vegetation Change Following Fire
Long-Term Patterns of Vegetation Change Following FireRoger Blew
 
Lasagna Gardening: Tips from Local Experts - City of Bloomington, Canada
Lasagna Gardening: Tips from Local Experts - City of Bloomington, CanadaLasagna Gardening: Tips from Local Experts - City of Bloomington, Canada
Lasagna Gardening: Tips from Local Experts - City of Bloomington, CanadaFayme4q
 
Landscape Planning for Climatic Adaptation
Landscape Planning for Climatic AdaptationLandscape Planning for Climatic Adaptation
Landscape Planning for Climatic AdaptationImad Kayyali
 
Green roofs and Green walls Introduction
Green roofs and Green walls IntroductionGreen roofs and Green walls Introduction
Green roofs and Green walls IntroductionOláh András Béla
 
Planning Green Roofs and Green Walls Ecological and climatic effects
Planning Green Roofs and Green Walls Ecological and climatic effectsPlanning Green Roofs and Green Walls Ecological and climatic effects
Planning Green Roofs and Green Walls Ecological and climatic effectsOláh András Béla
 
AL: Rain Garden Brochure
AL: Rain Garden BrochureAL: Rain Garden Brochure
AL: Rain Garden BrochureSotirakou964
 

What's hot (18)

Using Drought Tolerant Plants in Our Gardens - Acton Garden Club, Massachusetts
Using Drought Tolerant Plants in Our Gardens - Acton Garden Club, MassachusettsUsing Drought Tolerant Plants in Our Gardens - Acton Garden Club, Massachusetts
Using Drought Tolerant Plants in Our Gardens - Acton Garden Club, Massachusetts
 
[Challenge:Future] 'paper zero' for envisioned landloss
[Challenge:Future] 'paper zero' for envisioned landloss[Challenge:Future] 'paper zero' for envisioned landloss
[Challenge:Future] 'paper zero' for envisioned landloss
 
Control of tropical_microclimates_through_landscape_design
Control of tropical_microclimates_through_landscape_designControl of tropical_microclimates_through_landscape_design
Control of tropical_microclimates_through_landscape_design
 
Planning Green roofs and Green Walls Structural design
Planning Green roofs and Green Walls Structural designPlanning Green roofs and Green Walls Structural design
Planning Green roofs and Green Walls Structural design
 
Green Building Resource Guide
Green Building Resource GuideGreen Building Resource Guide
Green Building Resource Guide
 
Drought Continues Again This Summer: Green Roofs A Growing Option - Oklahoma ...
Drought Continues Again This Summer: Green Roofs A Growing Option - Oklahoma ...Drought Continues Again This Summer: Green Roofs A Growing Option - Oklahoma ...
Drought Continues Again This Summer: Green Roofs A Growing Option - Oklahoma ...
 
Dessication near trees cameron 01
Dessication near trees cameron 01Dessication near trees cameron 01
Dessication near trees cameron 01
 
1987sep66
1987sep661987sep66
1987sep66
 
PA: Philadelphia: Green Roof Demonstration Project
PA: Philadelphia: Green Roof Demonstration ProjectPA: Philadelphia: Green Roof Demonstration Project
PA: Philadelphia: Green Roof Demonstration Project
 
2. Microclimate
2. Microclimate2. Microclimate
2. Microclimate
 
MN: Anoka County: Curb-Cut Raingardens - Reducing Stormwater Going into Lakes
MN: Anoka County: Curb-Cut Raingardens - Reducing Stormwater Going into LakesMN: Anoka County: Curb-Cut Raingardens - Reducing Stormwater Going into Lakes
MN: Anoka County: Curb-Cut Raingardens - Reducing Stormwater Going into Lakes
 
Example for green roof buildings
Example for green roof buildingsExample for green roof buildings
Example for green roof buildings
 
Long-Term Patterns of Vegetation Change Following Fire
Long-Term Patterns of Vegetation Change Following FireLong-Term Patterns of Vegetation Change Following Fire
Long-Term Patterns of Vegetation Change Following Fire
 
Lasagna Gardening: Tips from Local Experts - City of Bloomington, Canada
Lasagna Gardening: Tips from Local Experts - City of Bloomington, CanadaLasagna Gardening: Tips from Local Experts - City of Bloomington, Canada
Lasagna Gardening: Tips from Local Experts - City of Bloomington, Canada
 
Landscape Planning for Climatic Adaptation
Landscape Planning for Climatic AdaptationLandscape Planning for Climatic Adaptation
Landscape Planning for Climatic Adaptation
 
Green roofs and Green walls Introduction
Green roofs and Green walls IntroductionGreen roofs and Green walls Introduction
Green roofs and Green walls Introduction
 
Planning Green Roofs and Green Walls Ecological and climatic effects
Planning Green Roofs and Green Walls Ecological and climatic effectsPlanning Green Roofs and Green Walls Ecological and climatic effects
Planning Green Roofs and Green Walls Ecological and climatic effects
 
AL: Rain Garden Brochure
AL: Rain Garden BrochureAL: Rain Garden Brochure
AL: Rain Garden Brochure
 

Similar to Pitt Green Roof Finalreport Ex Sum With T[1]

Construction of an Elevated Garden - The Basics of Growing Green Roofs
Construction of an Elevated Garden - The Basics of Growing Green RoofsConstruction of an Elevated Garden - The Basics of Growing Green Roofs
Construction of an Elevated Garden - The Basics of Growing Green RoofsFarrah85p
 
Gulf Coast Green 2012 Joe Webb
Gulf Coast Green 2012 Joe WebbGulf Coast Green 2012 Joe Webb
Gulf Coast Green 2012 Joe WebbHayley Pallister
 
Green Building:Energy Efficient Air-Conditioning
Green Building:Energy Efficient Air-ConditioningGreen Building:Energy Efficient Air-Conditioning
Green Building:Energy Efficient Air-Conditioningjvitek
 
Green Roof Poster
Green Roof PosterGreen Roof Poster
Green Roof PosterJunjie Chen
 
Factors affecting micro climate
Factors affecting micro climateFactors affecting micro climate
Factors affecting micro climateAnand Godson
 
Introduction to Green Roofs
Introduction to Green RoofsIntroduction to Green Roofs
Introduction to Green RoofsRob Freeman
 
Green roof promo 28 02 12
Green roof promo 28 02 12Green roof promo 28 02 12
Green roof promo 28 02 12Lars Tolenaars
 
Green Walls and Indoor Air Quality
Green Walls and Indoor Air QualityGreen Walls and Indoor Air Quality
Green Walls and Indoor Air QualityElisaMendelsohn
 
Rooftop Greening and Local Climate
Rooftop Greening and Local ClimateRooftop Greening and Local Climate
Rooftop Greening and Local ClimateFarrah85p
 
Performance evaluation of solar-PV integrated green roof in Singapore
Performance evaluation of solar-PV integrated green roof in SingaporePerformance evaluation of solar-PV integrated green roof in Singapore
Performance evaluation of solar-PV integrated green roof in SingaporeAakanksha Dubey
 
Urban Heat Island
Urban Heat IslandUrban Heat Island
Urban Heat IslandNaveen Bind
 

Similar to Pitt Green Roof Finalreport Ex Sum With T[1] (20)

Construction of an Elevated Garden - The Basics of Growing Green Roofs
Construction of an Elevated Garden - The Basics of Growing Green RoofsConstruction of an Elevated Garden - The Basics of Growing Green Roofs
Construction of an Elevated Garden - The Basics of Growing Green Roofs
 
Green roofs sungoo
Green roofs sungooGreen roofs sungoo
Green roofs sungoo
 
Gulf Coast Green 2012 Joe Webb
Gulf Coast Green 2012 Joe WebbGulf Coast Green 2012 Joe Webb
Gulf Coast Green 2012 Joe Webb
 
Green Building:Energy Efficient Air-Conditioning
Green Building:Energy Efficient Air-ConditioningGreen Building:Energy Efficient Air-Conditioning
Green Building:Energy Efficient Air-Conditioning
 
Green Roof Poster
Green Roof PosterGreen Roof Poster
Green Roof Poster
 
Study On Greenery OED
Study On Greenery OEDStudy On Greenery OED
Study On Greenery OED
 
Factors affecting micro climate
Factors affecting micro climateFactors affecting micro climate
Factors affecting micro climate
 
Introduction to Green Roofs
Introduction to Green RoofsIntroduction to Green Roofs
Introduction to Green Roofs
 
Green roof promo 28 02 12
Green roof promo 28 02 12Green roof promo 28 02 12
Green roof promo 28 02 12
 
Green roof promo 28 02 12
Green roof promo 28 02 12Green roof promo 28 02 12
Green roof promo 28 02 12
 
Heat island
Heat islandHeat island
Heat island
 
Protected Cultivation
Protected CultivationProtected Cultivation
Protected Cultivation
 
Green Walls and Indoor Air Quality
Green Walls and Indoor Air QualityGreen Walls and Indoor Air Quality
Green Walls and Indoor Air Quality
 
Rooftop Greening and Local Climate
Rooftop Greening and Local ClimateRooftop Greening and Local Climate
Rooftop Greening and Local Climate
 
Dusty Gedges - EFB
Dusty Gedges - EFBDusty Gedges - EFB
Dusty Gedges - EFB
 
Performance evaluation of solar-PV integrated green roof in Singapore
Performance evaluation of solar-PV integrated green roof in SingaporePerformance evaluation of solar-PV integrated green roof in Singapore
Performance evaluation of solar-PV integrated green roof in Singapore
 
Urban Heat Island
Urban Heat IslandUrban Heat Island
Urban Heat Island
 
ECO Design: Green Roofs
ECO Design: Green Roofs ECO Design: Green Roofs
ECO Design: Green Roofs
 
ISAS_2010
ISAS_2010ISAS_2010
ISAS_2010
 
REU Poster Kubiniec
REU Poster KubiniecREU Poster Kubiniec
REU Poster Kubiniec
 

Pitt Green Roof Finalreport Ex Sum With T[1]

  • 1. Draft Final Report: Monitoring Protocol and Data Collection: Comparison of the Runoff Water Quantity, Quality and Thermal Performances of Two Green Roof Technologies; Thin vs. Thick University of Pittsburgh Project Number 703543 August 2009 Prepared for: Three Rivers Wet Weather Sub Grant # 03-01-GRM Pittsburgh, Pennsylvania Prepared by: The University of Pittsburgh, Swanson School of Engineering Department of Civil & Environmental Engineering 949 Benedum Hall, 3700 O’Hara St. Pittsburgh, Pennsylvania 15261 PRINCIPAL INVESTIGATOR Dr. Ronald D. Neufeld, P.E. Board Certified Environmental Engineer Professor of Civil & Environmental Engineering University of Pittsburgh Pittsburgh, PA 15261 neufeld@pitt.edu CONTRIBUTING AUTHORS Dr. Jason Monnell, Research Assistant Professor, University of Pittsburgh; Dr. Robert J. Ries 1 Assistant Professor in Sustainability; University of Florida with University of Pittsburgh Graduate Students: Mr. Viral Shah, Mr. Daniel Bliss, Ms. Jiayin Ni Department of Civil & Environmental Engineering 1 Current Address: RNK 304 / Box 115703, Rinker School of Building Construction, University of Florida Gainesville, FL 32611-5703
  • 2. EXECUTIVE SUMMARY This report presents the use of a green roof compared to a conventional (control) roof using modern construction methods. A green roof has many environmental, economic, and aesthetic benefits over a conventional roof. This study examined the environmental benefits of a thick and a thin green roof, with focus on stormwater management and thermal benefits. The results demonstrated that in comparison to the conventional roofs, green roofs retained significantly more water, moderated temperature increases and decreases of the roof, and had marginal effect on the chemistry of the discharged runoff. Two different technologies of green roofs were analyzed and the enhanced performance of two green roofs over their associated conventional roof was found to depend on soil (roof) thickness. Concise descriptions and major distinctions between control and green roof, and comparisons of thick and thin green roof technologies are summarized in Table 0-1 and Table 0-2 of this executive summary. Monitoring systems were developed to capture the water flows and temperature profiles of both the green roof and control roof. The monitoring systems captured electronic data from sensors and transmitted them to the University of Pittsburgh via modem and electronic network. The portion of the roof at Giant Eagle devoted to this research had conventional and green roof segment of sizes 3,520 square feet each while both the conventional and green roofs at Homestead were approximately 2,000 sq. ft. each. The monitoring systems at two sites included (for green and control roofs) separate flumes (at Giant Eagle) or weir boxes (at Homestead) ultrasonic sensors; soil moisture sensors, rain gauge, thermocouples, temperature probes, and net radiometers to measure the runoff and thermal performance of the two roof types over time. Runoff water samples from each roof were collected at both sites and tested in the laboratory for water quality characteristics. The system was implemented and environmental data was collected continuously over a first seven-month period from July 2006 through January 2007 at the Giant Eagle location. This phase encompassed periods of summer, fall, and winter climate conditions. A total of 24 storms, ranging from 0.07 inches to 2.2 inches, occurred during that test period, and the chemical data from most storms was captured during the first phase. A second phase of the study was implemented from April 2008 through April 2009 monitoring both the Homestead and Giant Eagle sites. In sum total, the sensors and data loggers at the two sites recorded 95 storms ranging from 0.02 inches to 2.42 inches of precipitation. i
  • 3. Table 0-1 General Characteristics of the Control and Green roof Green roof Control roof 1% to 100% of overall flow rate reduction Usually has a higher peak flow rate (compared to control roof) observed – than green roof, but became less high percent under light storm and low different for heavy storm and high percent under heavy storm soil moisture content 2% to 100% reduction of total runoff Usually in a higher level runoff than volume (compared to control roof) – the runoff for green roof – more green roof retained all the stormwater for stormwater discharged from control Runoff quantity 100% roof performances Comparing with control roof, initial runoff retardation is ranged from 0 to 16.7 hours. Time delay of maximum peak flow Runoff water started to discharge in a is between 0 to 16 hours. Runoff short time after occurrence of rainfall. discharge begins after 0.035-0.6 inches of water released from control roof, depending on soil moisture condition. The soil moisture content, soil thickness as well as the extent of rainfall influenced runoff quantity performances of green roof. Approximately 90°F (or below) of surface Approximately 100°F (or above) of temperature observed on a hot summer surface temperature observed on a hot day summer day Large thermal fluctuation from day to Experience less thermal fluctuation from night, particularly during summer. day to night; protect roof membrane and Exposure of the roof membrane to reduce its thermal stress during days with ambient conditions may reduce its Thermal high ambient temperature usage life performances Solar energy absorbed by the system and Reflect more solar energy to the for photosynthesis by the vegetation. atmosphere and may result in an Water trapped in soil can be evaporated urban heat island effect. resulting in cooling. During the night in summer, the green roof had a slightly higher roof membrane surface temperature than the control roof, which indicates that a green roof releases heat slowly. No first flush detected Neutralize the acidic rainfall Runoff quality No change in water runoff quality. (Homestead); act as a filter for pollutant Direct flow to the roof drain. performances particles from atmosphere Fertilization during the summer of 2008 by the owner of the Homestead green roof influenced the runoff quality results. ii
  • 4. Table 0-2 Characteristic differences between the thin and thick Green roof technologies Thin roof (Homestead) Thick roof (Giant Eagle) Thickness of soil medium: 1 ½ inches Thickness of soil medium: 4 ½ inches. Manufacturer: Green Living Manufacturer: The Garland Company. Technology General features Type of plants: a mix of sedum Type of plants: a mix of sedum acre,album, sexagular, kamtschaticum, kamtschaticum,worm grass sedum and etc. thymus x citriodorus For total runoff volume, large capacity For total runoff volume, more of water retention under dry soil stormwater discharged under dry soil condition, due to an additional 4-inches condition, due to the limited soil of soil thickness as compared to the thin thickness and retention capacity. roof. Runoff quantity Initial runoff retardation is ranged Initial time of retardation of runoff performance from 0 to 8.7 hours. Significant ranged from 0 to 16.7 hours. Significant retardation of time of maximum peak retardation of time of maximum peak flow for initially dry soils. flow for initially dry soils. For initially wet soils: small differences in time of runoff or retardation of peak flow were observed between thin and thick roofs. Reflect less heat and lower ambient temperature; less insulation effect Better insulation due to thicker soil Thermal between the roof surface and roof deck substrate. performances below No significant differences in thermal performance between the two green roofs were found during cold weather months. The runoff samples from two sites indicated different rainfall pH, however metal Runoff quality constituents were marginally less at Giant Eagle. No statistically significant performances differences were observed in runoff quality at either green roof except for N & P. iii
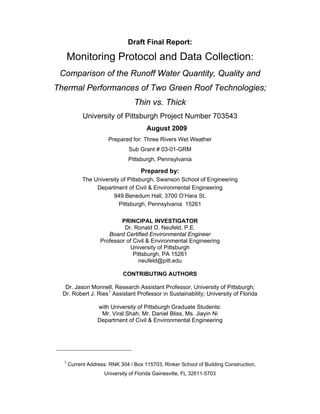
  • 5. Part I: Water Quality Results The results of two green roof studies indicate the potential of green roofs as an effective system in stormwater management. The benefits of a green roof over the conventional membrane “control roof” are as follows: 1. The peak flow rate (normalized as cubic feet per second of flow per unit roof area) from the green roof was lower than the control roof in most cases. In the first study phase, the reduction of the runoff from the thick (Giant Eagle) green roof as compared to the control roof was between 5 to 70%. The peak flow rate reductions during the second study phase were in a ranged from 1% to 100%. The highest comparative reduction in flow rate occurred during light storms while smaller flow rate reductions occurred under heavy storm conditions. A graphic relationship of the water runoff parameters considered to be of importance for this research is shown on the sketch of Figure 0-1. The dashed line represents a typical runoff flow rate of control roof and the solid line represents the green roof runoff flow rate. The designations “A, B and C” are three significant performance parameters of (A) time of initial runoff retardation, (B) time of peak runoff retardation and (C) magnitude of differences in normalized quantities peak runoff flow rates. For most rainfall events, both the time of occurrence and magnitude of green roof runoff water flow rates are attenuated as compared to control roof flow rates. This observation however was highly dependent on the soil moisture content (relating to time of occurrence of the previous storm event) and overall magnitude of rainfall precipitation. There was virtually no difference between the green roof water retardation of retention capability once the soil reached water saturation (due to heavy and/or prolonged rain fall events). iv
  • 6. (C Flow Rate ) Control (B) Roof Flow Green Roof Flow (A) Time Figure 0-1 Runoff parameters of importance: control and green roof discharges. (A) Initial runoff retardation: the time difference between which green roof starts discharges stormwater and control roof starts to discharge; (B) Maximum peak flow retardation: the difference in time between the control roof and the green roof of occurrence of normalized maximum peak flows. (C) Maximum normalized peak flow rate variation: the difference in maximum peak normalized flow rates between the control roof runoff and green roof runoff. 2. The total quantity of runoff from the green roof was dependent on the soil moisture, the intensity, and duration of the storm. As soil moisture content increased, the capacity of the green roofs to retain water decreased. For heavy storms, the reduction in total flow was less than that under lighter storms, but the reduction was still observable. The reduction observed in both study phases ranged from 100% for the lightest storm to 2% for the heaviest. A reduction of 20% in the total runoff volume was observed in several large storms. For smaller storms (usually less than 0.1 inch of precipitation or slightly higher) where the soil was dry, 100% of reduction of the total runoff volume was often observed. In these cases, the green roof was able to absorb all the stormwater and no runoff was measured. v
  • 7. 3. The thickness layer of soil media as well as soil moisture of the green roof impacts the capacity of stormwater retention. Under dry soil conditions, the thick roof (at the Giant Eagle site) retained more water than the thin roof (at the Homestead site). A larger mass of dry soil (from a thicker soil layer) has more available capacity (field capacity) for water retention. However, as the soils became saturated, any additional water that fell on the green roof soil was discharged and little differences in further water retention are observed. The water cup reservoir specifically incorporated into the thin roof technology is designed to retain part of the stormwater and may yield additional water storage capacity, but this effect was minimally observable. The water cup reservoir, however, can provide moisture during prolonged drought conditions for the plants on the thin roof, and thus has an important benefit. 4. The time of initial discharge from green roof was significantly delayed relative to the initial time of discharge from the control roof. The average retardation time for green roof runoff under dry soil condition was 3 hours behind the control roof runoff and only 1.5 hours under wet soil condition. It was observed that towards the end of a storm, the runoff from green roof has a prolonged tail consisting of a very low flow rate that did not occur for the control roof. This tailing of flow occurred for a significant amount of time after rain ceased and the runoff from the control roof stopped. vi
  • 8. Part II: Temperature Profile Results There are significant benefits in reduced heat gain and loss that are observed to be a function of roof type and thickness. The most significant results are: 1. The temperature profile shows the stone ballast covering the “rubber” membrane on the control roof at Giant Eagle cannot protect the membrane from the ambient conditions and incoming radiation. Despite the light color of the stone ballast on the roof surface, that membrane surface reached extreme temperatures on a hot summer day. During summer time, the control roof surface reached a temperature above 100°F when the ambient temperature is close to 90°F. The green roof surface temperature remained at or below 90°F during the day, which was about the same as ambient temperature. The green roof provided protection to the roof membrane and reduced the thermal stress on the roof membrane during days with ambient temperatures greater than 75°F. During summer nights, the green roof temperature closely followed the ambient temperature. These observations suggest that the green roof has the ability to absorb and release of energy that it was exposed to during the day. 2. Temperature profiles show that the wintertime surface temperature of the green roof and control roof showed little difference during the day when the sun shines. During the night, however, the green roof was able to retain a portion of the heat it absorbed during the day. Although the temperature profiles suggest that the thermal benefits of the green roof in winter is not as significant as it is the summer, the green roof was able to save a small amount of energy by showing reduced heat loss in comparison to the control roof. 3. The net radiation at the site was observed to influence the roof performance. In the summer and fall when the roof is exposed to 400-800 W*m-2 net of incoming radiation throughout the day, the control roof easily stores this energy, while the soil and plants on the green roof store and use that energy. The data from the summer and fall indicate that the green roof shows slightly higher positive radiation during the day, meaning the green roof is reflecting less energy during the day, and slightly higher negative radiation at night, meaning the green roof is releasing less energy at night. This suggests there is significant potential for green roofs in mitigating the urban heat island effect. During the winter the two roofs perform nearly the same as the short days, lower sun, and shading by the apartment building greatly limited the energy transfer during the day. vii
  • 9. Part III: Water Quality Considerations Runoff water quality results for the green roof and associated control roof are compared. In addition, T-statistics at the 95% confidence level are utilized to evaluate if the green roof and control roof runoff water quality concentration differences are statistically significant. This is done for both locations. The major conclusions drawn from this information are: 1. No “first flush” effect (elevation in contaminant level during the initial water runoff) for the green roof was observed for any test parameter. The “first flush” effect was noticeable for the control roof. 2. There was a significant difference between the green roof and control roof pH at the Homestead site indicating the ability of that green roof to neutralize acidic stormwater (from acid rain falling at that location). 3. There is a statistically significant difference in total suspended solids (TSS) between the control and green runoff samples at Homestead, with a relatively lower concentration coming from the green roof. There was not such a difference observed at the Giant Eagle site for TSS. 4. The results of Chemical Oxygen Demand (COD) at Giant Eagle or Homestead sites do not show any significant differences between the control and green roof. Metal ions were not detected at significant levels from runoff samples with the exception of zinc. 5. Chemical fertilization of the Homestead green roof by the building owner during the latter part of the project period was observed to influence green roof runoff water quality. All nutrient contaminants in runoff waters from the Homestead green roof show a significant increase in concentration after fertilization; however, the foliage appeared beautiful. In summary, green roof technology is an effective and practical way to improve the stormwater management, thermal performance, as well as stormwater quality. The body of the report document provides supporting data and analysis leading to technical insights for the use of this “green” technology for urban stormwater management. viii
  • 10. ACKNOWLEDGEMENTS The principal investigator and contributing authors which to thank John Schombert (director) and Janie French (project manager) of the 3-Rivers Wet Weather Demonstration Program for their financial support and encouragement, and ability to expedite the installation of green roof technologies at two locations within the Pittsburgh, PA area. We thank the Giant Eagle Corporation and Ms Fran Rossi from Echo Real Estate for their cooperation in the installation of the thick roof technology and patience in allowing students to monitor that roof located at the site of a large store and condo complex. We thank Mr. Daniel Steinitz, owner and “hands-on” project manager for the rehabilitation and creation of a multi-unit apartment building in Homestead, PA for facilitating the installation of the thin roof technology and for his patience in allowing students to monitor that roof site. In addition, the PI wishes to acknowledge and thank the multiple graduate students whose diligent assistance made accomplishing this project possible; Dr. Robert Ries, co-principal investigator and now at the University of Florida-Gainesville; and Dr. Jason Monnell, Research Associate Professor at the University of Pittsburgh. Ronald D. Neufeld, PE, PhD Board Certified Environmental Engineer Professor of Civil Engineering University of Pittsburgh ix
  • 11. TABLE OF CONTENTS EXECUTIVE SUMMARY ..................................................................................... i  ACKNOWLEDGEMENTS .................................................................................. ix  1.  MOTIVATION AND OBJECTIVES OF THE STUDY ................................1  2.  INTRODUCTION TO GREEN ROOFS .........................................................3  2.1  Types of green roofs ...................................................................................3  2.2  History of green roofs .................................................................................5  2.3  Components of green roofs.........................................................................9  2.4  Environmental Benefits of Green Roofs ...................................................11  2.5  Economic benefits of green roofs .............................................................13  2.6  Aesthetic benefits of green roofs ..............................................................14  2.7  Green roof demonstration projects ..........................................................15  3.  3 RIVERS WET WEATHER GREEN ROOF ................................................. DEMONSTRATION PROJECT ....................................................................28  3.1  The Shadyside Giant Eagle Location .......................................................29  3.2  The Homestead Green Roof .....................................................................47  x
  • 12. 4.  RESULTS AND DISCUSSION .......................................................................55  4.1  Giant Eagle Runoff performance .............................................................55  4.2  Discussion: Giant Eagle Runoff ...............................................................67  4.3  Runoff Quality ..........................................................................................74  4.4 Discussion: Giant Eagle Runoff Quality Results .....................................89  4.5  Thermal Performance of the Giant Eagle Roof .......................................91  4.6  Net Radiation ..........................................................................................115  4.7  Discussion: Thermal Data......................................................................119  5.  COMPARISON OF GIANT EAGLE AND HOMESTEAD ........................... GREEN ROOF TECHNOLOGIES ..............................................................121  5.1  Runoff quantity performances ................................................................121  6.  DISCUSSION AND ANALYSIS: COMPARATIVE RUNOFF ..................... QUALITY, AND HEAT ABSORPTION .....................................................137  6.1  Runoff Retardation (Delay from rain onset to time when flow begins) .139  6.2  Runoff Quantity Reduction .....................................................................148  6.3  Thermal performance .............................................................................151  6.4  Physical and Chemical Environmental Analysis of Runoff Waters .......172  xi
  • 13. 7.  SUMMARY OF EXPERIMENTS ................................................................188  8.  CONCLUSIONS .............................................................................................191  9.  SUGGESTIONS FOR FURTHER STUDIES .............................................196  10. REFERENCES................................................................................................197  APPENDIX I.  STORMWATER RUNOFF DATA ........................................... I-1  APPENDIX II.  TEMPERATURE PROFILES ............................................... II-1  xii
  • 14. LIST OF FIGURES Figure 0-1 Runoff parameters of importance: control and green roof discharges. ...................................... v  Figure 2-1 Hanging gardens at the Tower of Babylon were an early example of green roofs. .................... 6  Figure 2-2 Examples of green roofs at different locations in around the world. .......................................... 8  Figure 2-3 Stormwater hydrograph before and after urbanization.............................................................. 12  Figure 3-1 Post-installation photographs of the Shadyside Giant Eagle control roof and green roof ........ 30  Figure 3-2 Monitoring locations at the Shadyside Giant Eagle roof........................................................... 31  Figure 3-3 Relative humidity sensor for recording ambient air temperature .............................................. 34  Figure 3-4 Thermocouple wire for temperature monitoring Attached to Tripod (Giant Eagle) ................. 36  Figure 3-5 Net radiometer for measuring net radiation at the roof surface (Giant Eagle) .......................... 37  Figure 3-6 Wind Sentry Set (Giant Eagle) ................................................................................................. 38  Figure 3-7 Rain Gauge Installed on the Green Roof (Giant Eagle) ............................................................ 39  Figure 3-8 Two flumes (circled) for discharging stormwater runoff (Giant Eagle) ................................... 40  Figure 3-9 Ultrasonic sensors installed atop the flumes for measuring stormwater runoff (Giant Eagle).. 40  Figure 3-10 Soil Moisture Sensor ............................................................................................................... 41  Figure 3-11 Solenoid Valve Sampling Manifold (Giant Eagle) ................................................................. 43  Figure 3-12 Solenoid Valves and Sample Bottles ...................................................................................... 43  Figure 3-13 National Instrument Fieldpoint Dataloggers. .......................................................................... 47  Figure 3-14 Typical Green Roof Cross-Section (similar to Giant Eagle) ................................................... 48  Figure 3-15 GLT Green Roof system Cross-Section similar to the one installed at the Homestead site. .. 48  Figure 3-16 GLT Green Roof at Homestead ............................................................................................. 49  Figure 3-17 Control Roof at Homestead .................................................................................................... 50  Figure 3-18 Drainage system at Homestead Site (located in the basement of the building). .................... 51  Figure 3-19 Ultrasonic sensors monitored changes in water level over weirs at the Homestead Site. ...... 52  Figure 3-20 National Instruments Fieldpoint Dataloggers at Homestead Site........................................... 52  xiii
  • 15. Figure 3-21 Runoff sample collection system at Homestead site. ............................................................. 53  Figure 4-1 Runoff as Rainfall - November 11, 2006 Storm ....................................................................... 58  Figure 4-2 Runoff Flow Rates - November 11, 2006 Storm....................................................................... 58  Figure 4-3 Runoff Volumes - November 11, 2006 Storm .......................................................................... 59  Figure 4-4 Runoff Reduction - November 11, 2006 Storm ........................................................................ 59  Figure 4-5 Runoff as Rainfall - October 31, 2006 Storm ........................................................................... 61  Figure 4-6 Runoff Flow Rates - October 31, 2006 Storm........................................................................... 61  Figure 4-7 Runoff Volumes - October 31, 2006 Storm .............................................................................. 62  Figure 4-8 Runoff Reduction - October 31, 2006 Storm ............................................................................ 62  Figure 4-9 Green Roof Water Content - October 31, 2006 Storm. ............................................................. 63  Figure 4-10 Runoff as Rainfall - October 17, 2006 Storm ......................................................................... 64  Figure 4-11 Runoff Flow Rates - October 17, 2006 Storm......................................................................... 65  Figure 4-12 Runoff Volumes - October 17, 2006 Storm ............................................................................ 65  Figure 4-13 Runoff Reduction - October 17, 2006 Storm .......................................................................... 66  Figure 4-14 Green Roof Moisture Content - October 17, 2006 Storm ....................................................... 66  Figure 4-15 Soil Water Content versus Rainfall Depth at the Start of Runoff Flow .................................. 70  Figure 4-16 Intensity-Duration-Frequency Curve - Shadyside Green Roof and NOAA Data ................... 72  Figure 4-17 Fraction Runoff reductions versus Rainfall Depth (inches) .................................................... 72  Figure 4-18 Fraction Runoff reductions versus Storm Duration ................................................................ 73  Figure 4-19 Fraction Runoff reductions versus Storm Intensity ................................................................. 73  Figure 4-20 Turbidity - Rainwater Samples ............................................................................................... 75  Figure 4-21 Turbidity in runoff during the 12/1/2006 storm - Control Roof Samples ............................... 75  Figure 4-22 Turbidity - Green Roof Samples - December 1, 2006 Storm .................................................. 76  Figure 4-23 Turbidity of samples collected during the 11/15/2006 storm: Control Roof .......................... 76  Figure 4-24 Turbidity of samples collected during the 11/15/2006 storm: Green Roof ............................. 77  Figure 4-25 Phosphorus - Rainwater Samples - November 11, 2006 Storm .............................................. 78  xiv
  • 16. Figure 4-26 Phosphorus - Unfiltered Green Roof Samples collected during the 11/1/2006 storm ............ 79  Figure 4-27 Phosphorus - Filtered Green Roof Samples - November 1, 2006 Storm ................................ 79  Figure 4-28 Phosphorus - Unfiltered Control Roof Samples - November 1, 2006 Storm .......................... 80  Figure 4-29 Soluble Phosphorus – Collected during the 11/1/2006 storm, Control Roof .......................... 80  Figure 4-30 Sulfate - Unfiltered Control Roof Samples - December 1, 2006 Storm .................................. 82  Figure 4-31 Sulfate - Filtered Control Roof Samples - December 1, 2006 Storm ...................................... 82  Figure 4-32 Sulfate - Unfiltered Green Roof Samples - December 1, 2006 Storm .................................... 83  Figure 4-33 Sulfate - Filtered Green Roof Samples - December 1, 2006 Storm ........................................ 83  Figure 4-34 COD - Rainwater Samples - December 1, 2006 Storm ........................................................... 84  Figure 4-35 COD – Unfiltered Control Roof Samples - December 1, 2006 Storm .................................... 85  Figure 4-36 COD - Filtered Control Roof Samples - December 1, 2006 Storm......................................... 85  Figure 4-37 COD - Unfiltered Green Roof Samples - December 1, 2006 Storm ....................................... 86  Figure 4-38 COD - Filtered Runoff Samples - December 1, 2006 Storm .................................................. 86  Figure 4-39 Zinc - All Storms ..................................................................................................................... 87  Figure 4-40 Lead - All Samples .................................................................................................................. 88  Figure 4-41 Green Roof Location A Temperature Profile for 7/28/06 through 8/1/06 .............................. 93  Figure 4-42 Green Roof Location B Temperature Profile for 7/28/06 through 8/1/06............................... 94  Figure 4-43 Control Roof Location C Temperature Profile for 7/28/06 through 8/1/06 ............................ 95  Figure 4-44 Control Roof Location D Temperature Profile for 7/28/06 through 8/1/06 ............................ 96  Figure 4-45 Green Roof Location A Temperature Profile for 10/20/06 – 10/25/06 ................................. 101  Figure 4-46 Green Roof Location B Temperature Profile for 10/20/06 – 10/25/06 ................................. 102  Figure 4-47 Control Roof Location C Temperature Profile for 10/20/06 – 10/25/06............................... 103  Figure 4-48 Control Roof Location D Temperature Profile for 10/20/06 – 10/25/06 .............................. 104  Figure 4-49 Green Roof Location A Temperature Profile for 01/23/07 – 01/29/07 ................................. 108  Figure 4-50 Green Roof Location B Temperature Profile for 01/23/07 – 01/29/07 ................................. 109  Figure 4-51 Control Roof Location C Temperature Profile for 01/23/07 – 01/29/07............................... 110  xv
  • 17. Figure 4-52 Control Roof Location D Temperature Profile for 01/23/07 – 01/29/07 .............................. 111  Figure 4-53 Summer Net Radiometer at Giant Eagle Data for 7/27/06 – 8/1/06...................................... 116  Figure 4-54 Fall Net Radiometer at Giant Eagle Data for 10/20/06 – 10/25/06 ....................................... 117  Figure 4-55 Winter Net Radiometer at Giant Eagle Data for 1/23/07 – 1/29/07 ...................................... 118  Figure 5-1 Runoff Flow Rates and Rainfall Intensity – April 20, 2008 Storm (Homestead) ................... 123  Figure 5-2 Runoff and Rainfall Volumes – April 20, 2008 Storm (Homestead) ...................................... 123  Figure 5-3 Runoff Flow Rates and Rainfall Intensity – June 13-14, 2008 Heavy Storm (Homestead)... 125  Figure 5-4 Runoff and Rainfall Volumes – June 13-14, 2008 Heavy Storm (Homestead) ..................... 125  Figure 5-5 Runoff Flow Rates and Rainfall Intensity – September 9, 2008 Storm (Homestead)............. 127  Figure 5-6 Runoff and Rainfall Volumes – September 9, 2008 Storm (Homestead) ............................... 127  Figure 5-7 Runoff Flow Rates and Rainfall Intensity – February 18, 2009 Storm (Homestead) ............. 129  Figure 5-8 Runoff and Rainfall Volumes – February 18, 2009 Storm (Homestead) ................................ 129  Figure 5-9 Runoff Flow Rates – April 20, 2008 Storm (Giant Eagle) ...................................................... 131  Figure 5-10 Cumulative Runoff Volumes – April 20, 2008 Storm (Giant Eagle) .................................... 131  Figure 5-11 Runoff Flow Rates and Rainfall Intensity – June 13-14, 2008 Storm (Giant Eagle) ........... 132  Figure 5-12 Runoff and Rainfall Volumes – June 13-14, 2008 Storm (Giant Eagle).............................. 133  Figure 5-13 Runoff Flow Rates and Rainfall Intensity ............................................................................. 134  Figure 5-14 Normalized Runoff and Rainfall Volumes ................................................................................. – September 9, 2008 Moderate Storm (Giant Eagle) ........................................................... 134  Figure 5-15 Runoff Flow Rates and Rainfall Intensity – February 18-19, 2009 Storm (Giant Eagle) ..... 136  Figure 5-16 Normalized Runoff and Rainfall Volumes – February 18-19, 2009 Storm (Giant Eagle) .... 136  Figure 6-1 Different measuring parameters related to green and control roof runoff flow rate ............... 139  Figure 6-2 Time of initial runoff retardation under different soil condition and thickness ...................... 140  Figure 6-3 Retardation of occurrence (hr) of maximum peak flow with wet/dry & thick/thin soils ....... 141  Figure 6-4 Probability of occurrence of maximum peak flow rate under dry soil condition .................... 143  Figure 6-5 Probability of occurrence of maximum peak flow rate under wet soil condition ................... 143  xvi
  • 18. Figure 6-6 Ratio of water released from green roof to control roof vs. control roof runoff: .................... 145  Figure 6-7 Ratio of water released from green roof to control roof vs. control roof runoff: .................... 145  Figure 6-8 Ratio of water released from green roof to control roof vs. control roof runoff: .................... 146  Figure 6-9 Ratio of water released from green roof to control roof vs. control roof runoff: .................... 146  Figure 6-10 Comparative runoff performance of thin and thick green roofs for wet and dry soils .......... 150  Figure 6-11 Vertical Layout of temperature monitoring positions of green (left) and control (right) roof .... ............................................................................................................................................. 153  Figure 6-12 January, 2008 temperature profile at Homestead. There is no temperature differences measured between the green and control roofs in cold weather conditions. ............................................. 155  Figure 6-13 April, 2008 temperature profile at Homestead. Moderate weather conditions .................... 157  Figure 6-14 June, 2008 temperature profile at Homestead Summer (hot) weather conditions................. 159  Figure 6-15 January, 2009 temperature profile at Giant Eagle. Winter (cold) weather conditions ......... 161  Figure 6-16 April 2008 temperature profile at Giant Eagle. Moderate weather conditions .................... 163  Figure 6-17 June, 2008 temperature profile at Giant Eagle ..................................................................... 165  Figure 6-18 Day-time monthly average temperature of ambient and soil/roof surface ............................ 168  Figure 6-19 Night-time monthly average temperature of ambient and soil/roof surface. ......................... 169  Figure 6-20 Day-time monthly average temperature of green roof soil surface and below roof deck ..... 171  Figure 6-21 Night-time monthly average temperature of green roof soil surface and below roof deck ... 171  Figure 6-22 Runoff water from control roof stored in the weir box (Homestead).................................... 173  Figure 6-23 Runoff water from the green roof stored in the weir box (Homestead) ................................ 173  Figure 6-24 pH results (Homestead, 2008) ............................................................................................... 174  Figure 6-25 TSS results (Homestead, 2008) ............................................................................................. 175  Figure 6-26 Sulfate results (Homestead, 2008) ........................................................................................ 176  Figure 6-27 Nitrogen results (Homestead, 2008)...................................................................................... 177  Figure 6-28 Phosphorus results (Homestead, 2008) ................................................................................. 178  Figure 6-29 COD results (Homestead, 2008) ........................................................................................... 179  xvii
  • 19. Figure 6-30 pH results (Giant Eagle, 2006) .............................................................................................. 180  Figure 6-31 Turbidity results (Giant Eagle, 2006) .................................................................................... 181  Figure 6-32 Sulfate results (Giant Eagle, 2006) ....................................................................................... 181  Figure 6-33 Nitrogen results (Giant Eagle, 2006)..................................................................................... 182  Figure 6-34 Phosphorus results (Giant Eagle, 2006) ................................................................................ 182  Figure 6-35 COD results (Giant Eagle, 2006) .......................................................................................... 183  Figure 8-1 Runoff parameters of importance: control and green roof discharges. .................................. 192  Figure I-1 Runoff Flow Rates and Rainfall intensity – April 28, 2008 Storm (Homestead) ..................... I-7  Figure I-2 Runoff and rainfall volumes – April 28, 2008 Storm (Homestead) .......................................... I-7  Figure I-3 Runoff Flow Rates and Rainfall intensity – May 7-8, 2008 Storm (Homestead) ..................... I-8  Figure I-4 Runoff and rainfall volumes – May 7-8, 2008 Storm (Homestead) ......................................... I-8  Figure I-5 Runoff flow Rates – May 7-8, 2008 Storm (Giant Eagle) ........................................................ I-9  Figure I-6 Runoff Volumes – May 7-8, 2008 Storm (Giant Eagle) ........................................................... I-9  Figure I-7 Runoff Flow Rates and Rainfall intensity – May 9-10, 2008 Storm (Homestead) ................. I-10  Figure I-8 Runoff and rainfall volumes – May 9-10, 2008 Storm (Homestead) ..................................... I-10  Figure I-9 Runoff flow Rates – May 9-10, 2008 Storm (Giant Eagle) .................................................... I-11  Figure I-10 Runoff Volumes – May 9-10, 2008 Storm (Giant Eagle) ..................................................... I-11  Figure I-11 Runoff Flow Rates and Rainfall intensity – May 11-12, 2008 Storm (Homestead) ............. I-12  Figure I-12 Runoff and rainfall volumes – May 11-12, 2008 Storm (Homestead) ................................. I-12  Figure I-13 Runoff flow Rates – May 11-12, 2008 Storm (Giant Eagle) ................................................ I-13  Figure I-14 Runoff Volumes – May 11-12, 2008 Storm (Giant Eagle) ................................................... I-13  Figure I-15 Runoff Flow Rates and Rainfall intensity – May 11-12, 2008 Storm (Homestead) ............. I-14  Figure I-16 Runoff and rainfall volumes – May 11-12, 2008 Storm (Homestead) ................................. I-14  Figure I-17 Runoff flow Rates – May 11-12, 2008 Storm (Giant Eagle) ................................................ I-15  Figure I-18 Runoff Volumes – May 11-12, 2008 Storm (Giant Eagle) ................................................... I-15  Figure I-19 Runoff Flow Rates and Rainfall Intensity – May 17, 2008 Storm (Homestead) .................. I-16  xviii
  • 20. Figure I-20 Runoff and Rainfall Volumes – May 17, 2008 Storm (Homestead)..................................... I-16  Figure I-21 Runoff Flow Rates and Rainfall intensity – May 17, 2008 Storm (Giant Eagle) ................. I-17  Figure I-22 Runoff and Rainfall Volumes – May 17, 2008 Storm (Giant Eagle).................................... I-17  Figure I-23 Runoff Flow Rates and Rainfall Intensity – May 18, 2008 Storm (Homestead) .................. I-18  Figure I-24 Runoff and Rainfall Volumes – May 18, 2008 Storm (Homestead)..................................... I-18  Figure I-25 Runoff Flow Rates and Rainfall intensity – May 18, 2008 Storm (Giant Eagle) ................. I-19  Figure I-26 Runoff and Rainfall Volumes – May 18, 2008 Storm (Giant Eagle).................................... I-19  Figure I-27 Runoff Flow Rates and Rainfall Intensity – May 17, 2008 Storm (Homestead) .................. I-20  Figure I-28 Runoff and Rainfall Volumes – May 17, 2008 Storm (Homestead)..................................... I-20  Figure I-29 Runoff Flow Rates and Rainfall intensity – May 17, 2008 Storm (Giant Eagle) ................. I-21  Figure I-30 Runoff and Rainfall Volumes – May 17, 2008 Storm (Giant Eagle).................................... I-21  Figure I-31 Runoff Flow Rates and Rainfall Intensity – May 18, 2008 Storm (Homestead) .................. I-22  Figure I-32 Runoff and Rainfall Volumes – May 18, 2008 Storm (Homestead)..................................... I-22  Figure I-33 Runoff Flow Rates and Rainfall intensity – May 18, 2008 Storm (Giant Eagle) ................. I-23  Figure I-34 Runoff and Rainfall Volumes – May 18, 2008 Storm (Giant Eagle).................................... I-23  Figure I-35. Runoff Flow Rates and Rainfall Intensity – May 31, 2008 Storm (Homestead) ................. I-24  Figure I-36 Runoff and Rainfall Volumes – May 31, 2008 Storm (Homestead)..................................... I-24  Figure I-37 Runoff Flow Rates and Rainfall intensity – May 31, 2008 Storm (Giant Eagle) ................. I-25  Figure I-38 Runoff and Rainfall Volumes – May 31, 2008 Storm (Giant Eagle).................................... I-25  Figure I-39 Runoff Flow Rates – June 3-4, 2008 Storm (Homestead) .................................................... I-26  Figure I-40 Runoff Volumes – June 3-4, 2008 Storm (Homestead) ........................................................ I-26  Figure I-41 Runoff Flow Rates and Rainfall intensity – June 3-4, 2008 Storm (Giant Eagle) ................ I-27  Figure I-42 Runoff and Rainfall Volumes – June 3-4, 2008 Storm (Giant Eagle) .................................. I-27  Figure I-43 Runoff Flow Rates and Rainfall Intensity – June 5, 2008 Storm (Homestead) .................... I-28  Figure I-44 Runoff and Rainfall Volumes – June 5, 2008 Storm (Homestead)....................................... I-28  Figure I-45 Runoff Flow Rates and Rainfall intensity – June 5, 2008 Storm (Giant Eagle) ................... I-29  xix
  • 21. Figure I-46 Runoff and Rainfall Volumes – June 5, 2008 Storm (Giant Eagle)...................................... I-29  Figure I-47 Runoff Flow Rates and Rainfall Intensity – June 16, 2008 Storm (Homestead) .................. I-30  Figure I-48 Runoff and Rainfall Volumes – June 16, 2008 Storm (Homestead)..................................... I-30  Figure I-49 Runoff Flow Rates and Rainfall intensity – June 16, 2008 Storm (Giant Eagle) ................. I-31  Figure I-50 Runoff and Rainfall Volumes – June 16, 2008 Storm (Giant Eagle).................................... I-31  Figure I-51 Runoff Flow Rates and Rainfall Intensity – June 20, 2008 Storm (Homestead) .................. I-32  Figure I-52 Runoff and Rainfall Volumes – June 20, 2008 Storm (Homestead)..................................... I-32  Figure I-53 Runoff Flow Rates and Rainfall Intensity – June 21, 2008 Storm (Homestead) .................. I-33  Figure I-54 Runoff and Rainfall Volumes – June 21, 2008 Storm (Homestead)..................................... I-33  Figure I-55 Runoff Flow Rates and Rainfall Intensity – June 22-23, 2008 Storm (Homestead) ............. I-34  Figure I-56 Runoff and Rainfall Volumes – June 22-23, 2008 Storm (Homestead) ............................... I-34  Figure I-57 Runoff Flow Rates – June 22-23, 2008 Storm (Giant Eagle) ............................................... I-35  Figure I-58 Runoff Volumes – June 22-23, 2008 Storm (Giant Eagle) ................................................... I-35  Figure I-59 Runoff Flow Rates and Rainfall Intensity – June 26-27, 2008 Storm (Homestead) ............. I-36  Figure I-60 Runoff and Rainfall Volumes – June 26-27, 2008 Storm (Homestead) ............................... I-36  Figure I-61 Runoff Flow Rates – June 26-27, 2008 Storm (Giant Eagle) ............................................... I-37  Figure I-62 Runoff Volumes – June 26-27, 2008 Storm (Giant Eagle) ................................................... I-37  Figure I-63 Runoff Flow Rates and Rainfall Intensity – June 28, 2008 Storm (Homestead) .................. I-38  Figure I-64 Runoff and Rainfall Volumes – June 28, 2008 Storm (Homestead)..................................... I-38  Figure I-65 Runoff Flow Rates – June 28, 2008 Storm (Giant Eagle)..................................................... I-39  Figure I-66 Runoff Volumes – June 28, 2008 Storm (Giant Eagle) ........................................................ I-39  Figure I-67 Runoff Flow Rates and Rainfall Intensity – June 29, 2008 Storm (Homestead) .................. I-40  Figure I-68 Runoff and Rainfall Volumes – June 29, 2008 Storm (Homestead)..................................... I-40  Figure I-69 Runoff Flow Rates – June 29, 2008 Storm (Giant Eagle)..................................................... I-41  Figure I-70 Runoff Volumes – June 29, 2008 Storm (Giant Eagle) ........................................................ I-41  Figure I-71 Runoff Flow Rates and Rainfall Intensity – June 30-July1, 2008 Storm (Homestead) ........ I-42  xx
  • 22. Figure I-72 Runoff and Rainfall Volumes – June 30-July 1, 2008 Storm (Homestead) .......................... I-42  Figure I-73 Runoff Flow Rates and Rainfall intensity – June 30-July 1, 2008 Storm (Giant Eagle) ...... I-43  Figure I-74 Runoff and Rainfall Volumes – June 30-July 1, 2008 Storm (Giant Eagle) ......................... I-43  Figure I-75 Runoff Flow Rates – July 3, 2008 Storm (Homestead) ........................................................ I-44  Figure I-76 Runoff Volumes – July 3, 2008 Storm (Homestead) ............................................................ I-44  Figure I-77 Runoff Flow Rates and Rainfall intensity – July 3, 2008 Storm (Giant Eagle) .................... I-45  Figure I-78 Runoff and Rainfall Volumes – July 3, 2008 Storm (Giant Eagle) ...................................... I-45  Figure I-79 Runoff Flow Rates and Rainfall intensity – July 7, 2008 Storm (Giant Eagle) .................... I-46  Figure I-80 Runoff and Rainfall Volumes – July 7, 2008 Storm (Giant Eagle) ...................................... I-46  Figure I-81 Runoff Flow Rates and Rainfall intensity – July 8-9, 2008 Storm (Giant Eagle)................. I-47  Figure I-82 Runoff and Rainfall Volumes – July 8-9, 2008 Storm (Giant Eagle) ................................... I-47  Figure I-83 Runoff Flow Rates and Rainfall Intensity – July 20, 2008 Storm (Homestead)................... I-48  Figure I-84 Runoff and Rainfall Volumes – July 20, 2008 Storm (Homestead) ..................................... I-48  Figure I-85 Runoff Flow Rates and Rainfall Intensity – July 21, 2008 Storm (Homestead)................... I-49  Figure I-86 Runoff and Rainfall Volumes – July 21, 2008 Storm (Homestead) ..................................... I-49  Figure I-87 Runoff Flow Rates and Rainfall intensity – July 21, 2008 Storm (Giant Eagle) .................. I-50  Figure I-88 Runoff and Rainfall Volumes – July 21, 2008 Storm (Giant Eagle) .................................... I-50  Figure I-89 Runoff Flow Rates and Rainfall Intensity – July 22, 2008 Storm (Homestead)................... I-51  Figure I-90 Runoff and Rainfall Volumes – July 22, 2008 Storm (Homestead) ..................................... I-51  Figure I-91 Runoff Flow Rates and Rainfall intensity – July 22, 2008 Storm (Giant Eagle) .................. I-52  Figure I-92 Runoff and Rainfall Volumes – July 22, 2008 Storm (Giant Eagle) .................................... I-52  Figure I-93 Runoff Flow Rates and Rainfall Intensity – July 27, 2008 Storm (Homestead)................... I-53  Figure I-94 Runoff and Rainfall Volumes – July 27, 2008 Storm (Homestead) ..................................... I-53  Figure I-95 Runoff Flow Rates and Rainfall intensity – July 30, 2008 Storm (Homestead) ................... I-54  Figure I-96 Runoff and Rainfall Volumes – July 30, 2008 Storm (Homestead) ..................................... I-54  Figure I-97 Runoff Flow Rates and Rainfall intensity – July 30, 2008 Storm (Giant Eagle) .................. I-55  xxi
  • 23. Figure I-98 Runoff and Rainfall Volumes – July 30, 2008 Storm (Giant Eagle) .................................... I-55  Figure I-99 Runoff Flow Rates and Rainfall intensity – August 5, 2008 Storm (Giant Eagle) ............... I-56  Figure I-100 Runoff and Rainfall Volumes – August 5, 2008 Storm (Giant Eagle) ............................... I-56  Figure I-101 Runoff Flow Rates and Rainfall Intensity – August 6, 2008 Storm (Homestead) .............. I-57  Figure I-102 Runoff and Rainfall Volumes – August 6, 2008 Storm (Homestead) ................................ I-57  Figure I-103 Runoff Flow Rates and Rainfall intensity – August 6, 2008 Storm (Giant Eagle) ............. I-58  Figure I-104 Runoff and Rainfall Volumes – August 6, 2008 Storm (Giant Eagle) ............................... I-58  Figure I-105 Runoff Flow Rates and Rainfall Intensity – August 8, 2008 Storm (Homestead) .............. I-59  Figure I-106 Runoff and Rainfall Volumes – August 8, 2008 Storm (Homestead) ................................ I-59  Figure I-107 Runoff Flow Rates – August 8, 2008 Storm (Giant Eagle) ................................................ I-60  Figure I-108 Runoff Volumes – August 8, 2008 Storm (Giant Eagle) .................................................... I-60  Figure I-109 Runoff Flow Rates and Rainfall Intensity – August 9-10, 2008 Storm (Homestead) ........ I-61  Figure I-110 Runoff and Rainfall Volumes – August 9-10, 2008 Storm (Homestead) ........................... I-61  Figure I-111 Runoff Flow Rates – August 10, 2008 Storm (Giant Eagle) .............................................. I-62  Figure I-112 Runoff Volumes – August 10, 2008 Storm (Giant Eagle) .................................................. I-62  Figure I-113 Runoff Flow Rates and Rainfall Intensity – August 14, 2008 Storm (Homestead) ............ I-63  Figure I-114 Runoff and Rainfall Volumes – August 14, 2008 Storm (Homestead) .............................. I-63  Figure I-115 Runoff Flow Rates – August 14, 2008 Storm (Giant Eagle) .............................................. I-64  Figure I-116 Runoff Volumes – August 14, 2008 Storm (Giant Eagle) .................................................. I-64  Figure I-117 Runoff Flow Rates and Rainfall Intensity – August 25, 2008 Storm (Homestead) ............ I-65  Figure I-118 Runoff and Rainfall Volumes – August 25, 2008 Storm (Homestead) .............................. I-65  Figure I-119 Runoff Flow Rates and Rainfall Intensity – August 27-28, 2008 Storm (Homestead) ...... I-66  Figure I-120 Runoff and Rainfall Volumes – August 27-28, 2008 Storm (Homestead) ......................... I-66  Figure I-121 Runoff Flow Rates and Rainfall intensity – August 27-28, 2008 Storm (Giant Eagle) ...... I-67  Figure I-122 Runoff and Rainfall Volumes – August 27-28, 2008 Storm (Giant Eagle) ........................ I-67  Figure I-123 Runoff Flow Rates and Rainfall Intensity – September 9, 2008 Storm (Homestead) ........ I-68  xxii
  • 24. Figure I-124 Runoff and Rainfall Volumes – September 9, 2008 Storm (Homestead) ........................... I-68  Figure I-125 Runoff Flow Rates and Rainfall intensity – September 9, 2008 Storm (Giant Eagle) ....... I-69  Figure I-126 Runoff and Rainfall Volumes – September 9, 2008 Storm (Giant Eagle) .......................... I-69  Figure I-127 Runoff Flow Rates and Rainfall Intensity – September 12, 2008 Storm (Homestead) ...... I-70  Figure I-128 Runoff and Rainfall Volumes – September 12, 2008 Storm (Homestead) ......................... I-70  Figure I-129 Runoff Flow Rates and Rainfall intensity – September 12, 2008 Storm (Giant Eagle) ..... I-71  Figure I-130 Runoff and Rainfall Volumes – September 12, 2008 Storm (Giant Eagle) ........................ I-71  Figure I-131 Runoff Flow Rates and Rainfall Intensity – September 13, 2008 Storm (Homestead) ...... I-72  Figure I-132 Runoff and Rainfall Volumes – September 13, 2008 Storm (Homestead) ......................... I-72  Figure I-133 Runoff Flow Rates and Rainfall intensity – September 13, 2008 Storm (Giant Eagle) ..... I-73  Figure I-134 Runoff and Rainfall Volumes – September 13, 2008 Storm (Giant Eagle) ........................ I-73  Figure I-135 Runoff Flow Rates and Rainfall Intensity – October 1, 2008 Storm (Homestead) ............ I-74  Figure I-136 Runoff and Rainfall Volumes – October 1, 2008 Storm (Homestead) ............................... I-74  Figure I-137 Runoff Flow Rates and Rainfall Intensity – October 8, 2008 Storm (Homestead) ............ I-75  Figure I-138 Runoff and Rainfall Volumes – October 8, 2008 Storm (Homestead) ............................... I-75  Figure I-139 Runoff Flow Rates and Rainfall intensity – October 8, 2008 Storm (Giant Eagle) ............ I-76  Figure I-140 Runoff and Rainfall Volumes – October 8, 2008 Storm (Giant Eagle) .............................. I-76  Figure I-141 Runoff Flow Rates and Rainfall Intensity – October 24-25, 2008 Storm (Homestead) ..... I-77  Figure I-142 Runoff and Rainfall Volumes – October 24-25, 2008 Storm (Homestead) ........................ I-77  Figure I-143 Runoff Flow Rates and Rainfall intensity – October 24-25, 2008 Storm (Giant Eagle) .... I-78  Figure I-144 Runoff and Rainfall Volumes – October 24-25, 2008 Storm (Giant Eagle) ....................... I-78  Figure I-145 Runoff Flow Rates and Rainfall Intensity – November 15, 2008 Storm (Homestead) ...... I-79  Figure I-146 Runoff and Rainfall Volumes – November 15, 2008 Storm (Homestead) ......................... I-79  Figure I-147 Runoff Flow Rates and Rainfall intensity – November 15, 2008 Storm (Giant Eagle) ...... I-80  Figure I-148 Runoff and Rainfall Volumes – November 15, 2008 Storm (Giant Eagle) ........................ I-80  Figure I-149 Runoff Flow Rates and Rainfall Intensity – November 30, 2008 Storm (Homestead) ...... I-81  xxiii
  • 25. Figure I-150 Runoff and Rainfall Volumes – November 30, 2008 Storm (Homestead) ......................... I-81  Figure I-151 Runoff Flow Rates– November 30-December 1, 2008 Storm (Giant Eagle) ..................... I-82  Figure I-152 Runoff Volumes – November 30-December 1, 2008 Storm (Giant Eagle) ........................ I-82  Figure I-153 Runoff Flow Rates and Rainfall Intensity – February 10, 2009 Storm (Homestead) ......... I-83  Figure I-154 Runoff and Rainfall Volumes – February 10, 2009 Storm (Homestead)............................ I-83  Figure I-155 Runoff Flow Rates and Rainfall intensity – February 10, 2009 Storm (Giant Eagle) ........ I-84  Figure I-156 Runoff and Rainfall Volumes – February 10, 2009 Storm (Giant Eagle)........................... I-84  Figure I-157 Runoff Flow Rates and Rainfall Intensity – February 18, 2009 Storm (Homestead) ......... I-85  Figure I-158 Runoff and Rainfall Volumes – February 18, 2009 Storm (Homestead)............................ I-85  Figure I-159 Runoff Flow Rates and Rainfall intensity – February 18-19, 2009 Storm (Giant Eagle) ... I-86  Figure I-160 Runoff and Rainfall Volumes – February 18-19, 2009 Storm (Giant Eagle) ..................... I-86  Figure I-161 Runoff Flow Rates and Rainfall Intensity – March 8-9, 2009 Storm (Homestead)............ I-87  Figure I-162 Runoff and Rainfall Volumes – March 8-9, 2009 Storm (Homestead) .............................. I-87  Figure I-163 Runoff Flow Rates and Rainfall intensity – March 8, 2009 Storm (Giant Eagle) .............. I-88  Figure I-164 Runoff and Rainfall Volumes – March 8, 2009 Storm (Giant Eagle)................................. I-88  Figure I-165 Runoff Flow Rates and Rainfall intensity – March 25, 2009 Storm (Giant Eagle) ............ I-89  Figure I-166 Runoff and Rainfall Volumes – March 25, 2009 Storm (Giant Eagle)............................... I-89  Figure I-167 Runoff Flow Rates and Rainfall intensity – March 26, 2009 Storm (Giant Eagle) ............ I-90  Figure I-168 Runoff and Rainfall Volumes – March 26, 2009 Storm (Giant Eagle)............................... I-90  Figure I-169 Runoff Flow Rates and Rainfall intensity – March 27-28, 2009 Storm (Giant Eagle) ....... I-91  Figure I-170 Runoff and Rainfall Volumes – March 27-28, 2009 Storm (Giant Eagle) ......................... I-91  Figure I-171 Runoff Flow Rates and Rainfall intensity – March 29, 2009 Storm (Giant Eagle) ............ I-92  Figure I-172 Runoff and Rainfall Volumes – March 29, 2009 Storm (Giant Eagle)............................... I-92  Figure II-1 February, 2008 temperature profile at Homestead ................................................................. II-6  Figure II-2 March, 2008 temperature profile at Homestead ..................................................................... II-7  Figure II-3 May, 2008 temperature profile at Homestead ........................................................................ II-8  xxiv