Download to read offline
![UNIVERSITY OF CAMBRIDGE INTERNATIONAL EXAMINATIONS
Cambridge International Level 3 Pre-U Certificate
Short Course
1347/01
MATHEMATICS (STATISTICS WITH PURE MATHEMATICS)
Paper 1 Pure Mathematics
For Examination from 2012
SPECIMEN PAPER
1 hour 45 minutes
Additional Materials:
Answer Booklet/Paper
Graph Paper
List of Formulae (MF21)
READ THESE INSTRUCTIONS FIRST
If you have been given an Answer Booklet, follow the instructions on the front cover of the Booklet.
Write your Centre number, candidate number and name on all the work you hand in.
Write in dark blue or black pen.
You may use a soft pencil for any diagrams or graphs.
Do not use staples, paper clips, highlighters, glue or correction fluid.
Answer all the questions.
Give non-exact numerical answers correct to 3 significant figures, or 1 decimal place in the case of angles in
degrees, unless a different level of accuracy is specified in the question.
The use of an electronic calculator is expected, where appropriate.
You are reminded of the need for clear presentation in your answers.
At the end of the examination, fasten all your work securely together.
The number of marks is given in brackets [ ] at the end of each question or part question.
The total number of marks for this paper is 65.
This document consists of 3 printed pages and 1 blank page.
© UCLES 2011
[Turn over](https://image.slidesharecdn.com/129215-specimen-paper-and-mark-schemes-140108111637-phpapp01/85/129215-specimen-paper-and-mark-schemes-1-320.jpg)
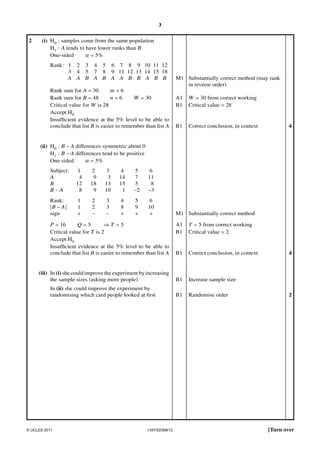
![2
1
A farmer has a rectangular field. The length of the field is 10 metres more than its width and the area
of the field is 39 square metres. The farmer writes this as x(x + 10) = 39.
(i) By completing the square, express x(x + 10) = 39 in the form (x + a)2 = b, where a and b are
constants to be found.
[2]
(ii) Hence write down the width and length of the field.
2
[1]
The sensitivity, S (dB), of a loudspeaker at different acoustic efficiency percentages, E (%), is given
in the table.
E
1
2
5
10
20
S
92
95
99
102
105
It is claimed that there is a relationship between E and S of the form S = kEn .
When the values of ln S are plotted against the values of ln E the points approximately fit a straight
line with gradient 0.0445.
(i) Deduce values for k and n.
(ii) What sensitivity would you expect from a loudspeaker with 15% efficiency?
3
[3]
[2]
Jack needs to know the value of (2.03)5 but he cannot be bothered to find his calculator.
(i) Write down and simplify the expansion of (2 + 3x)5 in ascending powers of x as far as the term
[4]
in x2 .
(ii) Use your answer to part (i) to calculate an approximate value for (2.03)5 and show that it agrees
with the value from your calculator to 2 decimal places.
[2]
4
(i) Show that at the points of intersection of y = 3x2 − 2x + 2 and y = 4x + k the x-values must satisfy
the quadratic equation 3x2 − 6x + (2 − k) = 0.
[1]
(ii) Calculate the discriminant of 3x2 − 6x + (2 − k) and hence find the point on the curve
y = 3x2 − 2x + 2 where the tangent is parallel to the line joining (−1, 7) and (3, 23).
[5]
5
A triangle is formed by joining the points A (1, 2), B (5, 5) and C (2, 9).
(i) Calculate the length of the line segment AC, giving your answer in surd form.
[1]
(ii) Calculate the gradient of AB and the gradient of BC. What can you deduce about the line
segments AB and BC?
[3]
(iii) Give the centre of the circle that passes through A, B and C . Also give the radius of the circle,
√
expressing your answer in terms of 2.
[3]
© UCLES 2011
1347/01/SP/12](https://image.slidesharecdn.com/129215-specimen-paper-and-mark-schemes-140108111637-phpapp01/85/129215-specimen-paper-and-mark-schemes-2-320.jpg)
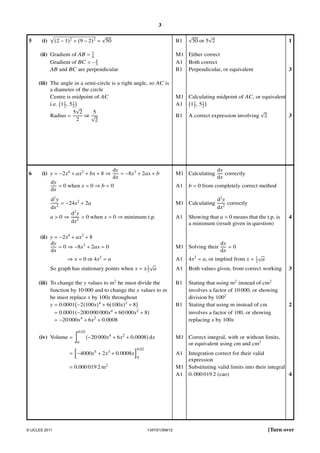
![3
6
In his Anthropology coursework, Tom is trying to construct a function to model the cross-sectional
area, y, of a small ceramic pot in terms of its depth, x. He needs the graph of the function to have a
minimum turning point at (0, 8). He has decided to try a function of the form y = −2x4 + ax2 + bx + 8.
d2 y
and
dx2
show that setting a > 0 will guarantee that the turning point is a minimum turning point.
[4]
(i) Show that for the function to have a turning point at (0, 8), b must equal 0. Calculate
(ii) Find, in terms of a, the x-values of the other stationary points on the graph of Tom’s function.
[3]
Tom decides to use the function y = −2x4 + 6x2 + 8. He then realises that he has recorded the x-values
in his coursework in centimetres instead of metres and the y-values in cm2 instead of m2 .
(iii) Explain why Tom should change his function to y = −20 000x4 + 6x2 + 0.0008.
[2]
The function y = −20 000x4 + 6x2 + 0.0008 gives the cross-sectional area, y m2 , as a function of the
depth, x m, where 0 ≤ x ≤ 0.02.
(iv) Use integration to calculate the volume of the ceramic pot in m3 .
7
[4]
(i) The graph of the quadratic polynomial y = (x − A)2 + B has its minimum turning point at (−1, 7).
[3]
Show that the point (3, 23) also lies on the curve.
(ii) The graph of a second quadratic polynomial, y = ax2 + bx + c, intersects the first graph at (−1, 7)
and (3, 23). Find, in terms of a, the equation of the tangent to the second graph that is parallel
to the chord joining the two points of intersection.
[11]
(iii) The area enclosed between the two quadratic graphs is 472 square units. Find the coordinates
of the point where the perpendicular bisector of the two points of intersection meets the tangent
from part (ii).
[11]
© UCLES 2011
1347/01/SP/12](https://image.slidesharecdn.com/129215-specimen-paper-and-mark-schemes-140108111637-phpapp01/85/129215-specimen-paper-and-mark-schemes-3-320.jpg)


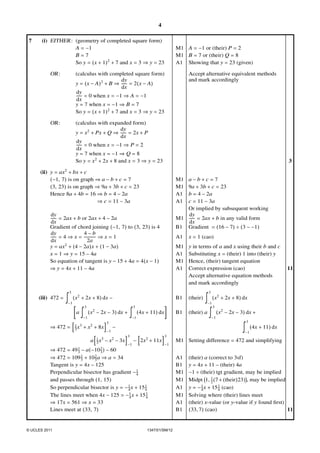
![UNIVERSITY OF CAMBRIDGE INTERNATIONAL EXAMINATIONS
Cambridge International Level 3 Pre-U Certificate
Short Course
1347/02
MATHEMATICS (STATISTICS WITH PURE MATHEMATICS)
For Examination from 2012
Paper 2 Statistics
SPECIMEN PAPER
2 hours
Additional Materials:
Answer Booklet/Paper
Graph Paper
List of Formulae (MF21)
READ THESE INSTRUCTIONS FIRST
If you have been given an Answer Booklet, follow the instructions on the front cover of the Booklet.
Write your Centre number, candidate number and name on all the work you hand in.
Write in dark blue or black pen.
You may use a soft pencil for any diagrams or graphs.
Do not use staples, paper clips, highlighters, glue or correction fluid.
Answer all the questions.
Give non-exact numerical answers correct to 3 significant figures, or 1 decimal place in the case of angles in
degrees, unless a different level of accuracy is specified in the question.
The use of an electronic calculator is expected, where appropriate.
You are reminded of the need for clear presentation in your answers.
At the end of the examination, fasten all your work securely together.
The number of marks is given in brackets [ ] at the end of each question or part question.
The total number of marks for this paper is 80.
This document consists of 6 printed pages.
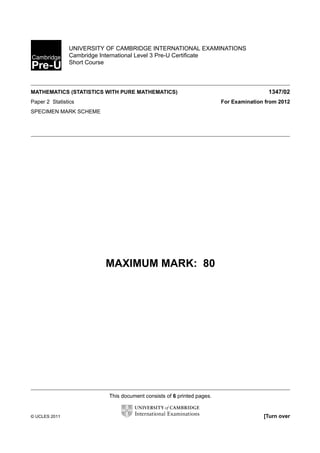
© UCLES 2011
[Turn over](https://image.slidesharecdn.com/129215-specimen-paper-and-mark-schemes-140108111637-phpapp01/85/129215-specimen-paper-and-mark-schemes-9-320.jpg)
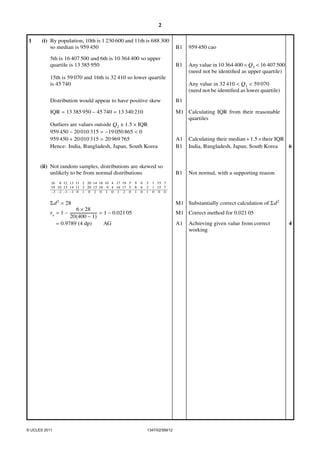
![2
1
The table shows information about the twenty most densely populated countries in the world.
Country
Population
Rank
Land Area (km2 )
Rank
Population density
Monaco
Singapore
Malta
Maldives
Bahrain
Bangladesh
Vatican City
Barbados
Nauru
Mauritius
South Korea
San Marino
Tuvalu
Netherlands
Lebanon
Belgium
Japan
India
Marshall Islands
Rwanda
32 410
4 425 700
398 500
349 100
688 300
144 319 600
920
279 300
13 050
1 230 600
48 422 600
28 800
11 640
16 407 500
3 826 000
10 364 400
127 417 200
1 080 264 400
59 070
8 440 800
16
8
12
13
11
2
20
14
18
10
4
17
19
5
9
6
3
1
15
7
2
693
316
300
665
144 000
1
431
21
2 040
98 480
61
26
41 526
10 400
30 510
377 835
3 287 590
181
26 338
19
10
13
14
11
3
20
12
18
9
4
16
17
5
8
6
2
1
15
7
16 205
6 386
1 261
1 164
1 035
1 002
920
648
621
603
492
472
448
395
368
340
337
329
326
320
source: http://www.worldatlas.com
(i) Write down the median and quartiles for the populations of these twenty countries. What do
these values tell you about the shape of the distribution of the populations? Identify the countries
for which the population is an outlier for this sample.
[6]
(ii) Explain why it is not appropriate to use the product-moment correlation coefficient as a measure
of correlation between the populations and the areas for these twenty countries. Show that the
value of Spearman’s rank correlation coefficient between the populations and the areas is 0.9789.
[4]
© UCLES 2011
1347/02/SP/12](https://image.slidesharecdn.com/129215-specimen-paper-and-mark-schemes-140108111637-phpapp01/85/129215-specimen-paper-and-mark-schemes-10-320.jpg)
![3
2
Louise has made up two sets of words for a Psychology project. Each set consists of twenty words
written in five groups of four. On card A the words in each group are random; on card B the words in
each group have a common theme.
Card A
Card B
Rabbit
Turnip
Daisy
Lamp
Rabbit
Dog
Cat
Mouse
Scarf
Pebble
Cheese
Pencil
Scarf
Hat
Coat
Gloves
Snow
Triangle
Yacht
Bag
Snow
Rain
Wind
Sun
Green
Pram
Chair
Film
Green
Blue
Red
Yellow
Tennis
Bottle
String
Needle
Tennis
Golf
Hockey
Squash
Louise asks six volunteers to try to memorise the words on card A and another six to try to memorise
the words on card B. Each group is given 30 seconds and is then asked to write down as many of the
words as they can remember.
The number of words that each volunteer remembered correctly is given below.
Card A:
Card B:
4
12
9
18
3
13
14
15
7
5
11
8
(i) Carry out a Wilcoxon rank-sum test, at the 5% level, to test whether card B was easier to
remember than card A.
[4]
Suppose that, instead, Louise had asked six volunteers to try to memorise the words on card A and
had then asked the same six to try to memorise the words on card B. Assume that the results above
represent the paired data showing the number of words remembered correctly from each list by each
of these six volunteers.
(ii) Carry out a Wilcoxon matched-pairs signed-rank test, at the 5% level, to test whether card B was
easier to remember than card A.
[4]
(iii) Apart from changing the words on the lists, give one way in which Louise could have improved
the design of her experiment in part (i), and a different way in which she could have improved
the design of the experiment in part (ii).
[2]
© UCLES 2011
1347/02/SP/12
[Turn over](https://image.slidesharecdn.com/129215-specimen-paper-and-mark-schemes-140108111637-phpapp01/85/129215-specimen-paper-and-mark-schemes-11-320.jpg)
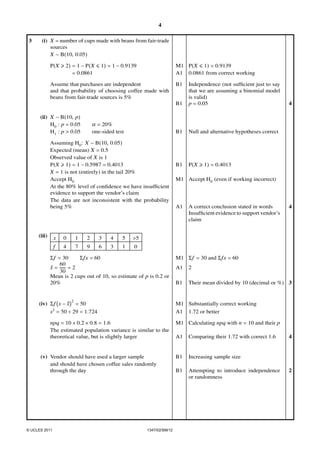
![4
3
An article from the organic coffee producers association claimed that 5% of the coffee bought in the
UK is made with beans from fair-trade sources.
A high-street coffee vendor sells different types of coffee, some of which are made with beans from
fair-trade sources. One day he sells 10 cups of coffee in the first half hour of trading. He uses
a binomial B(n, p) distribution to model the number of these cups that are made with beans from
fair-trade sources.
(i) Calculate the probability that at least 2 of the 10 cups are made with beans from fair-trade sources.
State the assumptions you have made.
[4]
The vendor finds that exactly 1 of the 10 cups was made with beans from fair-trade sources. He claims
that this shows that more than 5% of the coffee bought in his shop is made with beans from fair-trade
sources.
(ii) Test whether this result supports the vendor’s claim, assuming that a binomial model is valid.
Use a 20% level of significance for your test.
[4]
Each day for a month the vendor records how many of the first ten cups of coffee sold were made
with beans from fair-trade sources. His results are given below.
Number of cups made with
beans from fair-trade sources
Number of days
0
4
1
7
2
9
3
6
4
3
5
1
6 or more
0
(iii) Calculate the mean for this sample and hence estimate an appropriate value for the percentage
of the vendor’s coffee sales that are made with beans from fair-trade sources.
[3]
(iv) Use the vendor’s records to calculate an estimate for the population variance. Compare this with
[4]
the theoretical value from B(n, p) using your estimate for p.
(v) Suggest two improvements to the vendor’s sampling method.
© UCLES 2011
1347/02/SP/12
[2]](https://image.slidesharecdn.com/129215-specimen-paper-and-mark-schemes-140108111637-phpapp01/85/129215-specimen-paper-and-mark-schemes-12-320.jpg)
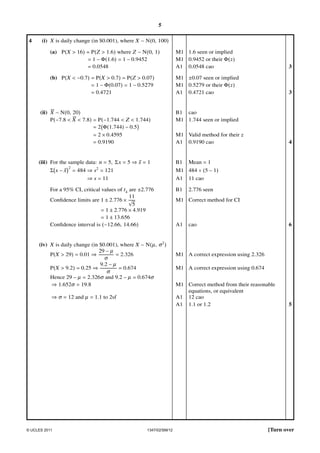
![5
4
An economist records the daily rises and falls of the £ sterling against the US dollar. At the start
of each business day she records the value of £1 in US dollars and then calculates the increase or
decrease from the previous day in $0.001.
She claims that the changes can be modelled using a normal distribution N(0, 100).
(i) Assuming the claim to be true, calculate the probability of a change that is
(a) greater than 16,
[3]
(b) more negative than −0.7.
[3]
Each working week there are five daily changes.
(ii) Assuming the economist’s claim to be true, write down the distribution for the mean of the
weekly changes and calculate the probability of a mean change of between ±7.8.
[4]
One week the economist finds that the five changes are 6, 16, −12, 2, −7.
She puts these values into a spreadsheet and calculates various totals.
A
B
C
D
6
36
5
25
2
16
256
15
225
3
−12
144
169
2
4
−13
1
1
−7
49
−8
64
5
489
0
484
1
4
5
6
7
E
(iii) Use this result to determine a 95% confidence interval for the mean change, assuming that the
changes can be regarded as being a random sample from a normal population.
[6]
The economist then collects data for 100 daily changes. She finds that 25 of the 100 changes were
greater than 9.2 and just one was greater than 29.
(iv) Assuming that a normal model is appropriate and that the data are typical, calculate appropriate
values (to 2 significant figures) for the mean and standard deviation of the daily changes.
[5]
© UCLES 2011
1347/02/SP/12
[Turn over](https://image.slidesharecdn.com/129215-specimen-paper-and-mark-schemes-140108111637-phpapp01/85/129215-specimen-paper-and-mark-schemes-13-320.jpg)
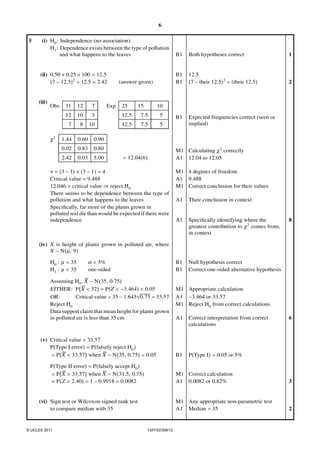
![6
5
A biologist carries out a study into the effect of different chemicals on plant growth. He grows 50
common vetch plants in ordinary conditions, 25 in an environment where the air is polluted with
motor exhaust fumes and 25 in soil polluted with oil. He records what happens to the leaves of the
plants. The frequencies are given in the table.
Grew normally
Spotted leaves
Plant died
TOTAL
Control
31
12
7
50
Polluted air
12
10
3
25
Polluted soil
7
8
10
25
50
30
20
100
TOTAL
The biologist suspects that there is an association between the type of pollution and what happens to
the leaves of the plants. A χ 2 test is to be applied to the data in the contingency table.
(i) State the null and alternative hypotheses for the test.
[1]
(ii) Assuming the null hypothesis to be true, how many of the plants grown in polluted soil would
you expect to have grown normally? Show that the contribution to the χ 2 test statistic from the
cell for plants grown in polluted soil that grew normally is 2.42 to 2 decimal places.
[2]
(iii) Carry out the test at the 5% level of significance. State the conclusion that the biologist should
make.
[8]
The biologist then measures the heights, in cm, of the 50 plants that grew normally. The heights
of the 31 plants in the control group can be modelled using a normal distribution with mean 35 and
variance 9. The heights of the 12 plants grown in polluted air can also be modelled using a normal
distribution with variance 9. The heights of the 7 plants grown in polluted soil cannot be modelled
using a normal distribution.
(iv) The sample mean height for the 12 plants grown in polluted air was 32 cm. Test, at the 5% level,
whether the average height of plants grown in polluted air is significantly less than 35 cm. [6]
It is later found that the heights of common vetch plants grown in polluted air can be modelled using
a normal distribution with mean 31.5 and variance 9.
(v) Calculate the probability of having made a Type I error and of having made a Type II error in
your test from part (iv).
[3]
(vi) Using the data for the 7 plants grown in polluted soil, what test could the biologist use to test
whether the average height of all common vetch plants grown in polluted soil is less than 35 cm?
[2]
Permission to reproduce items where third-party owned material protected by copyright is included has been sought and cleared where possible. Every reasonable
effort has been made by the publisher (UCLES) to trace copyright holders, but if any items requiring clearance have unwittingly been included, the publisher will
be pleased to make amends at the earliest possible opportunity.
University of Cambridge International Examinations is part of the Cambridge Assessment Group. Cambridge Assessment is the brand name of University of
Cambridge Local Examinations Syndicate (UCLES), which is itself a department of the University of Cambridge.
© UCLES 2011
1347/02/SP/12](https://image.slidesharecdn.com/129215-specimen-paper-and-mark-schemes-140108111637-phpapp01/85/129215-specimen-paper-and-mark-schemes-14-320.jpg)

This document is a specimen paper for a Cambridge International Level 3 Pre-U Certificate mathematics exam. It consists of 7 multi-part questions testing various pure mathematics concepts. The questions cover topics such as solving quadratic equations, modeling relationships between variables, expanding binomial expressions, finding stationary points of functions, and calculating volumes using integration. The document also provides a specimen mark scheme detailing the marking criteria and maximum scores for each question.