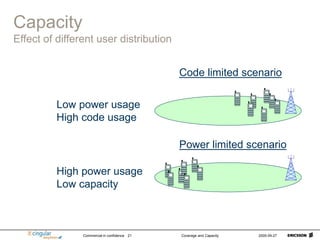
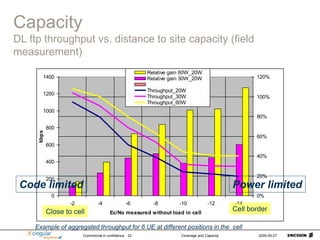
The document discusses coverage and capacity concepts for WCDMA networks. It provides 3 key points:
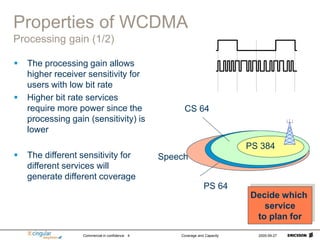
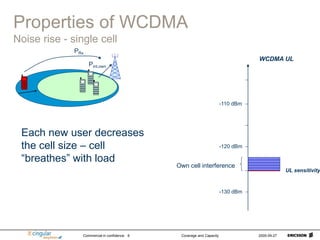
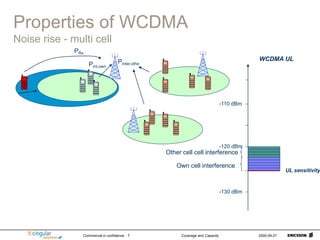
1) WCDMA uses processing gain to provide different coverage levels for various services, with higher bit rate services requiring more power. Cell breathing and pole capacity concepts are also introduced.
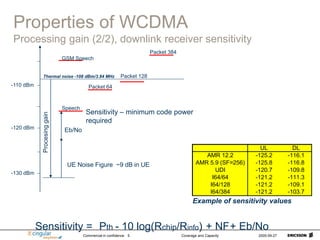
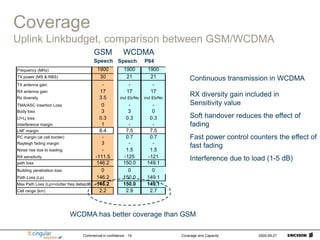
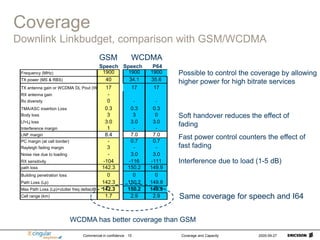
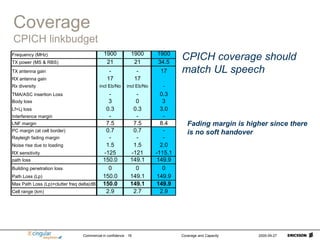
2) Coverage is analyzed through uplink and downlink link budget comparisons to GSM. WCDMA is shown to provide better coverage for similar services.
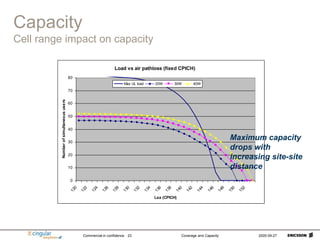
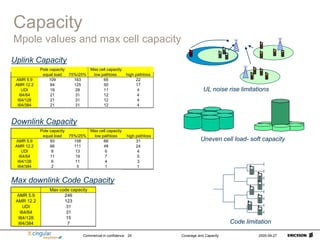
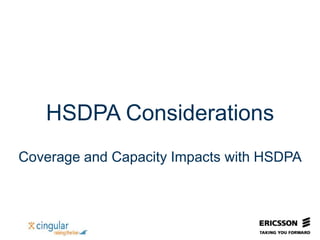
3) Network capacity is maximized by optimizing the distribution of power between common and dedicated channels. Uneven user distributions and cell loading also impact achievable capacity. HSDPA is noted to further increase the average power utilization in the network.

![Commercial in confidence Coverage and Capacity 2005-09-27
12
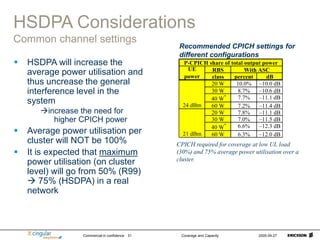
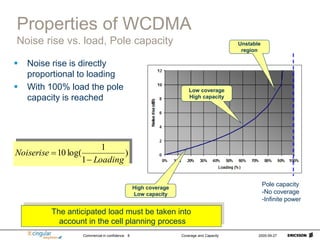
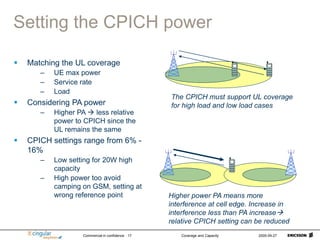
Effects of soft capacity
Equally loaded cells
Less loading in surrounding cells
Higher capacity in middle cell
Equally loaded cells
Less loading in surrounding cells
Higher capacity in middle cell
0
200
400
600
800
1000
1200
130 135 140 145 150
Lsa [dB]
Cell
border
throughput
[kbps]
0% 25% 50% 75% 100%
Example of cell border throughput
Equally loaded
No load in neighbouring cells
Maximum cell capacity and user
throughput can be significantly
higher in an unevenly loaded
network
All networks are
unevenly loaded
Cell pole capacity
Equal load Unloaded neighbour
85
125
Upto 50% more capacity](https://image.slidesharecdn.com/11-wcdmacoverageandcapacityreva-220717015140-24cc0e3e/85/11-WCDMA-Coverage-and-Capacity-Rev-A-ppt-11-320.jpg)
![Commercial in confidence Coverage and Capacity 2005-09-27
27
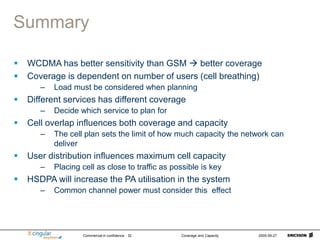
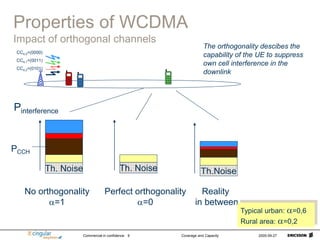
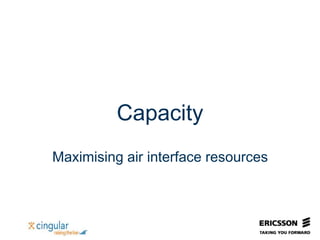
HSDPA Considerations
High bitrate possible in good radio conditions
0,00
0,50
1,00
1,50
2,00
2,50
3,00
3,50
4,00
4,50
-12 -10 -8 -6 -4 -2 0 2 4 6 8
C/I [dB]
Throughput
[Mbps]
16QAM QPSK
Max. rate 3.36 Mbps, class 5 & 6 UE
Max. rate 1.6 Mbps, class 12 UE
0,00
0,50
1,00
1,50
2,00
2,50
3,00
3,50
4,00
4,50
-12 -10 -8 -6 -4 -2 0 2 4 6 8
C/I [dB]
Throughput
[Mbps]
16QAM QPSK
Max. rate 3.36 Mbps, class 5 & 6 UE
Max user throughput for R99
thermal
own
other
HSDPA
P
P
P
P
I
C
Simulated throughput vs received C/I](https://image.slidesharecdn.com/11-wcdmacoverageandcapacityreva-220717015140-24cc0e3e/85/11-WCDMA-Coverage-and-Capacity-Rev-A-ppt-26-320.jpg)
![Commercial in confidence Coverage and Capacity 2005-09-27
30
0
200
400
600
800
1000
1200
130 135 140 145 150
Lsa [dB]
Cell
average
throughput
[kbps]
8.7 W 12.5 W 22.3 W
DCH 8.7W DCH 12.5W DCH 22.3W
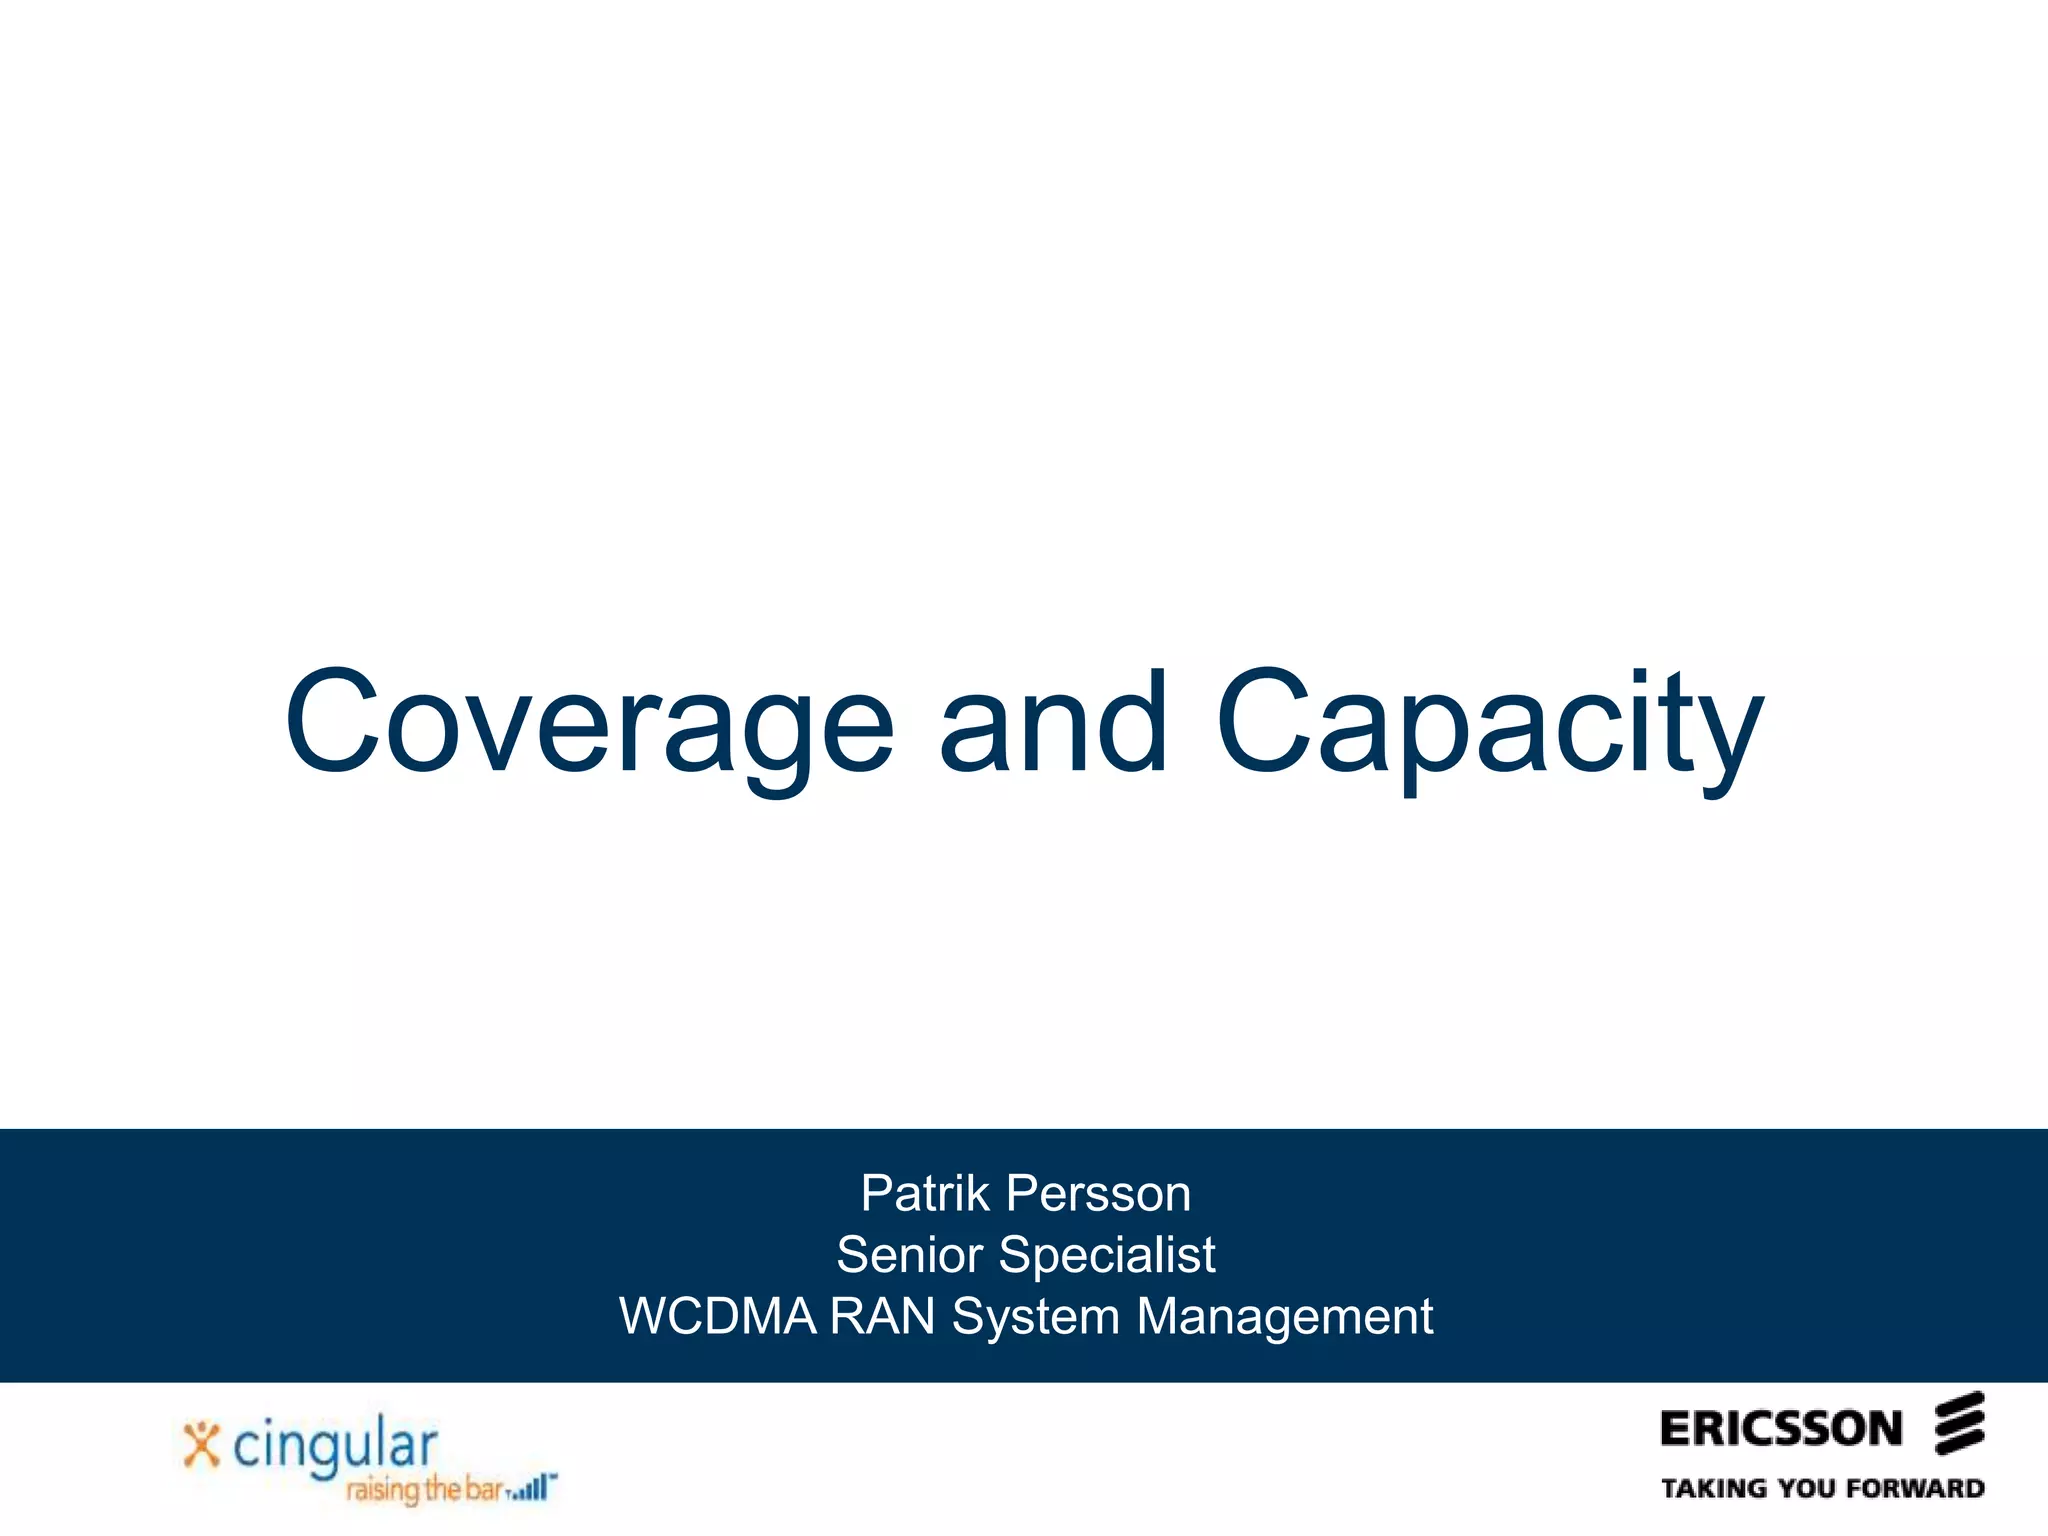
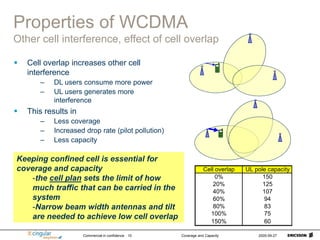
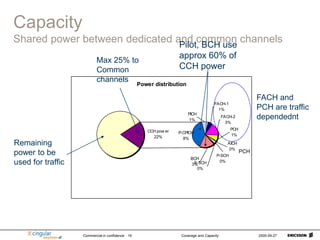
HSDPA Considerations
Higher Packet Capacity with HSDPA
HSDPA cell average throughput
DCH cell average throughput
Lsa = 141.8dB, corresponding to PS 64 kbps in UL
About 2.5 times more capacity for HSDPA
Example of average cell throughput on TU-3 channel comparing R99 and HSDPA](https://image.slidesharecdn.com/11-wcdmacoverageandcapacityreva-220717015140-24cc0e3e/85/11-WCDMA-Coverage-and-Capacity-Rev-A-ppt-28-320.jpg)