More Related Content

PPT

PDF
radio resource_management_v1.1_chema 
PDF
Optimization channal contral power in live umts network 
PPT
Wcdma Radio Network Planning And Optimization 
PPT

PPT
11 - WCDMA Coverage and Capacity Rev A.ppt 
PPT
B02 WCDMA RNP Link Budget feature parameter description 
PPT
B02 WCDMA RNP Link Budgetxxxxxxxxxxx.ppt Similar to WCDMA Optimization for new people to learn

PPTX

PPT

PPT

PDF
third generation of mobile communication 
PDF
Radio resource management in wcdma 
PPT

PPS

PDF

PPTX
6 Weeks Industrial Training In Telecom In Chandigarh 
PDF
rohvjhgggghhgggggdtyffttyg_46218827462.pdf 
DOCX

DOCX

PDF
Gsm physical and-logical_channels 
PPT
2 g training optimization 
PDF

PDF
Sdcch 121130233301-phpapp02 
PPT
2gtrainingoptimization-150301041427-conversion-gate02.ppt 
DOCX

PDF

PDF
Recently uploaded

PPTX
Approach_to_Headache ( Primary and secondary headaches ) 
PPTX
Station Command Center.Station Command Center.Station Command Center. 
PPTX
EXPANDED DEFINITION G10.pptxggjtyefsdghesg 
PDF
Presentation - (ESP) Systems - by mattew Amao.pdf 
PDF
Week 5-6 Nation Building.pdf new 12345456 
PDF
ekenepatience.com an ebook by Ekene Patience (1).pdf 
PDF
L 22-24 Seed Processing, Processing and Upgrading equipments.pdf 
PDF
Expert Bentley Electrical Repair Services for Reliable Performance and Safe D... 
PDF
short story book by ekene patience.pdffffffff 
PPTX
ELECTRICAL-ELECTRONICS- AUTO SYMBOLS.pptx 
PPTX
blowbagets Orientation among 4th year Automotive technology students.pptx 
PDF
assessment Critical Care Nursing 2 theo.pdf 
PDF
Linkedin_Posts_2024_Blue.................... 
PPTX
Pharmacy-Management-System G.pptxt43676ww 
PDF
RESPECTED 021 BATCH 🔥 .pdftttttttttttttt 
PDF
operation maintenance manual - CAT caterpillar 246 skid steer loader pdf 
PPTX
The Future of Smart Cities Revolutionizing Urban Landscapes Through Intellige... 
PPTX
True World Immigration - Market Trends Driving Global Migration.pptx WCDMA Optimization for new people to learn
- 1.
- 2.
Presentation Title —2 All rights reserved © 2004
Contents
> WCDMA Fundamentals(including link budget fundamentals)
> Radio Resource Utilization
> Coverage and Capacity issues
> Cell deployment
> WCDMA Radio Network Planning(including WCDMA-GSM
Co-planning issues )
> Co-existing TDD & FDD modes
- 3.
Presentation Title —3 All rights reserved © 2004
WCDMA Fundamentals
> WCDMA network infrastructure
> WCDMA radio interface protocol architecture
> WCDMA link level characteristics & indicators
> WCDMA link budget analysis
- 4.
Presentation Title —4 All rights reserved © 2004
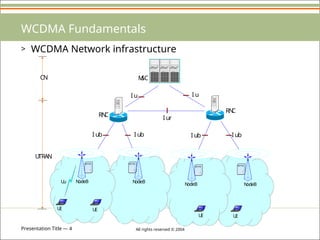
WCDMA Fundamentals
> WCDMA Network infrastructure
I u
I ur
I ub I ub
U
u
M
SC
RN
C
RN
C
N
odeB N
odeB
N
odeB N
odeB
U
E
CN
U
TRAN
I u
I ub I ub
U
E
U
E U
E
Data General Data General
Data General
- 5.
Presentation Title —5 All rights reserved © 2004
WCDMA Fundamentals
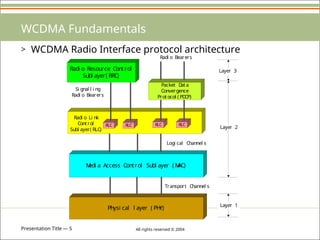
> WCDMA Radio Interface protocol architecture
Radi o Resource Control
Subl ayer( RRC)
M
edi a Access Control Subl ayer ( M
AC)
Physi cal l ayer ( PH
Y)
Packet D
ata
Convergence
Protocol ( PD
CP)
Radi o Li nk
Control
Subl ayer( RLC)
RLC RLC RLC RLC
Transport Channel s
Logi cal Channel s
Si gnal l i ng
Radi o Bearers
Radi o Bearers
Layer 3
Layer 2
Layer 1
- 6.
Presentation Title —6 All rights reserved © 2004
WCDMA Fundamentals
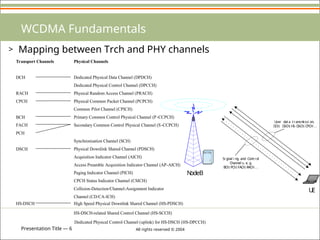
> Mapping between Trch and PHY channels
Transport Channels
DCH
RACH
CPCH
BCH
FACH
PCH
Physical Channels
Dedicated Physical Data Channel (DPDCH)
Dedicated Physical Control Channel (DPCCH)
Physical Random Access Channel (PRACH)
Physical Common Packet Channel (PCPCH)
Common Pilot Channel (CPICH)
Primary Common Control Physical Channel (P-CCPCH)
Secondary Common Control Physical Channel (S-CCPCH)
Synchronisation Channel (SCH)
Acquisition Indicator Channel (AICH)
Access Preamble Acquisition Indicator Channel (AP-AICH)
Paging Indicator Channel (PICH)
CPCH Status Indicator Channel (CSICH)
Collision-Detection/Channel-Assignment Indicator
Channel (CD/CA-ICH)
DSCH Physical Downlink Shared Channel (PDSCH)
HS-DSCH-related Shared Control Channel (HS-SCCH)
HS-DSCH High Speed Physical Downlink Shared Channel (HS-PDSCH)
Dedicated Physical Control Channel (uplink) for HS-DSCH (HS-DPCCH)
N
odeB
U
E
Si gnal i ng and Control
Channel s, e. g.
BCH
, PCH
, FACH
, RACH
. . .
U
ser data transm
i ssi on,
D
CH
, D
SCH
, H
S- D
SCH
, CPCH
. . .
- 7.
Presentation Title —7 All rights reserved © 2004
WCDMA Fundamentals
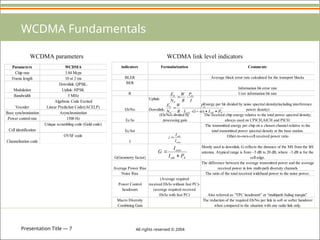
WCDMA link level indicators
indicators Formularization Comments
BLER Average block error rate calculated for the transport blocks
BER
Information bit error rate
R User information bit rate
Eb/No
Uplink:
Downlink:
Energy per bit divided by noise spectral density(including interference
power density)
Ec/Io
(Eb/No) divided by
processing gain
The received chip energy relative to the total power spectral density;
always used on CPICH,AICH and PICH.
Ec/Ior
The transmitted energy per chip on a chosen channel relative to the
total transmitted power spectral density at the base station.
I
Other-to-own-cell received power ratio
G(Geometry factor)
Mostly used in downlink, G reflects the distance of the MS from the BS
antenna. Atypical range is from –3 dB to 20 dB, where –3 dB is for the
cell edge.
Average Power Rise
The difference between the average transmitted power and the average
received power in low multi-path diversity channels
Noise Rise The ratio of the total received wideband power to the noise power.
Power Control
headroom
(Average required
received Eb/Io without fast PC)-
(average required received
Eb/Io with fast PC) Also referred as “TPC headroom” or “multipath fading margin”
Macro Diversity
Combining Gain
The reduction of the required Eb/No per link in soft or softer handover
when compared to the situation with one radio link only.
I
P
R
W
N
E rx
b
0
N
oth
own
rx
b
P
I
I
P
R
W
N
E
)
1
(
0
own
oth
I
I
i
N
oth
own
P
I
I
G
Parameters WCDMA
Chip rate 3.84 Mcps
Frame length 10 or 2 ms
Modulation
Downlink: QPSK;
Uplink: HPSK
Bandwidth 5 MHz
Vocoder
Algebraic Code Excited
Linear Prediction Coder(ACELP)
Base synchronization Asynchronization
Power control rate 1500 Hz
Cell identification
Unique scrambling code (Gold code)
Channelization code
OVSF code
WCDMA parameters
- 8.
Presentation Title —8 All rights reserved © 2004
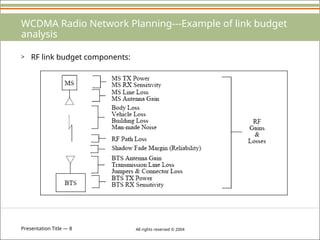
WCDMA Radio Network Planning---Example of link budget
analysis
> RF link budget components:
- 9.
Presentation Title —9 All rights reserved © 2004
WCDMA Radio Network Planning---Example of link
budget analysis
Allowed propagation loss
for cell range[dB] 141.9 v=r-s+t-u
Transmitter(mobile)
Max. Txpower[dBm] 21 a
Mobile antenna gain[dBi] 0 b
Body loss[dB] 3 c
Equivalent Isotropic
Radiated power
(EIRP)[dBm] 18 d=a+b-c
Receiver(base station)
Thermal noise density
[dBm/Hz] -174 e
Base station receiver
noise figure[dB] 5 f
Receiver noise density
[dBm/Hz] -169 g=e+f
Receiver noise power
[dBm] -103.2 h=g+10*log(3840000)
Interference margin[dB] 3 I
Receiver interference
power[dBm] -103.2 j=10*log(10^((h+i)/10)-10^(h/10))
Total effectve noise +
interference [dBm] -100.2 k=10*log(10^(h/10)+10^(j/10))
Processing gain[dB] 25 l=10*log(3840/12.2)
Required Eb/No[dB] 5 m
Receiver sensitivity[dBm] -120.2 n=m-l+k
Base station antenna
gain[dBi] 18 o
Max_path_loss=Ptx_EIRP - Prx_receiver_sensitivity
-Lrx_cable+ Grx_antenna
Cable loss in the base
station[dB] 2 p
Fast fading margin[dB] 0 q
Max.path loss[dB] 154.2 r=d-n+o-p-q
Allowed_propagation_loss=Max_path_loss
-Log_normal_fading_margin
+soft_handover_margin
-in_car_loss
Example of RLB for 12.2 kbps voice service(uplink,120km/h,in-car users,VA channel with soft handover)
Example of RLB for 12.2 kbps voice service(uplink,120km/h,in-car users,VA channel with soft handover)
Coverage probability[%] 95
Log normal fading
constant[dB] 7
Propagation model exponent 3.52
Log normal fading margin
[dB] 7.3 s
Soft handover gain[dB] 3 t
In-car loss[dB] 8 u
(*) *“modeling the impact of the fast power control on the WCDMA uplink”, sipila,K., Laiho-Steffens,J.,Jasberg,M. and Wacker.A, Proc VTC99’ Spring Huston,Texas,May 1999 pp.1266-
A headroomfor mobile station to maintain
adequate closed loop fast power control. This
applies especially to slow-moving pedestrian
mobiles.Typical values are 2.0-5.0 dB for slow-
moving mobiles(*)
handovers give a gin against slow fading by
reducing the required log-normal fading margin;it
also gives an additional macro diversity gain
against fast fading by reducing the required
Eb/No due to the effect of macro diversity
combining.
the margin required to provide a specified
coverage availability over the individual cells.
For a 95% coverage with a standard shadowing
deviation of 6.0dB and path loss model with
n=3.6 we need a shadowing margin of
approximately 6.0dB
Closely related with the loading of the cell which
subsequently affects the coverage. For coverage-
limited cases a smaller interference margin is
suggested,while in capacity-limited cases a larger
interference margin should be used. Typical value
for the interference margin in the coverage-limited
cases are 1.0-3.0 dB corresponding to 20-50%
loading.
- 10.
Presentation Title —10 All rights reserved © 2004
Handover
Control
Power Control
Resource
Manager
Admission
control
Load control
Packet data
scheduling
Congestion Control
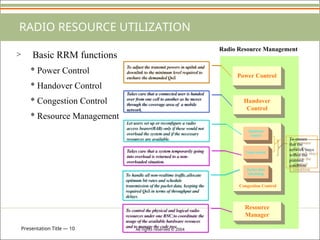
Radio Resource Management
RADIO RESOURCE UTILIZATION
To adjust the transmit powers in upilnk and
downlink to the minimum level required to
enshure the demanded QoS
Takes care that a connected user is handed
over from one cell to another as he moves
through the coverage area of a mobile
network.
To ensure
that the
network stays
within the
planned
condition
Let users set up or reconfigure a radio
access bearer(RAB) only if these would not
overload the system and if the necessary
resources are available.
Takes care that a system temporarily going
into overload is returned to a non-
overloaded situation.
To handle all non-realtime traffic,allocate
optimum bit rates and schedule
transmission of the packet data, keeping the
required QoS in terms of throughput and
delays.
To control the physical and logical radio
resources under one RNC;to coordinate the
usage of the available hardware resouces
and to manage the code tree.
> Basic RRM functions
* Power Control
* Handover Control
* Congestion Control
* Resource Management
- 11.
Presentation Title —11 All rights reserved © 2004
RADIO RESOURCE UTILIZATION---power control(1)
> UMTS Power Control(PC) summary
- 12.
Presentation Title —12 All rights reserved © 2004
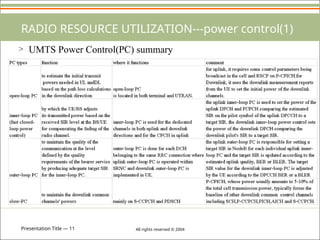
RADIO RESOURCE UTILIZATION---power control(2)
> Uplink/Downlink inner- and outer- loop power control
NBAP: initial target SIR,DL initial/max/min
RL power, DL TPC_step,DPC_MODE
NodeB
UE
SRNC
RRC:DL target BLER, UL gain factors, UL TPC_step, PC algorithm, UL RM
values, DPC_MODE
RRC: actual BLER,P-CPICH Ec/Io,P-CPICH RSCP, path loss, traffic+UE internal means
PC on DPCCH + DPDCHs
UL/DL TPC command on DPCCH(Inner loop PC)
DCH-FP(10-100Hz):UL CRC and QE
UL actual target SIR
Iub
Uu
SIR estimates Vs target Sir
UL TPC commands
DL outer loop PC
SIR_step=f(BLER or BER)
SIR target management
SIR estimate vs. target SIR
DL TPC commands
UL outer loop PC
SIR_step=f(BLER or BER)
SIR target management
MDC and splitting
- 13.
Presentation Title —13 All rights reserved © 2004
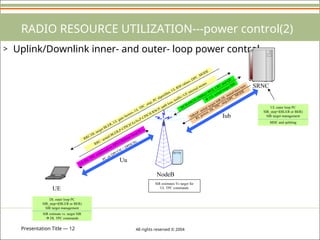
RADIO RESOURCE UTILIZATION---handover control
> Soft-Handover:Example of Soft Handover Algorithm
Event 1A: A P-CPICH enters the reporting range
)
2
(
log
10
)
1
(
log
10
log
10 1
1
10
1
10
10 a
a
Best
N
i
i
new H
R
M
W
M
W
M
A
Event 1B: A P-CPICH leaves the reporting range
)
2
(
log
10
)
1
(
log
10
log
10 1
1
10
1
10
10 b
b
Best
N
i
i
old H
R
M
W
M
W
M
A
Event 1C: A non-active PCPICH becomes better than
an active one
Event 1D: change of best cell. Reporting event is
triggered when any P-CPICH in the reporting range
becomes better than the current bet one plus an
optional hysteresis value.
Event 1E: A P-CPICH becomes better than an
absolute threshold plus an optional hysteresis value.
Event 1F: A P-CPICH becomes worse than an
absolute threshold minus an optional hysteresis value.
Addition window
drop window
AS_Th – AS_Th_Hyst
As_Rep_Hyst
As_Th + As_Th_Hyst
Cell 1 Connected
Event 1A
Add Cell 2
Event 1C
Replace Cell 1 with Cell 3
Event 1B
Remove Cell 3
CPICH 1
CPICH 2
CPICH 3
Time
Measurement
Quantity
T T T
N
odeB 1
SRN
C
I ub M
acro D
i versi ty
com
bi ni ng
N
odeB 2
Iub
T
P
C
c
o
m
m
a
n
d
1
t
r
a
n
s
m
i
s
s
i
o
n
l
i
n
k
1
U
E i n SH
O
T
P
C
c
o
m
m
a
n
d
2
t
r
a
n
s
m
i
s
s
i
o
n
l
i
n
k
2
- 14.
Presentation Title —14 All rights reserved © 2004
RADIO RESOURCE UTILIZATION---PC and SHO
conclusion
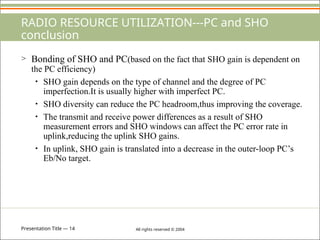
> Bonding of SHO and PC(based on the fact that SHO gain is dependent on
the PC efficiency)
• SHO gain depends on the type of channel and the degree of PC
imperfection.It is usually higher with imperfect PC.
• SHO diversity can reduce the PC headroom,thus improving the coverage.
• The transmit and receive power differences as a result of SHO
measurement errors and SHO windows can affect the PC error rate in
uplink,reducing the uplink SHO gains.
• In uplink, SHO gain is translated into a decrease in the outer-loop PC’s
Eb/No target.
- 15.
Presentation Title —15 All rights reserved © 2004
RADIO RESOURCE UTILIZATION---congestion
control
> Air interface load definition(load control principles)
• Uplink
• Wideband power-based uplink loading
where
• Throughput-based uplink loading
• Downlink
• Wideband power-based downlink loading
• Throughput-based downlink loading
or
rxTotal
oth
own
UL
P
I
I
N
oth
own
rxTotal P
I
I
p
k
k
k
k
UL i
R
W
)
1
(
1
1
max
tx
rxTotoal
DL
P
P
max
1
R
R
N
k
k
DL
N
k
k
k
k
DL
DL
W
R
i
1
)
(
]
)
1
[(
- 16.
Presentation Title —16 All rights reserved © 2004
RADIO RESOURCE UTILIZATION---congestion
control (cont’d)
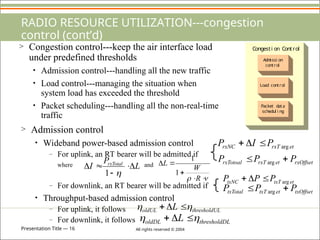
> Congestion control---keep the air interface load
under predefined thresholds
• Admission control---handling all the new traffic
• Load control---managing the situation when
system load has exceeded the threshold
• Packet scheduling---handling all the non-real-time
traffic
Adm
i ssi on
control
Load control
Packet data
schedul i ng
Congesti on Control
> Admission control
• Wideband power-based admission control
– For uplink, an RT bearer will be admitted if
where and
– For downlink, an RT bearer will be admitted if
• Throughput-based admission control
– For uplink, it follows
– For downlink, it follows
et
rxT
rxNC P
I
P arg
rxOffset
et
rxT
rxTotoal P
P
P
arg
L
P
I rxTotal
1
R
W
L
1
1
et
txT
txNC P
P
P arg
txOffset
et
txT
txTotal P
P
P
arg
L
thresholdU
oldUL L
L
thresholdD
oldDL L
- 17.
Presentation Title —17 All rights reserved © 2004
RADIO RESOURCE UTILIZATION---congestion
control (cont’d)
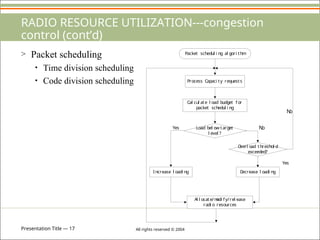
> Packet scheduling
• Time division scheduling
• Code division scheduling
Packet schedul i ng al gori thm
Process Capaci ty requests
Cal cul ate l oad budget f or
packet schedul i ng
Load bel ow target
l evel ?
O
verl oad threshol d
exceeded?
I ncrease l oadi ng D
ecrease l oadi ng
Al l ocate/m
odi f y/rel ease
radi o resources
Yes N
o
Yes
N
o
- 18.
Presentation Title —18 All rights reserved © 2004
RADIO RESOURCE UTILIZATION---Code Planning
> Code planning
• Code allocation is under the control of RNC.
• Code tree may become “fragmented” and code reshuffling is
needed(arranged by RNC).
> Code allocation
• Scrambling and spreading code allocation for uplink(by
UTRAN)
• Scrambling and spreading code allocation for downlink
• Downlink channelisation code allocation (by UTRAN)
• Downlink scrambling code planning
• 512 scrambling codes subdivided into 64 groups each of
eight codes
- 19.
Presentation Title —19 All rights reserved © 2004
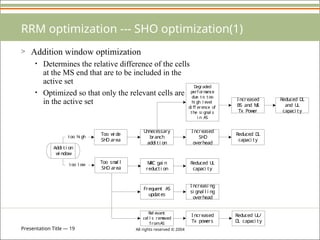
RRM optimization --- SHO optimization(1)
> Addition window optimization
• Determines the relative difference of the cells
at the MS end that are to be included in the
active set
• Optimized so that only the relevant cells are
in the active set
Addi ti on
w
i ndow
Too w
i de
SH
O area
Too sm
al l
SH
O area
U
nnecessary
branch
addi ti on
M
RC gai n
reducti on
I ncreased
SH
O
overhead
Reduced D
L
capaci ty
D
egraded
perf orm
ance
due to too
hi gh l evel
di ff erence of
the si gnal s
i n AS
I ncreased
BS and M
S
Tx Pow
er
Reduced D
L
and U
L
capaci ty
Frequent AS
updates
Rel evant
cel l s rem
oved
f romAS
Reduced U
L
capaci ty
I ncreasi ng
si gnal l i ng
overhead
I ncreased
Tx pow
ers
Reduced U
L/
D
L capaci ty
too hi gh
too l ow
- 20.
Presentation Title —20 All rights reserved © 2004
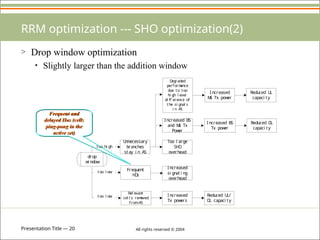
RRM optimization --- SHO optimization(2)
> Drop window optimization
• Slightly larger than the addition window
drop
w
i ndow
U
nnecessary
branches
stay i n AS
Frequent
H
O
s
Too l arge
SH
O
overhead
I ncreased
si gnal i ng
overhead
D
egraded
perform
ance
due to too
hi gh l evel
di ff erence of
the si gnal s
i n AS
I ncreased BS
and M
S Tx
Pow
er
I ncreased BS
Tx pow
er
Rel evant
cel l s rem
oved
fromAS
I ncreased
Tx pow
ers
Reduced U
L/
D
L capaci ty
too hi gh
too l ow
Reduced D
L
capaci ty
I ncreased
M
S Tx pow
er
Reduced U
L
capaci ty
too l ow
Frequent and
delayed Hos (cells
ping-pong in the
active set)
- 21.
Presentation Title —21 All rights reserved © 2004
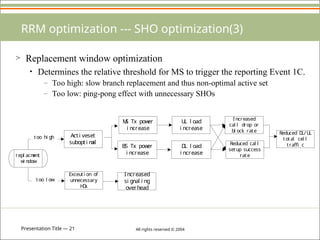
RRM optimization --- SHO optimization(3)
> Replacement window optimization
• Determines the relative threshold for MS to trigger the reporting Event 1C.
– Too high: slow branch replacement and thus non-optimal active set
– Too low: ping-pong effect with unnecessary SHOs
repl acm
ent
w
i ndow
Acti veset
subopti m
al
Exceuti on of
unnecessary
H
O
s
M
S Tx pow
er
i ncrease
I ncreased
si gnal i ng
overhead
BS Tx pow
er
i ncrease
D
L l oad
i ncrease
too hi gh
too l ow
Reduced cal l
setup success
rate
U
L l oad
i ncrease
I ncreased
cal l drop or
bl ock rate Reduced D
L/U
L
total cel l
traffi c
- 22.
Presentation Title —22 All rights reserved © 2004
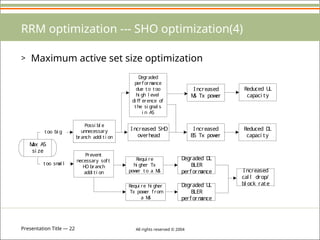
RRM optimization --- SHO optimization(4)
> Maximum active set size optimization
M
ax AS
si ze
Possi bl e
unnecessary
branch addi ti on
Prevent
necessary sof t
H
O branch
addi ti on
Requi re
hi gher Tx
pow
er to a M
S
I ncreased
BS Tx pow
er
Reduced D
L
capaci ty
D
egraded
perform
ance
due to too
hi gh l evel
di ff erence of
the si gnal s
i n AS
Reduced U
L
capaci ty
Requi re hi gher
Tx pow
er f rom
a M
S
D
egraded D
L
BLER
perf orm
ance
D
egraded U
L
BLER
perf orm
ance
I ncreased
cal l drop/
bl ock rate
too bi g
too sm
al l
I ncreased SH
O
overhead
I ncreased
M
S Tx pow
er
- 23.
Presentation Title —23 All rights reserved © 2004
RADIO RESOURCE UTILIZATION --- SHO
optimization conclusion
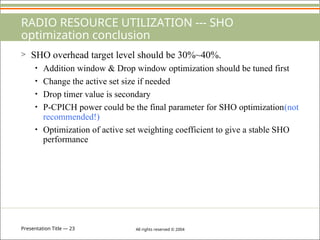
> SHO overhead target level should be 30%~40%.
• Addition window & Drop window optimization should be tuned first
• Change the active set size if needed
• Drop timer value is secondary
• P-CPICH power could be the final parameter for SHO optimization(not
recommended!)
• Optimization of active set weighting coefficient to give a stable SHO
performance
- 24.
Presentation Title —24 All rights reserved © 2004
Coverage and Capacity issues
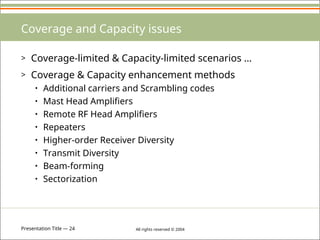
> Coverage-limited & Capacity-limited scenarios …
> Coverage & Capacity enhancement methods
• Additional carriers and Scrambling codes
• Mast Head Amplifiers
• Remote RF Head Amplifiers
• Repeaters
• Higher-order Receiver Diversity
• Transmit Diversity
• Beam-forming
• Sectorization
- 25.
Presentation Title —25 All rights reserved © 2004
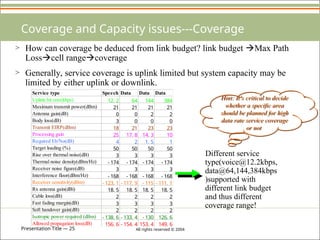
Coverage and Capacity issues---Coverage
Different service
type(voice@12.2kbps,
data@64,144,384kbps
)supported with
different link budget
and thus different
coverage range!
> How can coverage be deduced from link budget? link budget Max Path
Losscell rangecoverage
> Generally, service coverage is uplink limited but system capacity may be
limited by either uplink or downlink.
Hint: It’s critical to decide
whether a specific area
should be planned for high
data rate service coverage
or not
Service type Speech Data Data Data
Uplink bit rate(kbps) 12. 2 64 144 384
Maximum transmit power(dBm) 21 21 21 21
Antenna gain(dB) 0 0 2 2
Body loss(dB) 3 0 0 0
Transmit EIRP(dBm) 18 21 23 23
Processing gain 25 17. 8 14. 3 10
Required Eb/No(dB) 4 2 1. 5 1
Target loading (%) 50 50 50 50
Rise over thermal noise(dB) 3 3 3 3
Thermal noise density(dBm/Hz) - 174 - 174 - 174 - 174
Receiver noise figure(dB) 3 3 3 3
Interference floor(dBm/Hz) - 168 - 168 - 168 - 168
Receiver sensitivity(dBm) - 123. 1 - 117. 9 - 115 - 111. 1
Rx antenna gain(dBi) 18. 5 18. 5 18. 5 18. 5
Cable loss(dB) 2 2 2 2
Fast fading margin(dB) 3 3 3 3
Soft handover gain(dB) 2 2 2 2
Isotropic power required (dBm) - 138. 6 - 133. 4 - 130 126. 6
Allowed propagation loss(dB) 156. 6 - 154. 4 153. 4 149. 6
- 26.
Presentation Title —26 All rights reserved © 2004
Coverage and Capacity issues---Capacity
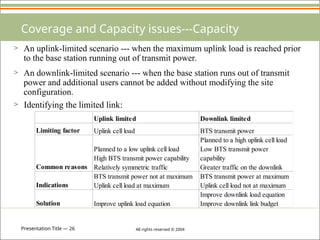
> An uplink-limited scenario --- when the maximum uplink load is reached prior
to the base station running out of transmit power.
> An downlink-limited scenario --- when the base station runs out of transmit
power and additional users cannot be added without modifying the site
configuration.
> Identifying the limited link:
Uplink limited Downlink limited
Limiting factor Uplink cell load BTS transmit power
Common reasons
Planned to a low uplink cell load
High BTS transmit power capability
Relatively symmetric traffic
Planned to a high uplink cell load
Low BTS transmit power
capability
Greater traffic on the downlink
Indications
BTS transmit power not at maximum
Uplink cell load at maximum
BTS transmit power at maximum
Uplink cell load not at maximum
Solution Improve uplink load equation
Improve downlink load equation
Improve downlink link budget
- 27.
Presentation Title —27 All rights reserved © 2004
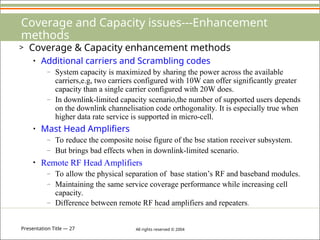
Coverage and Capacity issues---Enhancement
methods
> Coverage & Capacity enhancement methods
• Additional carriers and Scrambling codes
– System capacity is maximized by sharing the power across the available
carriers,e.g, two carriers configured with 10W can offer significantly greater
capacity than a single carrier configured with 20W does.
– In downlink-limited capacity scenario,the number of supported users depends
on the downlink channelisation code orthogonality. It is especially true when
higher data rate service is supported in micro-cell.
• Mast Head Amplifiers
– To reduce the composite noise figure of the bse station receiver subsystem.
– But brings bad effects when in downlink-limited scenario.
• Remote RF Head Amplifiers
– To allow the physical separation of base station’s RF and baseband modules.
– Maintaining the same service coverage performance while increasing cell
capacity.
– Difference between remote RF head amplifiers and repeaters.
- 28.
Presentation Title —28 All rights reserved © 2004
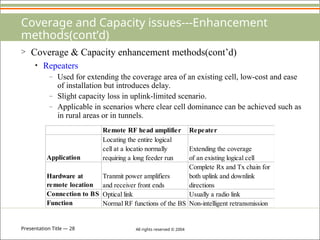
Coverage and Capacity issues---Enhancement
methods(cont’d)
> Coverage & Capacity enhancement methods(cont’d)
• Repeaters
– Used for extending the coverage area of an existing cell, low-cost and ease
of installation but introduces delay.
– Slight capacity loss in uplink-limited scenario.
– Applicable in scenarios where clear cell dominance can be achieved such as
in rural areas or in tunnels.
Remote RF head amplifier Repeater
Application
Locating the entire logical
cell at a locatio normally
requiring a long feeder run
Extending the coverage
of an existing logical cell
Hardware at
remote location
Tranmit power amplifiers
and receiver front ends
Complete Rx and Tx chain for
both uplink and downlink
directions
Connection to BS Optical link Usually a radio link
Function Normal RF functions of the BS Non-intelligent retransmission
- 29.
Presentation Title —29 All rights reserved © 2004
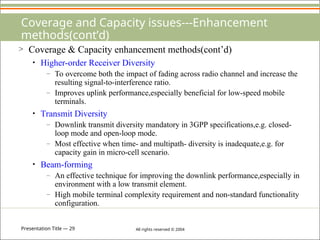
Coverage and Capacity issues---Enhancement
methods(cont’d)
> Coverage & Capacity enhancement methods(cont’d)
• Higher-order Receiver Diversity
– To overcome both the impact of fading across radio channel and increase the
resulting signal-to-interference ratio.
– Improves uplink performance,especially beneficial for low-speed mobile
terminals.
• Transmit Diversity
– Downlink transmit diversity mandatory in 3GPP specifications,e.g. closed-
loop mode and open-loop mode.
– Most effective when time- and multipath- diversity is inadequate,e.g. for
capacity gain in micro-cell scenario.
• Beam-forming
– An effective technique for improving the downlink performance,especially in
environment with a low transmit element.
– High mobile terminal complexity requirement and non-standard functionality
configuration.
- 30.
Presentation Title —30 All rights reserved © 2004
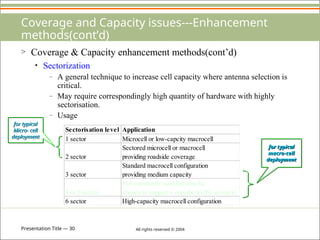
Coverage and Capacity issues---Enhancement
methods(cont’d)
> Coverage & Capacity enhancement methods(cont’d)
• Sectorization
– A general technique to increase cell capacity where antenna selection is
critical.
– May require correspondingly high quantity of hardware with highly
sectorisation.
– Usage
for typical
Micro- cell
deployment
Sectorisation level Application
1 sector Microcell or low-capcity macrocell
2 sector
Sectored microcell or macrocell
providing roadside coverage
3 sector
Standard macrocell configuration
providing medium capacity
4 or 5 sector
Not commonly used but may be
chosen to support a specific traffic scenario
6 sector High-capacity macrocell configuration
for typical
macro-cell
deployment
- 31.
Presentation Title —31 All rights reserved © 2004
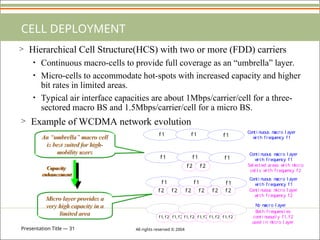
CELL DEPLOYMENT
> Hierarchical Cell Structure(HCS) with two or more (FDD) carriers
• Continuous macro-cells to provide full coverage as an “umbrella” layer.
• Micro-cells to accommodate hot-spots with increased capacity and higher
bit rates in limited areas.
• Typical air interface capacities are about 1Mbps/carrier/cell for a three-
sectored macro BS and 1.5Mbps/carrier/cell for a micro BS.
f 1 f 1 f 1
f 1 f 1 f 1
f 2
f 1 f 1 f 1
f 2
f 2 f 2 f 2 f 2 f 2 f 2
f 1, f 2 f 1, f 2 f 1, f 2 f 1, f 2 f 1, f 2 f 1, f 2
Conti nuous m
acro l ayer
w
i th frequency f1
Conti nuous m
acro l ayer
w
i th frequency f1
Sel ected areas w
i th m
i cro
cel l s w
i th f requency f 2
Conti nuous m
acro l ayer
w
i th frequency f1
Conti nuous m
i cro l ayer
w
i th frequency f2
Both frequenci es
conti nuousl y f 1, f 2
used i n m
i cro l ayer
N
o m
acro l ayer
> Example of WCDMA network evolution
An “umbrella” macro cell
is best suited for high-
mobility users
Micro layer provides a
very high capacity in a
limited area
Capacity
enhancement
- 32.
Presentation Title —32 All rights reserved © 2004
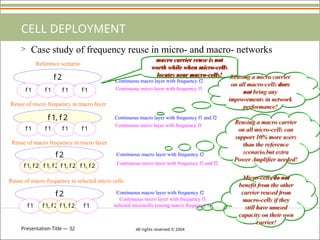
CELL DEPLOYMENT
> Case study of frequency reuse in micro- and macro- networks
f 2
f 2
f 2
f 1 f 1, f 2 f 1, f 2 f 1
Continuous macro layer with frequency f2
Continuous micro layer with frequency f1 and f2
f 1, f 2
f 1 f 1 f 1 f 1
f 1 f 1 f 1 f 1
f 1, f 2 f 1, f 2 f 1, f 2 f 1, f 2
Reference scenario
Continuous macro layer with frequency f2
Continuous micro layer with frequency f1
Continuous macro layer with frequency f1 and f2
Continuous micro layer with frequency f1
Continuous macro layer with frequency f2
Continuous micro layer with frequency f1
selected microcells reusing macro frequency f2
Reuse of micro frequency in macro layer
Reuse of macro frequency in micro layer
Reuse of macro frequency in selected micro cells
Reusing a micro carrier
on all macro-cells does
not bring any
improvements in network
performance!
Reusing a macro carrier
on all micro-cells can
support 10% more users
than the reference
scenario,but extra
Power Amplifier needed!
Micro-cells do not
benefit from the other
carrier reused from
macro-cells if they
still have unused
capacity on their own
carrier!
macro carrier reuse is not
worth while when micro-cells
locates near macro-cells!
- 33.
Presentation Title —33 All rights reserved © 2004
WCDMA Radio Network Planning
> overview
> Dimensioning
> Detailed planning
> Optimization aspects
> Adjacent carrier interference
> WCDMA & GSM Co-Planning
- 34.
Presentation Title —34 All rights reserved © 2004
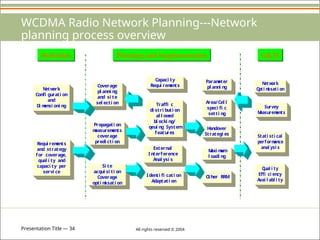
WCDMA Radio Network Planning---Network
planning process overview
Definition Planning and Implementation O&M
N
etw
ork
Confi gurati on
and
D
i m
ensi oni ng
Requi rem
ents
and strategy
for coverage,
qual i ty and
capaci ty per
servi ce
Coverage
pl anni ng
and si te
sel ecti on
Propagati on
m
easurem
ents
coverage
predi cti on
Si te
acqui si ti on
Coverage
opti m
i sati on
Capaci ty
Requi rem
ents
Traffi c
di stri buti on
al l ow
ed
bl ocki ng/
qeui ng System
features
External
Interference
Anal ysi s
Identi fi cati on
Adaptati on
Param
eter
pl anni ng
Area/Cel l
speci fi c
setti ng
H
andover
Strategi es
M
axi m
um
l oadi ng
O
ther RRM
N
etw
ork
O
pti m
i sati on
Survey
M
easurem
ents
Stati sti cal
perform
ance
anal ysi s
Q
ual i ty
Effi ci ency
Avai l abl i ty
- 35.
Presentation Title —35 All rights reserved © 2004
WCDMA Radio Network Planning ---Dimensioning(1)
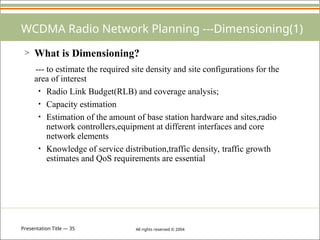
> What is Dimensioning?
--- to estimate the required site density and site configurations for the
area of interest
• Radio Link Budget(RLB) and coverage analysis;
• Capacity estimation
• Estimation of the amount of base station hardware and sites,radio
network controllers,equipment at different interfaces and core
network elements
• Knowledge of service distribution,traffic density, traffic growth
estimates and QoS requirements are essential
- 36.
Presentation Title —36 All rights reserved © 2004
WCDMA Radio Network Planning ---Dimensioning(2)
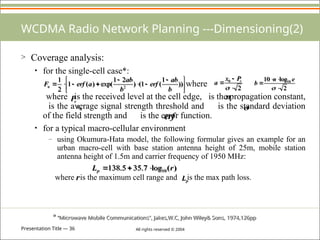
> Coverage analysis:
• for the single-cell case*:
where
where is the received level at the cell edge, is the propagation constant,
is the average signal strength threshold and is the standard deviation
of the field strength and is the error function.
• for a typical macro-cellular environment
– using Okumura-Hata model, the following formular gives an example for an
urban macro-cell with base station antenna height of 25m, mobile station
antenna height of 1.5m and carrier frequency of 1950 MHz:
where is the maximum cell range and is the max path loss.
))
1
(
1
(
)
2
1
exp(
)
(
1
2
1
2
b
ab
erf
b
ab
a
erf
Fu
2
0
r
P
x
a
2
log
10 10
e
n
b
r
P n
0
x
erf
)
(
log
7
.
35
5
.
138 10 r
Lp
r p
L
* “Microwave Mobile Communications”, Jakes,W.C, John Wiley& Sons, 1974,126pp
- 37.
Presentation Title —37 All rights reserved © 2004
WCDMA Radio Network Planning ---Dimensioning(3)
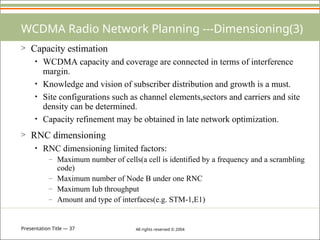
> Capacity estimation
• WCDMA capacity and coverage are connected in terms of interference
margin.
• Knowledge and vision of subscriber distribution and growth is a must.
• Site configurations such as channel elements,sectors and carriers and site
density can be determined.
• Capacity refinement may be obtained in late network optimization.
> RNC dimensioning
• RNC dimensioning limited factors:
– Maximum number of cells(a cell is identified by a frequency and a scrambling
code)
– Maximum number of Node B under one RNC
– Maximum Iub throughput
– Amount and type of interfaces(e.g. STM-1,E1)
- 38.
Presentation Title —38 All rights reserved © 2004
WCDMA Radio Network Planning ---Dimensioning(4)
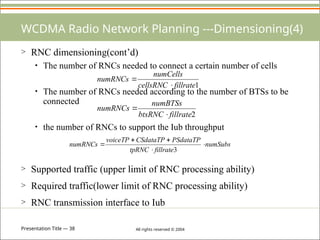
> RNC dimensioning(cont’d)
• The number of RNCs needed to connect a certain number of cells
• The number of RNCs needed according to the number of BTSs to be
connected
• the number of RNCs to support the Iub throughput
> Supported traffic (upper limit of RNC processing ability)
> Required traffic(lower limit of RNC processing ability)
> RNC transmission interface to Iub
2
fillrate
btsRNC
numBTSs
numRNCs
1
fillrate
cellsRNC
numCells
numRNCs
numSubs
fillrate
tpRNC
PSdataTP
CSdataTP
voiceTP
numRNCs
3
- 39.
Presentation Title —39 All rights reserved © 2004
WCDMA Radio Network Planning ---Detailed
Planning(1)
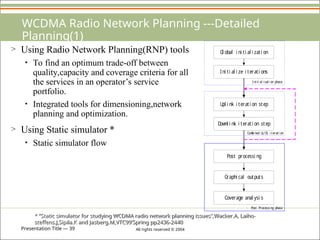
> Using Radio Network Planning(RNP) tools
• To find an optimum trade-off between
quality,capacity and coverage criteria for all
the services in an operator’s service
portfolio.
• Integrated tools for dimensioning,network
planning and optimization.
> Using Static simulator *
• Static simulator flow
* “Static simulator for studying WCDMA radio network planning issues”,Wacker.A, Laiho-
steffens.J,Sipila.K and Jasberg.M,VTC99’Spring pp2436-2440
Gl obal i ni ti al i zati on
Ini ti al i ze i terati ons
Upl i nk i terati on step
Dow
nl i nk i terati on step
Post processi ng
Graphi cal outputs
Coverage anal ysi s
Ini ti al i sati on phase
Com
bi ned UL/DL i terati on
Post Processi ng phase
- 40.
Presentation Title —40 All rights reserved © 2004
Creating a plan/
load maps
Importing/creating
and editing sites and
cells
Link loss calculation
Propagation model
tuning
Importing
measurements
Importing/
generating and
refining traffic layers
Defining service
requirements
WCDMA
calculations
Analysis
Quality of Service
Neighbour cell
generation
reporting
WCDMA Radio Network Planning ---Detailed
Planning(2)
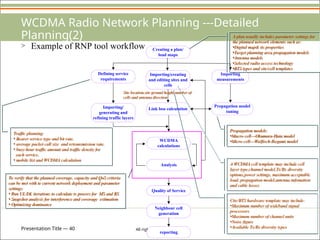
> Example of RNP tool workflow
A plan usually includes parameter settings for
the planned network elements such as:
•Digital map& its properties
•Target planning area propagation models
•Antenna models
•Selected radio access technology
•BTS types and site/cell templates
Site location,site ground height number of
cells and antenna direction
Traffic planning:
• Bearer service type and bit rate,
• average packet call size and retransmission rate,
• busy-hour traffic amount and traffic density for
each service,
• mobile list and WCDMA calculation
Cite/BTS hardware template may include:
•Maximum number of wideband signal
processors
•Maximum number of channel units
•Noise figure
•Available Tx/Rx diversity types
A WCDMA cell template may include cell
layer type,channel model,Tx/Rx diversity
options,power settings, maximum acceptable
load, propagation model,antenna infomation
and cable losses
To verify that the planned coverage, capacity and QoS criteria
can be met with te current network deployment and parameter
settings:
• Run UL/DL iterations to calculate tx powers for MS and BS
• Snapshot analysis for interference and coverage estimation
• Optimizing dominance
Propagation models:
•Macro cell---Okumura-Hata model
•Micro cell---Walfisch-Ikegami model
- 41.
Presentation Title —41 All rights reserved © 2004
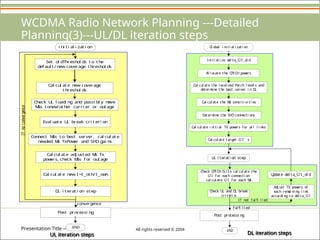
WCDMA Radio Network Planning ---Detailed
Planning(3)---UL/DL iteration steps
Set ol dThreshol ds t o t he
def aul t /new coverage t hreshol ds
Cal cul at e new coverage
t hreshol ds
Check U
L l oadi ng and possi bl y m
ove
M
Ss tonew
/ot her carri er or out age
Eval uat e U
L break cri t eri on
Connect M
Ss t o best server, cal cul at e
needed M
S TxPow
er and SH
O gai ns
Cal cul at e adj ust ed M
S Tx
pow
ers, check M
Ss f or out age
convergence
Cal cul at e new I =I _ot h/I _ow
n
D
L i t erat i on step
Post processi ng
EN
D
i ni t i al i zat i on
I
f
no
convergence
Ini ti al i ze del ta_C/I _ol d
Al l ocate the CPI CH pow
ers
Cal cul ate the recei ved Perch l evel s and
determ
i ne the best server i n D
L
Cal cul ate the M
S sensi ti vi ti es
D
eterm
i ne the SH
O connecti ons
Cal cul ate target C/I ’ s
f ul fi l l ed
U
L i terati on step
Check CPI CH Ec/Io cal cul ate the
C/I f or each connecti on
cal cul ate C/I f or each M
S
Post processi ng
EN
D
G
l obal i ni ti al i zati on
Cal cul ate i ni ti al TX pow
ers f or al l l i nks
Check U
L and D
L break
cri teri a
Adj ust TX pow
ers of
each rem
ai ni ng l i nk
accordi ng to del ta_C/I
U
pdate del ta_C/I _ol d
I f not f ul fi l l ed
UL iteration steps DL iteration steps
- 42.
Presentation Title —42 All rights reserved © 2004
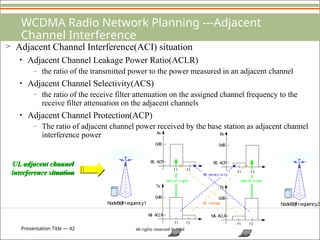
WCDMA Radio Network Planning ---Adjacent
Channel Interference
> Adjacent Channel Interference(ACI) situation
• Adjacent Channel Leakage Power Ratio(ACLR)
– the ratio of the transmitted power to the power measured in an adjacent channel
• Adjacent Channel Selectivity(ACS)
– the ratio of the receive filter attenuation on the assigned channel frequency to the
receive filter attenuation on the adjacent channels
• Adjacent Channel Protection(ACP)
– The ratio of adjacent channel power received by the base station as adjacent channel
interference power
N
odeB@
f requency1
0dB
BS ACP
Rx
0dB
M
S ACLR
Tx
0dB
BS ACP
Rx
0dB
M
S ACLR
Tx
f 1
f 1
f 1
f 2
f 2
f2
f 1
w
anted si gnal
f 2
w
anted si gnal
BS sel ecti vi ty
M
S l eakage N
odeB@
f requency2
UL adjacent channel
interference situation
- 43.
Presentation Title —43 All rights reserved © 2004
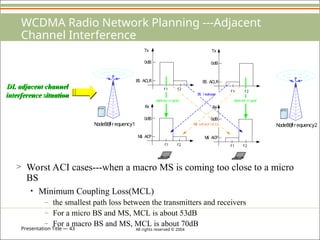
WCDMA Radio Network Planning ---Adjacent
Channel Interference
> Worst ACI cases---when a macro MS is coming too close to a micro
BS
• Minimum Coupling Loss(MCL)
– the smallest path loss between the transmitters and receivers
– For a micro BS and MS, MCL is about 53dB
– For a macro BS and MS, MCL is about 70dB
N
odeB@
f requency1
0dB
BS ACLR
Rx
0dB
M
S ACP
Tx
0dB
BS ACLR
Rx
0dB
M
S ACP
Tx
f 1
f 1
f 1
f2
f 2
f2
f 1
w
anted si gnal
f 2
w
anted si gnal
BS l eakage
M
S sel ecti vi ty N
odeB@
f requency2
DL adjacent channel
interference situation
- 44.
Presentation Title —44 All rights reserved © 2004
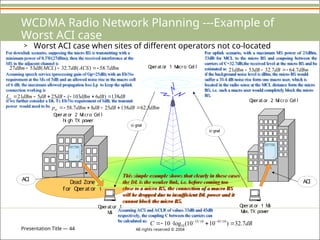
WCDMA Radio Network Planning ---Example of
Worst ACI case
> Worst ACI case when sites of different operators not co-located
D
ead Zone
f or O
perator 1
O
perator 1 M
S
M
ax. TX pow
er
si gnal
si gnal
ACI
ACI
O
perator 1
M
S
O
perator 2 M
i cro Cel l
hi gh TX pow
er
O
perator 2 M
i cro Cel l
O
perator 1 M
acro Cel l
Assuming ACS and ACLR of values 33dB and 45dB
respectively, the coupling C between the carriers can
be calculated as:
dB
C 7
.
32
)
10
10
(
log
10 10
/
45
10
/
33
10
For uplink scenario, with a maximum MS power of 21dBm,
53dB for MCL to the micro BS and coupoing between the
carriers of C=32.7dB,the received level at the micro BS and be
estimated as
if the background noise level is dBm, the micro BS would
suffer a 38.4 dB noise rise form one macro user, which is
located in the radio sense at the MCL distance form the micro
BS, i.e. such a macro user would completely block the micro
BS.
dBm
dB
dB
dBm 7
.
64
7
.
32
53
21
For downlink scenario, supposing the micro BS is transmitting with a
minimum power of 0.5W(27dBm); then the received interference at the
MS in the adjacent channel is
Assuming speech service (processing gain of Gp=25dB) with an Eb/No
requirement at the Ms of 5dB and an allowed noise rise in the macro cell
of 6 dB, the maximum allowed propagation loss Lp to keep the uplink
connection working is
if we further consider a DL Tx Eb/No requirement of 8dB, the transmit
power would need to be
dBm
ACS
dB
MCL
dB
dBm 7
.
58
)
(
7
.
32
)
(
53
27
dB
dB
dBm
dB
dB
dBm
Lp 138
)
6
103
(
25
5
21
dBm
dB
dB
dB
dBm
ptx 3
.
62
138
25
8
7
.
58
This simple example shows that clearly in these cases
the DL is the weaker link, i.e. before coming too
close to a micro BS, the connection of a macro BS
will be dropped due to insufficient DL power and it
cannot block the micro BS.
- 45.
Presentation Title —45 All rights reserved © 2004
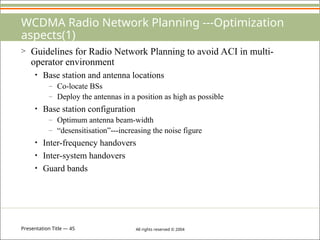
WCDMA Radio Network Planning ---Optimization
aspects(1)
> Guidelines for Radio Network Planning to avoid ACI in multi-
operator environment
• Base station and antenna locations
– Co-locate BSs
– Deploy the antennas in a position as high as possible
• Base station configuration
– Optimum antenna beam-width
– “desensitisation”---increasing the noise figure
• Inter-frequency handovers
• Inter-system handovers
• Guard bands
- 46.
Presentation Title —46 All rights reserved © 2004
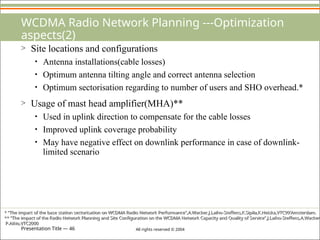
WCDMA Radio Network Planning ---Optimization
aspects(2)
> Site locations and configurations
• Antenna installations(cable losses)
• Optimum antenna tilting angle and correct antenna selection
• Optimum sectorisation regarding to number of users and SHO overhead.*
> Usage of mast head amplifier(MHA)**
• Used in uplink direction to compensate for the cable losses
• Improved uplink coverage probability
• May have negative effect on downlink performance in case of downlink-
limited scenario
* “The impact of the base station sectorisation on WCDMA Radio Network Performance”,A.Wacker,J.Laiho-Steffens,K.Sipila,K.Heiska,VTC99’Amsterdam.
** “The impact of the Radio Network Planning and Site Configuration on the WCDMA Network Capacity and Quality of Service”,J.Laiho-Steffens,A.Wacker,
P.Aikio,VTC2000
- 47.
Presentation Title —47 All rights reserved © 2004
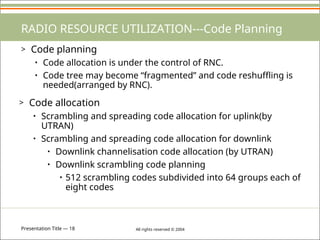
> Examples of maximum path losses with existing GSM and WCDMA system
WCDMA-GSM Co-Planning Issues
GSM900/
speech
GSM1800/
speech
WCDMA/
speech
WCDMA/
144kbps
WCDMA/
384kbps
Mobile transmission power[dBm] 33 30 21 21 21
Receiver sensitivity[dBm]
1
-110 -110 -124 -117 -113
Interference margin[dB]
2
1 0 2 2 2
Fast fading margin[dB]
3
2 2 2 2 2
Base station antenna gain[dBi]
4
16 18 18 18 18
Body loss[dB]
5
3 3 3
Mobile antenna gain[dBi]
6
0 0 0 2 2
Relative gain from lower
frequency compared to UMTS
frequency[dB]
7
11 1
Maximum path loss[dB] 164 154 156 154 150
1
WCDMA sensitivity assuems 4.0dB base station noise figure and Eb/No of 5dB for 12.2kbps speech,1.5dB for 144kbps and 1.0dB for 384kbps
data.GSM sensitivity is assumed to be -110dBmwith receive antenna diversity.
2
WCDMA interference margin corresponds to 37% loading of the pole capacity.An interference margin of 1.0dB is reserved for GSM900 because the
small amount of spectrumin 900MHz does not allow large reuse factors.
3
The fast fading margin for WCDMA includes the macro diversity gain against fast fading.
4
The atenna gain assumes three-sector configuration in both GSM and WCDMA.
5
The body loss accounts for the loss when the terminal is close to the user's head.
6
A 2.0dBi antenna gain is assumed for the data terminal.
7
The attenuation in 900MHz is assumed to be 11.0dB lower than in UMTS band and in GSM1800 band 1.0dB lower than in UMTS band.
- 48.
Presentation Title —48 All rights reserved © 2004
WCDMA-GSM Co-Planning Issues---interference
issues
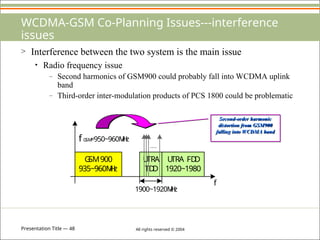
> Interference between the two system is the main issue
• Radio frequency issue
– Second harmonics of GSM900 could probably fall into WCDMA uplink
band
– Third-order inter-modulation products of PCS 1800 could be problematic
G
SM900
935~960M
H
z
U
TRA
TD
D
U
TRA FD
D
1920~1980
1900~1920M
H
z
fG
SM
=950~960M
H
z
f
Second-order harmonic
distortion from GSM900
falling into WCDMA band
- 49.
Presentation Title —49 All rights reserved © 2004
WCDMA-GSM Co-Planning Issues ---interference
issues
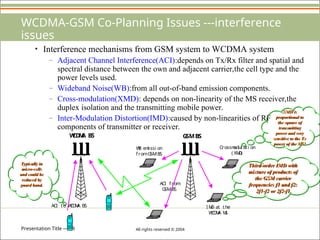
• Interference mechanisms from GSM system to WCDMA system
– Adjacent Channel Interference(ACI):depends on Tx/Rx filter and spatial and
spectral distance between the own and adjacent carrier,the cell type and the
power levels used.
– Wideband Noise(WB):from all out-of-band emission components.
– Cross-modulation(XMD): depends on non-linearity of the MS receiver,the
duplex isolation and the transmitting mobile power.
– Inter-Modulation Distortion(IMD):caused by non-linearities of RF
components of transmitter or receiver.
XMD is
proportional to
the square of
transmitting
power and very
sensitive to the Tx
power of the MS!
Typically in
micro-cells
and could be
reduced by
guard band.
W
CD
M
A BS G
SMBS
ACI to W
CD
M
A BS
ACI from
G
SMBS
I M
D at the
W
CD
M
A M
S
Crossm
odul ati on
( XM
D
)
W
B em
i ssi on
fromG
SMBS
Third-order IMD with
mixture of products of
the GSM carrier
frequencies f1 and f2:
2f1-f2 or 2f2-f1
- 50.
Presentation Title —50 All rights reserved © 2004
G
SM G
SM G
SM
W
CD
M
A W
CD
M
A W
CD
M
A
G
SM G
SM
U
rban area rural area
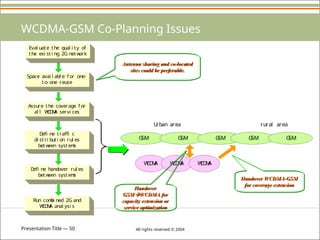
WCDMA-GSM Co-Planning Issues
Eval uate the qual i ty of
the exi st i ng 2G netw
ork
Space avai l abl e f or one-
to- one reuse
Assure the coverage f or
al l W
CD
M
A servi ces
D
efi ne t raffi c
di stri buti on rul es
betw
een syst em
s
D
efi ne handover rul es
betw
een syst em
s
Run com
bi ned 2G and
W
CD
M
A anal ysi s
Handover
GSMWCDMA for
capacity extension or
service optimization
Handover WCDMA-GSM
for coverage extension
Antenna sharing and co-located
sites could be preferable.
- 51.
Presentation Title —51 All rights reserved © 2004
Co-existing TDD & FDD modes ---UTRA TDD mode
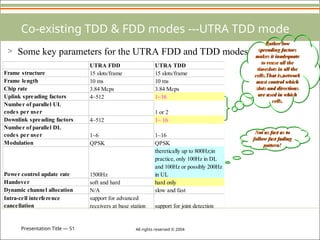
> Some key parameters for the UTRA FDD and TDD modes
Rather low
spreading factors
makes it inadequate
to reuse all the
timeslots in all the
cells.That is,network
must control which
slots and directions
are used in which
cells.
UTRA FDD UTRA TDD
Frame structure 15 slots/frame 15 slots/frame
Frame length 10 ms 10 ms
Chip rate 3.84 Mcps 3.84 Mcps
Uplink spreading factors 4~512 1~16
Number of parallel UL
codes per user 1 or 2
Downlink spreading factors 4~512 1~ 16
Number of parallel DL
codes per user 1~6 1~16
Modulation QPSK QPSK
Power control update rate 1500Hz
theretically up to 800Hz;in
practice, only 100Hz in DL
and 100Hz or possibly 200Hz
in UL
Handover soft and hard hard only
Dynamic channel allocation N/A slow and fast
Intra-cell interference
cancellation
support for advanced
receivers at base station support for joint detection
Not as fast as to
follow fast fading
pattern!
- 52.
Presentation Title —52 All rights reserved © 2004
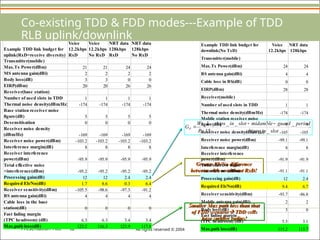
Co-existing TDD & FDD modes---Example of TDD
RLB uplink/downlink
Example TDD link budget for
uplink(RxD=receive diversity)
Voice
12.2kbps
RxD
Voice
12.2kbps
No RxD
NRT data
128kbps
RxD
NRT data
128kbps
No RxD
Transmitter(mobile)
Max.Tx Power(dBm) 21 21 24 24
MS antenna gain(dBi) 2 2 2 2
Body loss(dB) 3 3 0 0
EIRP(dBm) 20 20 26 26
Receiver(base station)
Number of used slots in TDD 1 1 1 1
Thermal noise density(dBm/Hz) -174 -174 -174 -174
Base station receiver noise
figure(dB) 5 5 5 5
Desensitisation 0 0 0 0
Receiver noise density
(dBm/Hz) -169 -169 -169 -169
Receiver noise power(dBm) -103.2 -103.2 -103.2 -103.2
Interference margin(dB) 8 8 8 8
Receiver interference
power(dBm) -95.9 -95.9 -95.9 -95.9
Total effective noise
+interference(dBm) -95.2 -95.2 -95.2 -95.2
Processing gain(dB) 12 12 2.4 2.4
Required Eb/No(dB) 1.7 8.6 0.3 6.4
Receiver sensitivity(dBm) -105.5 -98.6 -97.3 -91.2
BS antenna gain(dBi) 4 4 4 4
Cable loss in the base
station(dB) 0 0 0 0
Fast fading margin
(TPC headroom) (dB) 6.3 6.3 3.4 3.4
Max.path loss(dB) 123.2 116.3 123.9 117.8
slot
in
chips
period
guard
midamble
slot
in
chips
k
R
W
GP
_
_
_
_
_
15
Greater Eb/No difference
between with or without RxD!
Smaller Max path loss than that
of FDD scenario TDD cells
have smaller radius!
Example TDD link budget for
downlink(No TxD)
Voice
12.2kbps
NRT data
128kbps
Transmitter(mobile)
Max.Tx Power(dBm) 24 24
BS antenna gain(dBi) 4 4
Cable loss in BS(dB) 0 0
EIRP(dBm) 28 28
Receiver(mobile)
Number of used slots in TDD 1 1
Thermal noise density(dBm/Hz) -174 -174
Mobile station receiver noise
figure(dB) 9 9
Receiver noise density(dBm/Hz) -165 -165
Receiver noise power(dBm) -99.1 -99.1
Interference margin(dB) 8 8
Receiver interference
power(dBm) -91.9 -91.9
Total effective noise
+interference(dBm) -91.1 -91.1
Processing gain(dB) 12 2.4
Required Eb/No(dB) 9.4 6.7
Receiver sensitivity(dBm) -93.7 -86.8
Mobile antenna gain(dBi) 2 2
Body loss(dB) 3 0
Fast fading margin
(TPC headroom) (dB) 5.5 3.1
Max.path loss(dB) 115.2 113.7
- 53.
Presentation Title —53 All rights reserved © 2004
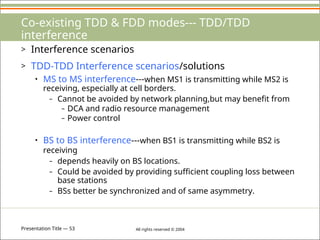
Co-existing TDD & FDD modes--- TDD/TDD
interference
> Interference scenarios
> TDD-TDD Interference scenarios/solutions
• MS to MS interference---when MS1 is transmitting while MS2 is
receiving, especially at cell borders.
– Cannot be avoided by network planning,but may benefit from
– DCA and radio resource management
– Power control
• BS to BS interference---when BS1 is transmitting while BS2 is
receiving
– depends heavily on BS locations.
– Could be avoided by providing sufficient coupling loss between
base stations
– BSs better be synchronized and of same asymmetry.
- 54.
Presentation Title —54 All rights reserved © 2004
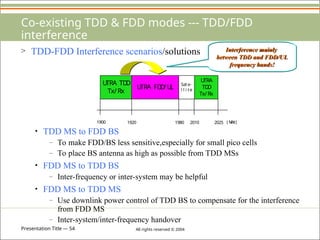
Co-existing TDD & FDD modes --- TDD/FDD
interference
> TDD-FDD Interference scenarios/solutions
• TDD MS to FDD BS
– To make FDD/BS less sensitive,especially for small pico cells
– To place BS antenna as high as possible from TDD MSs
• FDD MS to TDD BS
– Inter-frequency or inter-system may be helpful
• FDD MS to TDD MS
– Use downlink power control of TDD BS to compensate for the interference
from FDD MS
– Inter-system/inter-frequency handover
U
TRA TD
D
Tx/Rx
U
TRA FD
D
/U
L Sate-
l l i te
U
TRA
TD
D
Tx/Rx
1900 1920 1980 2010 2025 ( M
H
z)
Interference mainly
between TDD and FDD/UL
frequency bands!
- 55.
Presentation Title —55 All rights reserved © 2004
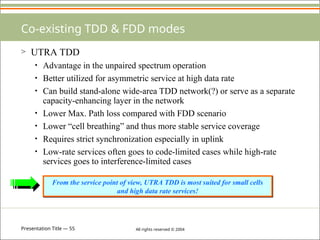
Co-existing TDD & FDD modes
> UTRA TDD
• Advantage in the unpaired spectrum operation
• Better utilized for asymmetric service at high data rate
• Can build stand-alone wide-area TDD network(?) or serve as a separate
capacity-enhancing layer in the network
• Lower Max. Path loss compared with FDD scenario
• Lower “cell breathing” and thus more stable service coverage
• Requires strict synchronization especially in uplink
• Low-rate services often goes to code-limited cases while high-rate
services goes to interference-limited cases
From the service point of view, UTRA TDD is most suited for small cells
and high data rate services!
- 56.
Editor's Notes
- #56 This slide may be used as the final slide of a presentation and can be displayed during a Question-and-Answer portion of a talk

![Presentation Title — 9 All rights reserved © 2004
WCDMA Radio Network Planning---Example of link
budget analysis
Allowed propagation loss
for cell range[dB] 141.9 v=r-s+t-u
Transmitter(mobile)
Max. Txpower[dBm] 21 a
Mobile antenna gain[dBi] 0 b
Body loss[dB] 3 c
Equivalent Isotropic
Radiated power
(EIRP)[dBm] 18 d=a+b-c
Receiver(base station)
Thermal noise density
[dBm/Hz] -174 e
Base station receiver
noise figure[dB] 5 f
Receiver noise density
[dBm/Hz] -169 g=e+f
Receiver noise power
[dBm] -103.2 h=g+10*log(3840000)
Interference margin[dB] 3 I
Receiver interference
power[dBm] -103.2 j=10*log(10^((h+i)/10)-10^(h/10))
Total effectve noise +
interference [dBm] -100.2 k=10*log(10^(h/10)+10^(j/10))
Processing gain[dB] 25 l=10*log(3840/12.2)
Required Eb/No[dB] 5 m
Receiver sensitivity[dBm] -120.2 n=m-l+k
Base station antenna
gain[dBi] 18 o
Max_path_loss=Ptx_EIRP - Prx_receiver_sensitivity
-Lrx_cable+ Grx_antenna
Cable loss in the base
station[dB] 2 p
Fast fading margin[dB] 0 q
Max.path loss[dB] 154.2 r=d-n+o-p-q
Allowed_propagation_loss=Max_path_loss
-Log_normal_fading_margin
+soft_handover_margin
-in_car_loss
Example of RLB for 12.2 kbps voice service(uplink,120km/h,in-car users,VA channel with soft handover)
Example of RLB for 12.2 kbps voice service(uplink,120km/h,in-car users,VA channel with soft handover)
Coverage probability[%] 95
Log normal fading
constant[dB] 7
Propagation model exponent 3.52
Log normal fading margin
[dB] 7.3 s
Soft handover gain[dB] 3 t
In-car loss[dB] 8 u
(*) *“modeling the impact of the fast power control on the WCDMA uplink”, sipila,K., Laiho-Steffens,J.,Jasberg,M. and Wacker.A, Proc VTC99’ Spring Huston,Texas,May 1999 pp.1266-
A headroomfor mobile station to maintain
adequate closed loop fast power control. This
applies especially to slow-moving pedestrian
mobiles.Typical values are 2.0-5.0 dB for slow-
moving mobiles(*)
handovers give a gin against slow fading by
reducing the required log-normal fading margin;it
also gives an additional macro diversity gain
against fast fading by reducing the required
Eb/No due to the effect of macro diversity
combining.
the margin required to provide a specified
coverage availability over the individual cells.
For a 95% coverage with a standard shadowing
deviation of 6.0dB and path loss model with
n=3.6 we need a shadowing margin of
approximately 6.0dB
Closely related with the loading of the cell which
subsequently affects the coverage. For coverage-
limited cases a smaller interference margin is
suggested,while in capacity-limited cases a larger
interference margin should be used. Typical value
for the interference margin in the coverage-limited
cases are 1.0-3.0 dB corresponding to 20-50%
loading.](https://image.slidesharecdn.com/wcdmaopti-250702143635-f62f431a/85/WCDMA-Optimization-for-new-people-to-learn-9-320.jpg)
![Presentation Title — 15 All rights reserved © 2004
RADIO RESOURCE UTILIZATION---congestion
control
> Air interface load definition(load control principles)
• Uplink
• Wideband power-based uplink loading
where
• Throughput-based uplink loading
• Downlink
• Wideband power-based downlink loading
• Throughput-based downlink loading
or
rxTotal
oth
own
UL
P
I
I
N
oth
own
rxTotal P
I
I
p
k
k
k
k
UL i
R
W
)
1
(
1
1
max
tx
rxTotoal
DL
P
P
max
1
R
R
N
k
k
DL
N
k
k
k
k
DL
DL
W
R
i
1
)
(
]
)
1
[(
](https://image.slidesharecdn.com/wcdmaopti-250702143635-f62f431a/85/WCDMA-Optimization-for-new-people-to-learn-15-320.jpg)
![Presentation Title — 47 All rights reserved © 2004
> Examples of maximum path losses with existing GSM and WCDMA system
WCDMA-GSM Co-Planning Issues
GSM900/
speech
GSM1800/
speech
WCDMA/
speech
WCDMA/
144kbps
WCDMA/
384kbps
Mobile transmission power[dBm] 33 30 21 21 21
Receiver sensitivity[dBm]
1
-110 -110 -124 -117 -113
Interference margin[dB]
2
1 0 2 2 2
Fast fading margin[dB]
3
2 2 2 2 2
Base station antenna gain[dBi]
4
16 18 18 18 18
Body loss[dB]
5
3 3 3
Mobile antenna gain[dBi]
6
0 0 0 2 2
Relative gain from lower
frequency compared to UMTS
frequency[dB]
7
11 1
Maximum path loss[dB] 164 154 156 154 150
1
WCDMA sensitivity assuems 4.0dB base station noise figure and Eb/No of 5dB for 12.2kbps speech,1.5dB for 144kbps and 1.0dB for 384kbps
data.GSM sensitivity is assumed to be -110dBmwith receive antenna diversity.
2
WCDMA interference margin corresponds to 37% loading of the pole capacity.An interference margin of 1.0dB is reserved for GSM900 because the
small amount of spectrumin 900MHz does not allow large reuse factors.
3
The fast fading margin for WCDMA includes the macro diversity gain against fast fading.
4
The atenna gain assumes three-sector configuration in both GSM and WCDMA.
5
The body loss accounts for the loss when the terminal is close to the user's head.
6
A 2.0dBi antenna gain is assumed for the data terminal.
7
The attenuation in 900MHz is assumed to be 11.0dB lower than in UMTS band and in GSM1800 band 1.0dB lower than in UMTS band.](https://image.slidesharecdn.com/wcdmaopti-250702143635-f62f431a/85/WCDMA-Optimization-for-new-people-to-learn-47-320.jpg)