Download to read offline

![RIEDY, LANG, A N D LANG THE JOURNAL OF PROSTHETIC DENTISTRY
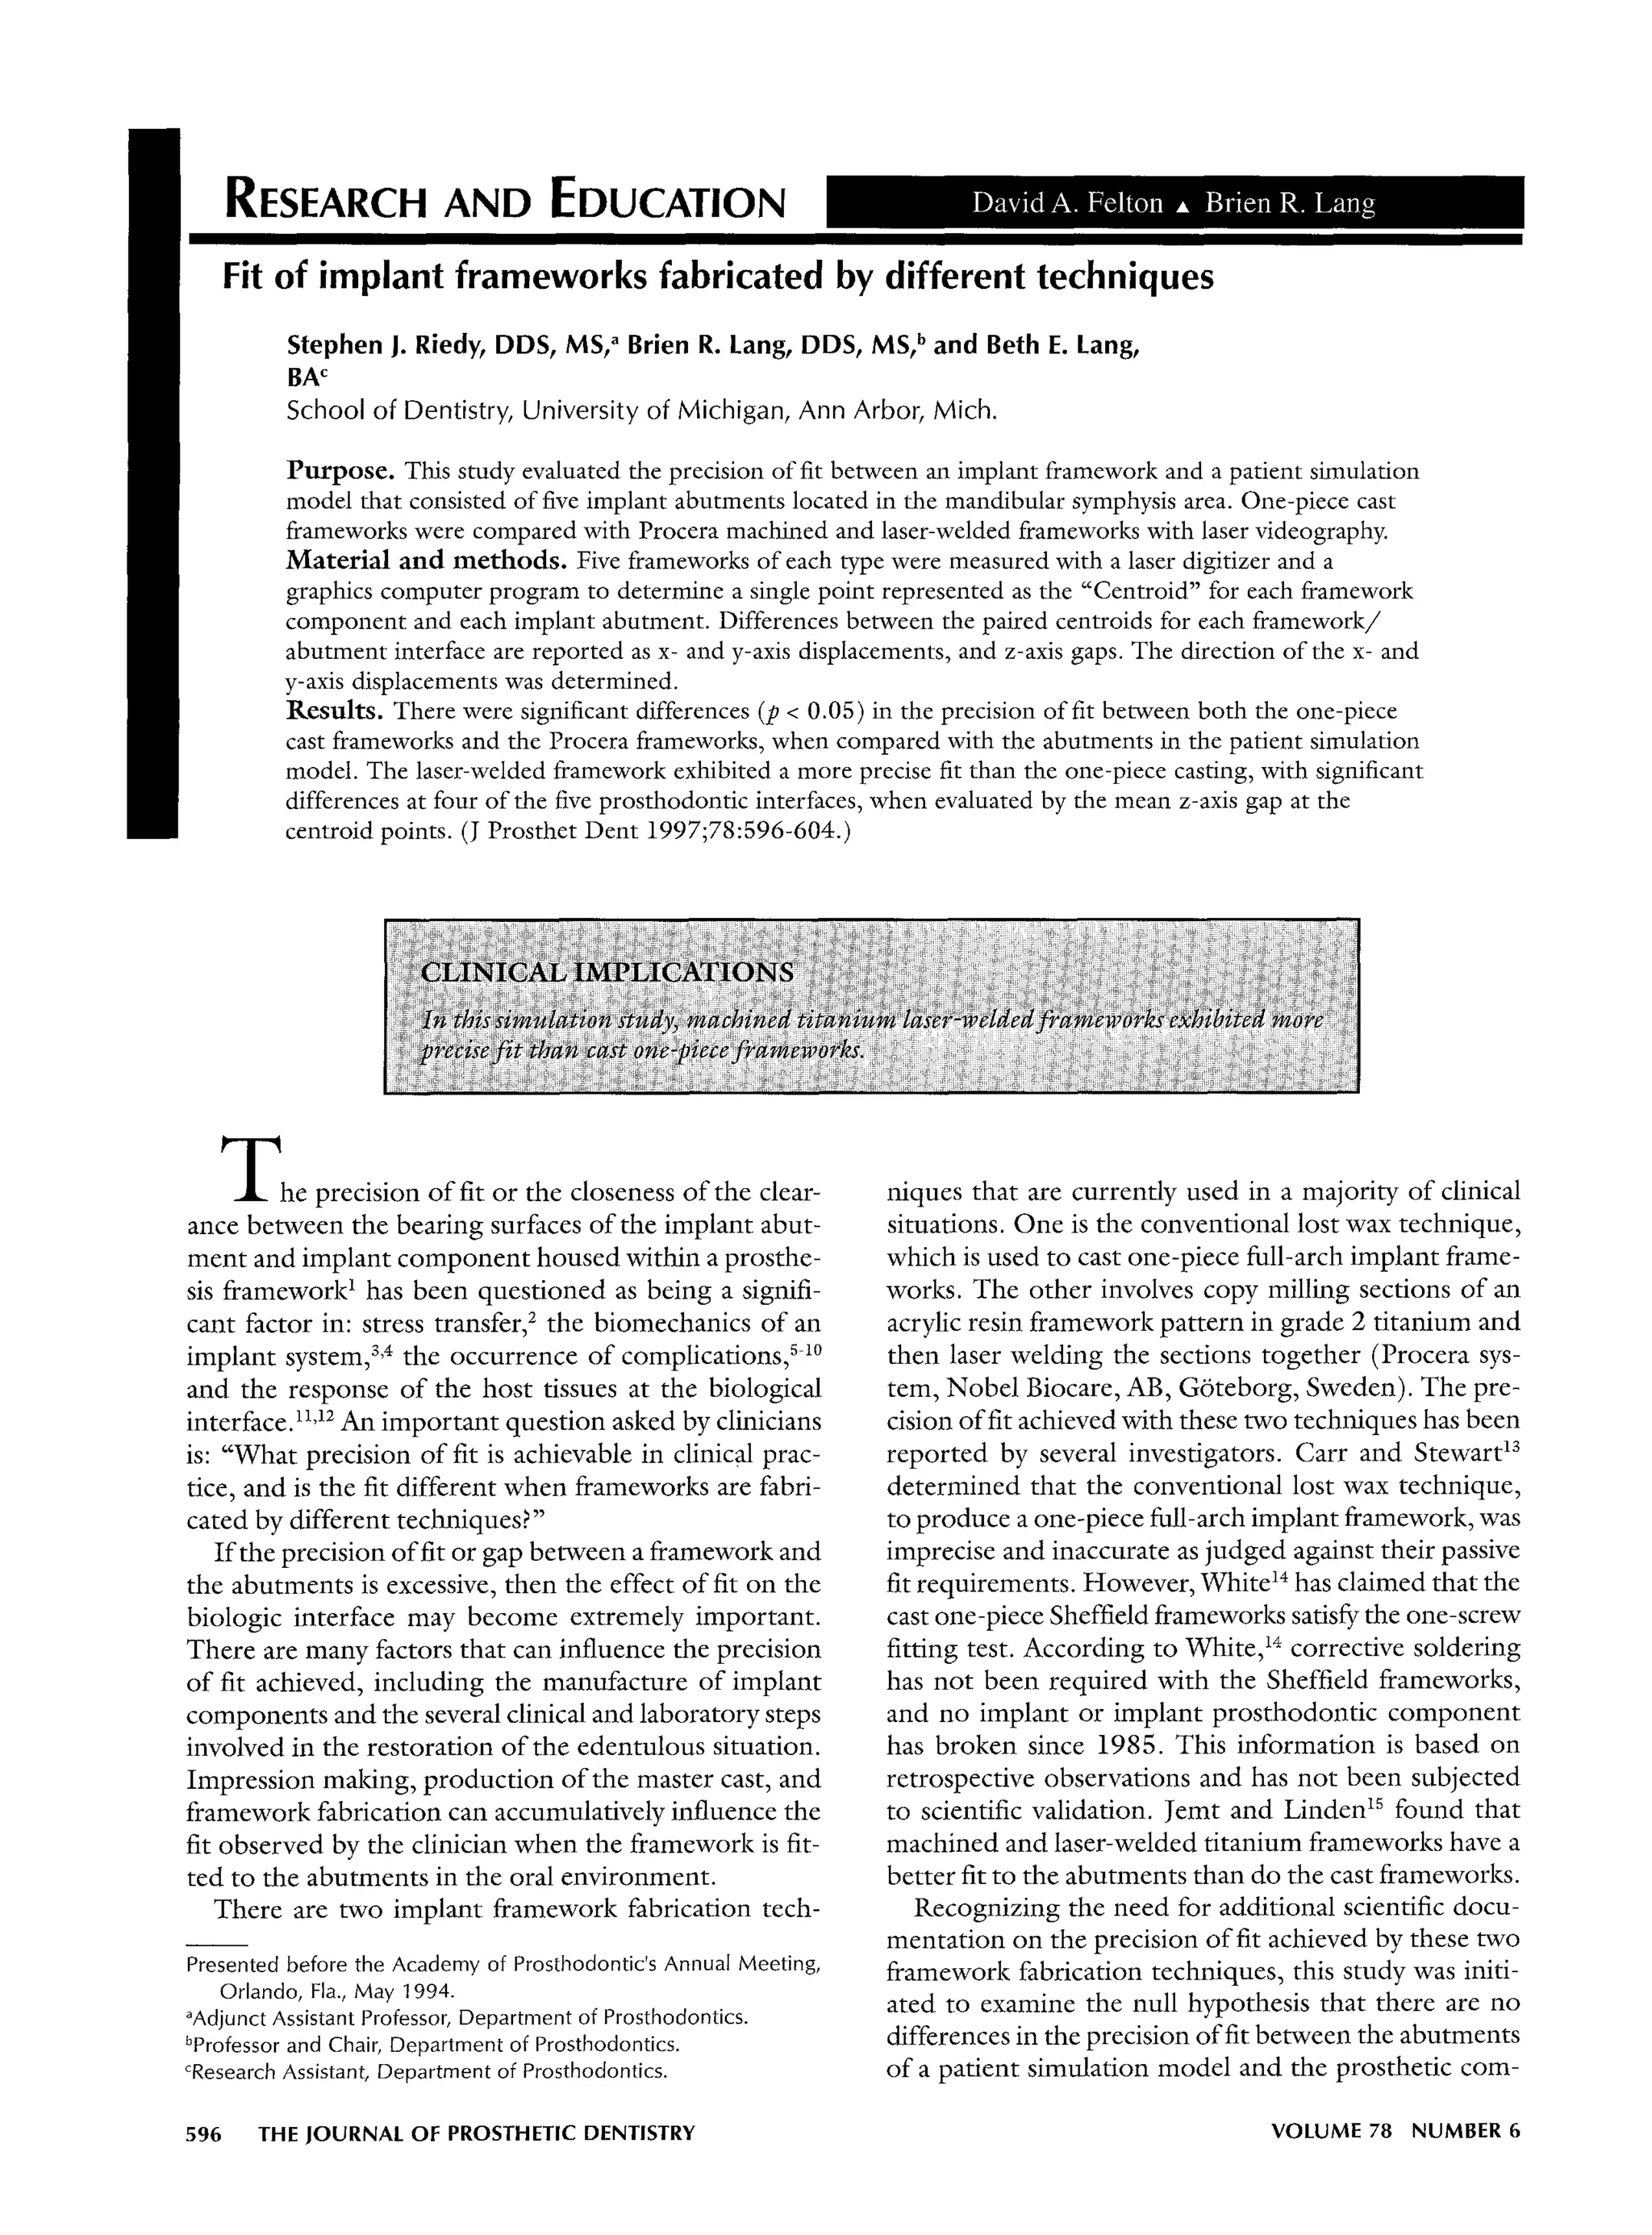
Fig. 1. Acrylic resin patient simulation model replicates eden- Fig. 2. Framework positioned on abutments of patient simula-
tulous mandibular arch containing five osseointegrated im- tion model to "best fit" relationship.
plants in symphysis region. Black reference spheres are essen-
tial for computer matching of framework to abutments. (Ar-
rows identify three reference spheres essential for computer as opposed to selecting one specific laboratory. This ap-
matching of framework to abutments). proach was chosen because it would better represent the
reality o f clinical practice. It would also reduce a situa-
tion of bias, where the frameworks produced in one com-
ponents in (a) the one-piece cast framework or (b) the mercial laboratory would not represent the variables
machined and laser-welded titanium framework. encountered with this fabrication process.
For standardization in the design o f the cast one-piece
MATERIAL AND METHODS
framework, the commercial laboratories were provided
An acrylic resin patient simulation model replicating with detailed written instructions that included: (a) the
an edentulous mandibular arch was designed for this type o f alloy, which dictated the investment, (b) waxing
project (Fig. ]). Five titanium implants (SDCA 062, technique and materials, (c) sprue design, (d) casting
Nobel Biocare, Inc., Chicago, Ill.), 3.75 x 10 mm, were technique, and (e) finishing sequence to be followed.
positioned in 1:he mandibular symphysis region, ante- Instructions to the Procera laboratory included: (a) type
rior to the mental foremen. Standard 5.5 m m titanium o f metal, (b) welding technique, and (c) the finishing
abutments (SDCA 005, Nobel Biocare, Inc.) were joined sequence to be followed. Photographs o f the exact pat-
to the implants with abutment screws and tightened to tern o f the framework design to be fabricated on the
20 Ncm. master cast were also provided to the laboratories. All
Ten standardized master casts were made o f the simu- frameworks were evaluated for compliance with these
lated mandible', model from 10 separate impressions by directions when they were returned to the investigators.
using a controlled and repeatable technique. The tray Laser videography ( M i t u t o y o / M T I Corp., Aurora,
design and the use o f an impression splint with an ap- Ill.) was the m e t h o d selected to measure the precision
propriate impression material were factors to be consid- o f fit between the abutments and the framework com-
ered in controlling the impression technique. Standard ponents. This system combines a laser digitizer with a
stainless steel abutment replicas were joined to square graphic computer program for both visual and numeri-
impression copings used in this impression procedure. cal displays o f the linear data collected. The optic source
Die stone was poured into each impression to create 10 is a Gallium Arsenide laser ( M i t u t o y o / M T I Corp.) with
master casts. a wavelength o f 780 nm capable of measuring at the
To control any influence that differences in the mas- micron level. System software allowed plotting o f the
ter cast would have on the framework fabrication pro- collected x-, y-, and z-axis data in a three-dimensional
cess, the master casts were randomly assigned to one o f mode. The system accuracy is ±0.001 ram, and repeat-
two groups. For group 1, the master casts were assigned ability tests measuring a calibration cast with five abut-
to the Procera laboratory for fabrication o f the machined ments during five measurement sessions resulted in a
and laser-welded titanium frameworks. For group 2, the standard deviation o f the mean x-axis o f 0.010 ram, the
master casts were randomly assigned to commercial den- y-axis o f 0.010 ram, and the z-axis o f 0.001 ram.
tal laboratories selected in the Midwest United States Three reference spheres essential to the computer
for fabrication o f a cast one-piece framework. Five dif- matching of the framework to the abutments were in-
ferent laboratories, with a minimum o f 8 years experi- corporated into the patient simulation model (Fig. 1).
ence in implant framework fabrication with the lost wax One sphere was placed in the area o f the tongue space,
technique, were selected to fabricate the cast frameworks while the other two were positioned on either side o f
DECEMBER 1997' 597](https://image.slidesharecdn.com/11-120821120914-phpapp01/85/11-2-320.jpg)
![THE JOURNAL OF PROSTHETIC DENTISTRY RIEDY, LANG, AND LANG
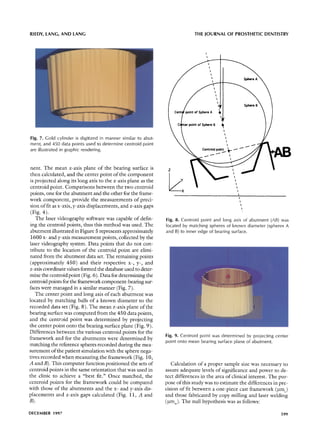
Fig. :3. Transfer impression in dental stone records "best fit" Fig. 5. Nobel Biocare standard abutment cylinder is digitized
orientation of framework to patient simulation model and with laser videography system, and 1600 x-axis and y-axis
negatives of reference spheres (arrows). measurement points are illustrated in computer graphic ren-
dering.
Z
(0,0,0)
ore|.. | o,o ~ ,
w ~,
j . ojO ,w~....I i
oe I o'~ ... o "''-- a
o ele ,,p~ ~'w~" "'''- o -"
Fig. 6. After series of computer commands to remove hex
head, remaining 450 data points are used to determine cen-
troid point of abutment cylinder.
X
the most anterior (center) a b u t m e n t location and pro-
Fig. 4. X-, y-, and z-axis coordinate values for abutment cen- gressing posteriorly, the framework-bearing surfaces were
troid point@ (xl, yl, zl) at a specific prosthodontic interface is fitted to their respective abutments. When the "best fit"
compared with centroid point 0 (x2, y2, z2) for framework at was achieved, guide pins were positioned and tightened
this location to calculate linear differences in precision of fit. until initial resistance was met. A transfer impression in
dental stone was used to record the orientation o f the
framework to the patient simulation model and to the
the midline, anterior to the mandible. The patient simu- reference spheres (Fig. 3). The stone impression with
lation model was positioned in the digitizer, and the ar- the framework and the recorded "negatives" o f the ref-
eas to be measured were identified by the linked com- erence spheres were positioned in the digitizer, and ar-
puter. A 6.0 m m 2 area that covered each a b u t m e n t was eas similar in dimensions to those used for the abut-
digitized with an x- and y-axis measurement matrix and ments and reference spheres were digitized. Each frame-
0.100 m m between each data point. The area to be digi- work c o m p o n e n t - b e a r i n g surface was digitized three
tized on each reference sphere was identified. Each bear- times.
ing surface area o f the implant a b u t m e n t was digitized The centroid m e t h o d previously reported by Lie and
three times. Jemt, ]6 and Tan et al) 7 was used to reduce the x-, y-,
To measure the framework components, the frame- and z-axis data collected from the bearing surface for
work was positioned on the abutments o f the patient b o t h the abutments and framework components to a
simulation model, using a technique r e c o m m e n d e d in single point for fit measurements. This m e t h o d initially
the clinic to achieve a "best fit" (Fig. 2). Beginning with locates the center point and long axis o f each compo-
598 VOLUME 78 NUMBER 6](https://image.slidesharecdn.com/11-120821120914-phpapp01/85/11-3-320.jpg)
![THE JOURNAL OF PROSTHETIC DENTISTRY RIEDY, LANG, AND LANG
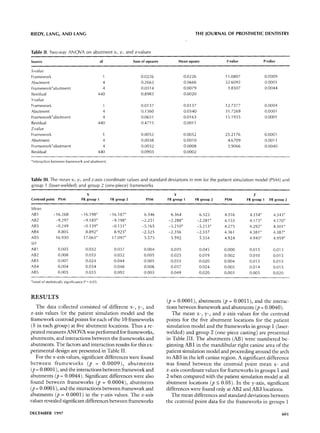
Fig. 10. A, Centroid points (arrows) were determined for all Fig. 11. A, Fit between prosthetic gold cylinder in framework
abutments (green) and bearing surface components of frame- (yellow) and abutment (green) in patient simulation model is
work (yellow). Reference spheres are also pictured. B, Com- illustrated by computer graphic rendering. B, To demonstrate
puter-matched reference spheres of patient simulation model relationship of centroid point for abutment (AB) to that of
with their negative representations recorded in stone transfer framework component, computer graphic representation has
impression. This matching procedure produced same relation- been illuminated to illustrate "best fit."
ship in computer at each prosthodontic interface that was
initially recorded when framework components (yellow) were
positioned on abutments (green) to "best fit." (50 to 10) or 0.045 m m . T h e standard deviation (6) for
an experimental p o p u l a t i o n can be estimated as one
Table I. Establishing the experimental population f o u r t h o f the range; that is sigma = r a n g e / 4 or 0 . 0 4 5 /
4 = 0.011 m m . For this study, an acceptable precision o f
a za/2 1 - fJ zf~
fit was established as o n e that w o u l d d e m o n s t r a t e a
0.100 1.645 0.800 0.840 z-axis gap between the framework and a b u t m e n t at the
0.050 1.960 0.850 1.030 centroid point o f less than 0.025 mm. The needed sample
0.025 2.240 0.900 1.282 size was calculated using the following formula:
0.010 2.576 0.950 1.645
N = 2(Zc~/2 + z[3) 2 x (~2/62
T h e values for cq Zc~/2, 1 - ]5, and Z[3 are listed in
H o : Bm c = ~ m w T a b l e I. F o r this s t u d y , n = 2 ( 1 . 9 6 + 1 . 2 8 ) 2 "
while the alternative hypothesis was as follows: ( 0 . 0 1 1 ) 2 / ( 0 . 0 2 5 ) 2 , or n = 4.25, and therefore a sample
size o f 5 was n e e d e d for each framework group. 18 F o r
Ha: p m c ~ ~ m w. this study, p o w e r = 1 - [3, and 13 = 0.1; therefore, p o w e r
A n 0t "alpha" o f 0.05 and ~ " b e t a " o f 0.10 were used = 1 - 0.1 = 0.9, m e a n i n g that a difference in the preci-
as levels o f statistical significance. I t was estimated that sion o f fit o f the one-piece cast frameworks versus the
the range in precision o f fit for the one-piece castings m a c h i n c d and laser-welded framcworks will be detected
w o u l d be 0 . 0 2 0 to 0 . 0 5 0 m m at the z-axis centroid 90% o f the time with a sample size o f n = 5.
points, and for the m a c h i n e d and laser-welded frame- T h e statistical test selected for the analysis o f the data
w o r k w o u l d be 0.010 to 0.025 ram. Therefore the maxi- was a t w o - w a y analysis o f variance (ANOVA). T h e level
m u m range differences w o u l d be - 5 (20 to 25) to 40 o f significance to reject the null-hypothesis w a s p _<0.05.
600 VOLUME 78 NUMBER 6](https://image.slidesharecdn.com/11-120821120914-phpapp01/85/11-5-320.jpg)
![RIEDY, LANG, AND LANG THE JOURNAL OF PROSTHETIC DENTISTRY
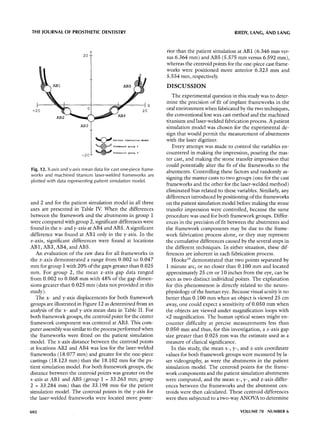
Fig. 13. A, Prosthodontic interface (arrow) between AB5 Fig. 14. A, Prosthodontic interface (arrow) between AB5 (abut-
(abutment) and framework component for cast one-piece ment) and framework component for machined titanium la-
framework. B, C o m p u t e r graphic representation of ser-welded framework. B, Reference spheres can be seen in
prosthodontic interface illustrated in A; reference spheres computer graphic representation of prosthodontic interface
can be seen. of A.
whether significant differences existed between the two the flat bearing surface. Either of these reasons can result
techniques for fabricating an implant framework. in a gap at the centroid point and other locations at the
Comparisons o f the mean coordinate values for the interface (Figs. 13, A and B, and 14, A and B).
x-, y-, and z-axes for both framework groups to the pa- Calculation o f the mean x-, y-, and z-axis differences
tient simulation model exhibited significant differences between the framework groups and the patient simula-
(p < 0.05) (Table III). Obviously, something affected tion abutments revealed significant differences in the
the precision o f fit o f the frameworks to the patient simu- z-axis for framework to abutment interfaces at AB 1, AB 3,
lation model. The differences observed demonstrated AB4, and AB5 (Table IV). For the laser-welded frame-
an influence by the techniques themselves. works (group 1), the mean z-axis gaps were 0.018 m m
In every instance, a significant difference was found and 0.021 mm for AB 1 and AB5, respectively. The mean
in the mean z-axis data for both framework groups, when z-axis gaps for the one-piece frameworks at AB1 was
compared with the mean z-axis measurements for the 0.027 mm and, at AB5, the gap was 0.035 mm. A sig-
patient simulation model (Table III). These differences nificant difference was also found at AB3 or the center
are more precisely determined because o f the 0.001 m m a b u t m e n t l o c a t i o n w i t h the m e a n z-axis gap o f
resolution used[ to make the measurements and are in- 0.018 mm for laser-welded frameworks (group 1), and
fluenced by the: framework fabrication techniques. the one-piece castings (group 2) being 0.026 mm. For
The presence: o f a z-axis gap does not mean that there abutment position AB4, the mean z-axis gap o f 0.019
is no contact at this interface. Contact may be occurring m m was measured for the laser-welded frameworks
somewhere else around the circumference o f the bearing (group 1), whereas the gap for the one-piece castings
surface. Contact may be occurring on the facial, lingual, (group 2) was determined to be 0.026 mm.
mesial, or dista][ areas o f the bearing surface, or contact The mean z-axis gaps were greater for the one-piece
may be occurring between the framework component and castings. The magnitude o f the z-axis gap at the cen-
the inner vertical inclines o f the abutment, leading up to troid points for the laser-welded frameworks ranged from
DECEMBER 1997 603](https://image.slidesharecdn.com/11-120821120914-phpapp01/85/11-8-320.jpg)
![THE JOURNAL OF PROSTHETIC DENTISTRY RIEDY, LANG, AND LANG
Table IV. The mean x-, y-, and z-axis differences and standard deviations in mm of the framework - a b u t m e n t PSM
x y z
Centroid point Group 1 Group 2 Group 1 Group 2 Group 1 Group 2
Mean
AB1 0.069 0.081 0.018* -0.023 0.018* 0.027
AB2 0.112 0.099 -0.036 -0.029 0.020 0.01 7
AB3 0.110 0.118 -0.045 -0.048 0.01 8* 0.026
AB4 0.087* 0.120 -0.032* -0.012 0.01 9* 0.026
AB5 0.135* 0.166 0.01 7* -0.020 0.021 * 0.035
SD
AB1 0.033 0.037 0.036 0.045 0.015 0.013
AB2 0.034 0.033 0.025 0.020 0.010 0.016
AB3 0.025 0.044 0.033 0.021 0.013 0.015
AB4 0.034 0.048 0.038 0.025 0.015 0.016
AB5 0.035 0.092 0.049 0.020 0.006 0.020
*Level of statistically significance P = 0.05.
0.018 m m at AB3 (center) and AB1 (fight posterior) to system -- clinical studies. Aust Prosthodont J 1993;7(Supp):45-9.
0.021 m m at AB5 (left posterior). The small mean vari- 5. Gregory M, Murphy WM, Scott J, Watson CJ, Reeve PK. A clinical study of
the Br&nemark dental implant system. Br Dent J 1990;168:18-23.
ance (0.003 ram) among the five abutment locations 6. Zarb GA, Schmitt A. The longitudinal effectiveness of osseointegrated
for the laser-welded frameworks seemed to indicate dental implants: the Toronto study. Part IIh problems and complications
consistency and a more precise fit with this technique. encountered. J Prosthet Dent 1990;64:185-94.
7. Johansson G, Palmqvist S. Complications, supplementary treatment, and
The z-axis gap for the one-piece castings ranged from maintenance in edentulous arches with implant-supported fixed prosthe-
0.017 m m at AB2 (fight anterior) to 0.035 mm at AB5 sis. Int J Prosthodont 1990;3:89-92.
(left posterior) or a variance o f 0.018 ram. 8. Jewt T, Linden B, Lekholm U. Failures and complications in 127 consecu-
tively placed fixed partial prostheses supported by Br&nemark implants:
from prosthetic treatment to first annual checkup, lnt J Oral Maxillofac
CONCLUSIONS Implants 1992;7:40-4.
9. Patterson EA, Johns RB. Theoretical analysis of the fatigue life of fixture
Within the limitations o f this study, the following con-
screws in osseointegrated dental implants. Int J Oral Maxi[Iofac Implants
clusions were drawn. 1992;7:26-34.
1. There were significant differences in the precision 10. Carlson B, Carlsson GE. Prosthodontic complications in osseointegrated
dental implant treatment. Int J Oral Maxillofac Implants 1994;9:90-4.
o f fit between both the machined titanium laser-welded
11. Hoshaw S, Brunski J, Cochran G. Mechanical loading of Br&nemark fix-
frameworks and the cast one-piece frameworks, when tures affects interfacial bone modeling and remodeling. [nt J Oral Maxillofac
compared with the abutments in the patient simulation Implants 1994;9:345-60.
12. Albrektsson T. On long-term maintenance of the osseointegrated response.
model.
Aust Prosthodont J 1993;7(Supp):l 5-24.
2. The machined titanium laser-welded frameworks 13. Carr AB, Stewart RB. Full-arch implant framework casting accuracy. Pre-
exhibited a more precise fit than the cast one-piece frame- liminary in vitro observation for in vivo testing. J Prosthodont 1993;2:2-8.
14. White GE. Osseointegrated dental technology. Chicago: Quintessence
works, with significant differences at four o f the five
Publishing; 1993. p. 78-90.
prosthodontic interfaces, when evaluated by the mean 15. Jemt T, Linden B. Fixed implant-supported prostheses with welded tita-
z-axis gap at the centroid points. nium frameworks. [ntJ Periodont Rest Dent 1992;12:177-83.
16. Lie A, Jemt T. Photogrammetric measurements of implant positions. De-
3. The machined titanium laser-welded frameworks scription of a technique to determine the fit between implants and super-
exhibited less than a 25 ]am gap in the mean z-axis mea- structures. J Oral Impl Res 1994;5:1-7.
surement at all five o f the framework to abutment inter- 17. Tan KB, Rubenstein JE, Nicholls JE, Yuodelis RA. Three-dimensional analy-
sis of the casting accuracy of one-piece, osseointegrated implant-retained
faces. prostheses. Int J Prosthodont 1993;6:346-63.
We acknowledge the contributions by Mr. Rui-Feng Wang, Re- 18. Fleiss JL, Kingman A. Statistical management of data in clinical research.
search Associate, Department of Prosthodontics, School of Dentistry, Crit Rev Oral Blot Med 1990;1:55-66.
19. Overheim RD, Wagner DL. Light and color. New York:John Wiley; 1982.
University of Michigan, in conducting the statistical analysis of the
p. 163-70.
data.
Reprint requests to:
REFERENCES DR. STEPHEN RIEDY
J.
1. American National Standards Institute. Industrial engineering terminology. 44790 CHARNWOdDDR.
Revised edition, Norcross (GA): ANSI Z94.0; 1989. p. 07-02, 07-20, 07- PLYMOUTH,M[ 48170
58, 08-02, 08-19, 17-02.
2. Rangert B, Jemt T, Jorneus L. Forces and moments on Br&nemark implants. Copyright © 1997 by The Editorial Council of The Journal of Prosthetic Den-
Int J Oral Maxillofac Implants 1989;4:241-7. tistry.
3. RangertB. Mechanical and biomechanical guidelines for the use of Br&nemark 0022-3913/97/$5.00 + O. 10/1/84266
system -- general studies. Aust Prosthodont J 1993;7(Supp):39-44.
4. RangertB. Mechanical and biomechanical guidelines for the use of Br~nemark
604 V O L U M E 78 NUMBER 6](https://image.slidesharecdn.com/11-120821120914-phpapp01/85/11-9-320.jpg)

The study evaluated the precision of fit between implant frameworks fabricated using different techniques and implant abutments in a patient simulation model. Three techniques were compared: 1) one-piece cast frameworks, 2) Procera machined and laser-welded frameworks, and 3) laser-welded frameworks. Laser videography was used to measure the gap between bearing surfaces of each framework component and corresponding abutment. The results showed significant differences in precision of fit between techniques, with laser-welded frameworks exhibiting the best fit compared to one-piece cast frameworks.


