1. Estimating the Relationship Between the Student-Teacher
Ratio and Test Scores
Mia Attruia
The Florida Legislature enacted
legislation requiring the number of
students in each classroom to be reduced
by at least two students per year
beginning in the 2003-04 school year.
This happened until the maximum
number of students per classroom did
not exceed the requirements by law. The
law was enacted in order to assert that
students perform better in smaller
classrooms. In 2015, opponents are
arguing for repeal of the law due to the
fact that smaller classroom sizes are too
expensive and have not led to higher
student performance. In this report we
will test the relationship between test
scores and classroom size using a simple
bivariate regression model.
1. Data
The Data used comes from the
California Standardized Testing and
Reporting (STAR) dataset which reports
test results for the Stanford 9
standardized test administered to 5th
grade students in 420 California school
districts during 1998 and 1999. We
randomly select a sub-sample of size 210
of the 420 observations in the dataset for
the variables:
Testscr: the average of the math and
reading scores for students within the
district;
Str: the student-teacher ratio measured
as the number of full-time equivalent
teachers in the district, divided by the
number of students.
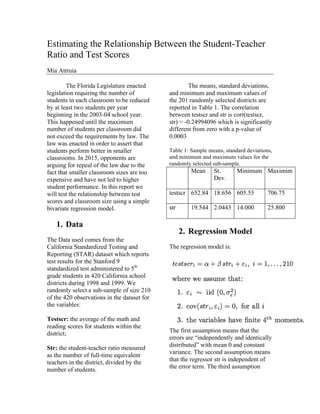
The means, standard deviations,
and minimum and maximum values of
the 201 randomly selected districts are
reported in Table 1. The correlation
between testscr and str is corr(testscr,
str) = -0.24994096 which is significantly
different from zero with a p-value of
0.0003
Table 1: Sample means, standard deviations,
and minimum and maximum values for the
randomly selected sub-sample.
Mean St.
Dev.
Minimum Maximim
testscr 652.84 18.656 605.55 706.75
str 19.544 2.0443 14.000 25.800
2. Regression Model
The regression model is:
The first assumption means that the
errors are “independently and identically
distributed” with mean 0 and constant
variance. The second assumption means
that the regressor str is independent of
the error term. The third assumption
2. means that the data are “well-behaved”
in the sense that outliers are rare.
3. Results
The estimation results for our random
subsample are:
= 697.414 - 2.28095str
(12.0393) (0.709333)
T= 210 R2
= 0.062470 F(1,208)=13.85968
=18.10727
The results show a negative
relationship between test scores and the
student-teacher ratio. If the average class
size in a school district increases by one
student we would predict that average
test scores in the district would fall by
100*(-2.28095/652.84)= -0.349% of the
average test score.
The scatter plot of the data
including the estimated regression line
shown in Figure 1 shows the negative
relationship between the student-teacher
ratio and the average test score. The
arrow in the figure points to the sample
means
=(19.544, 652.84)
To confirm that the regression line does
indeed go through the sample means of
the data as requires by the least squares
method.
Figure 1: Scatter plot of the data along with the
fitted regression line (blue). The arrow points to
the sample means of the data.
For a simple bivariate model, we
can confirm the estimation results by:
=-0.24994096(18.656/ 2.0443)=
−2.28092675
and,
= 652.84 – (-2.28095)*
19.544=697.4188868
Sstr,testscr Is the sample covariance, rstr,testscr
is the sample correlation and S2
str is the
sample variance, etc.
4. Summary
We used a random sub-sample of size
210 from the original 420 observations
of that California STAR dataset to
estimate a bivariate regression model of
test scores as a linear function of the
student teacher ratio. We find that
increased class sized reduces test scores
by about 2.28092675 points per extra
student. This result is statistically
significant but, since it only amounts to
.6% of the average test score, it may
not be very significant from a political
perspective.
There are other factors other
than class size that effect test
performance and all of these other
factors have been omitted from out
model. Consequently, these omitted
variables are effectively being captured
by the error term, If and of these
omitted factors are correlated with
class size then that would violate
assumption (2) of our model. We need
to use caution when recommending
policy changes based upon such a
simple model.