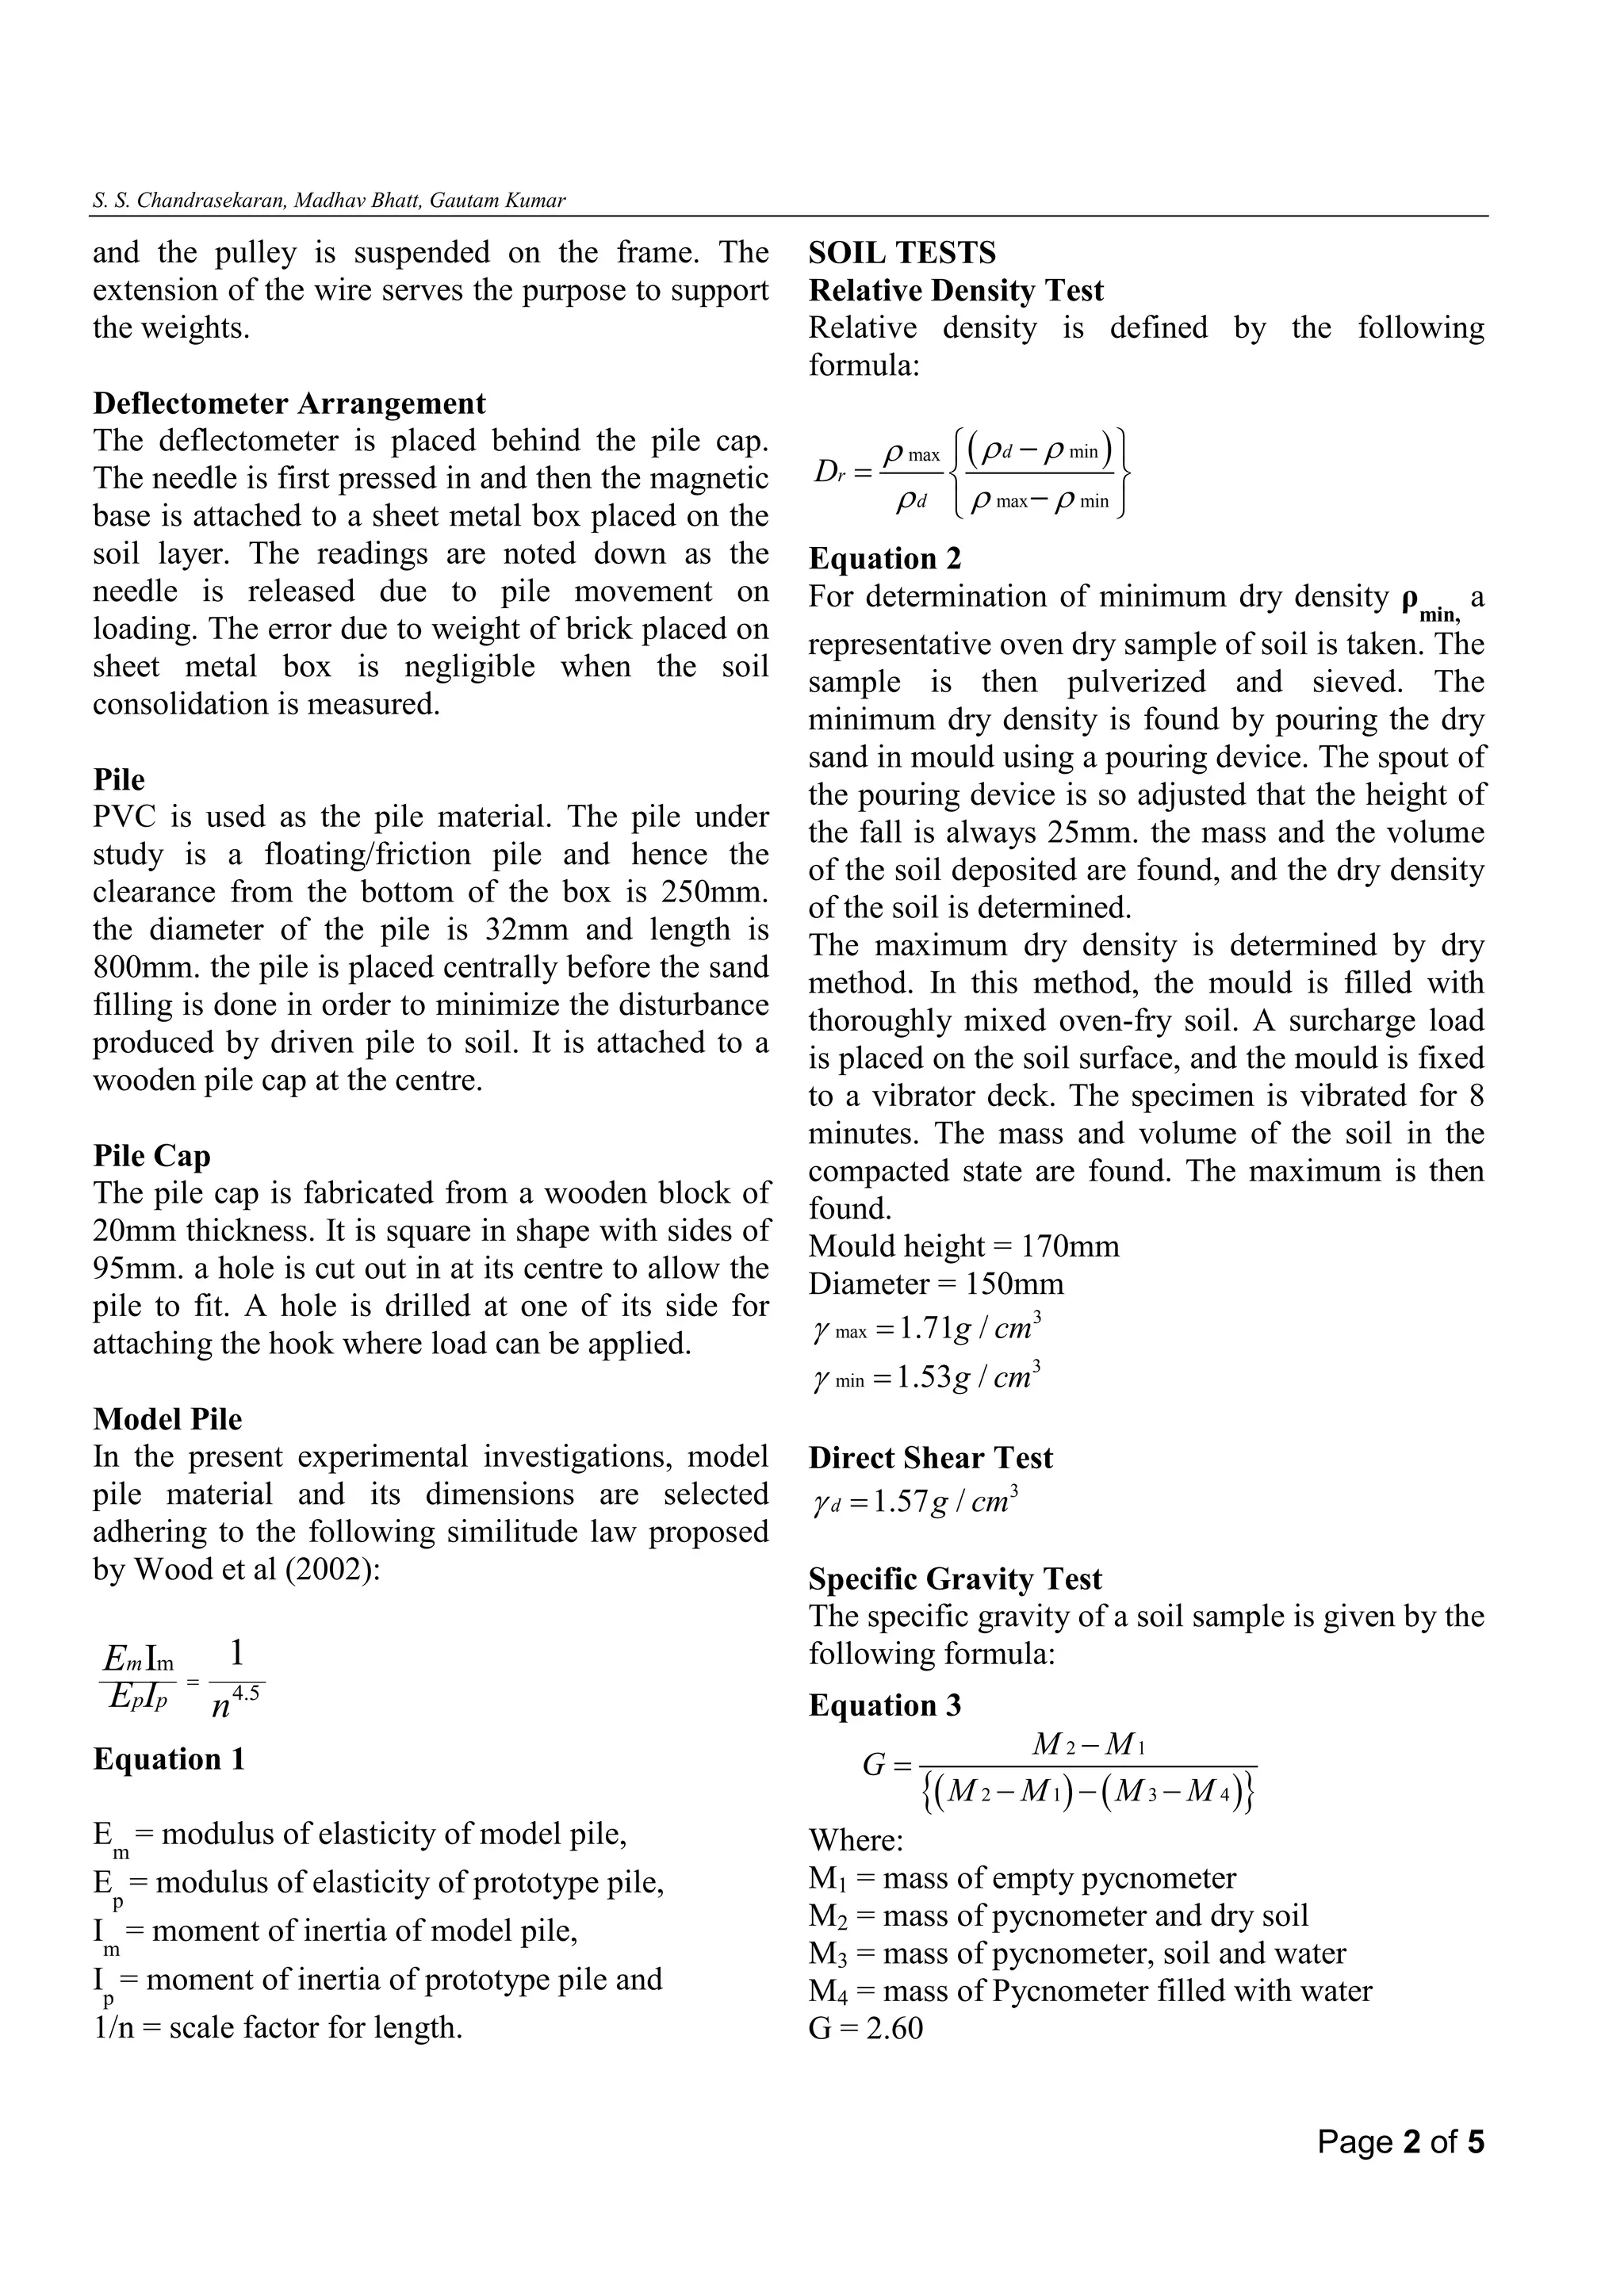
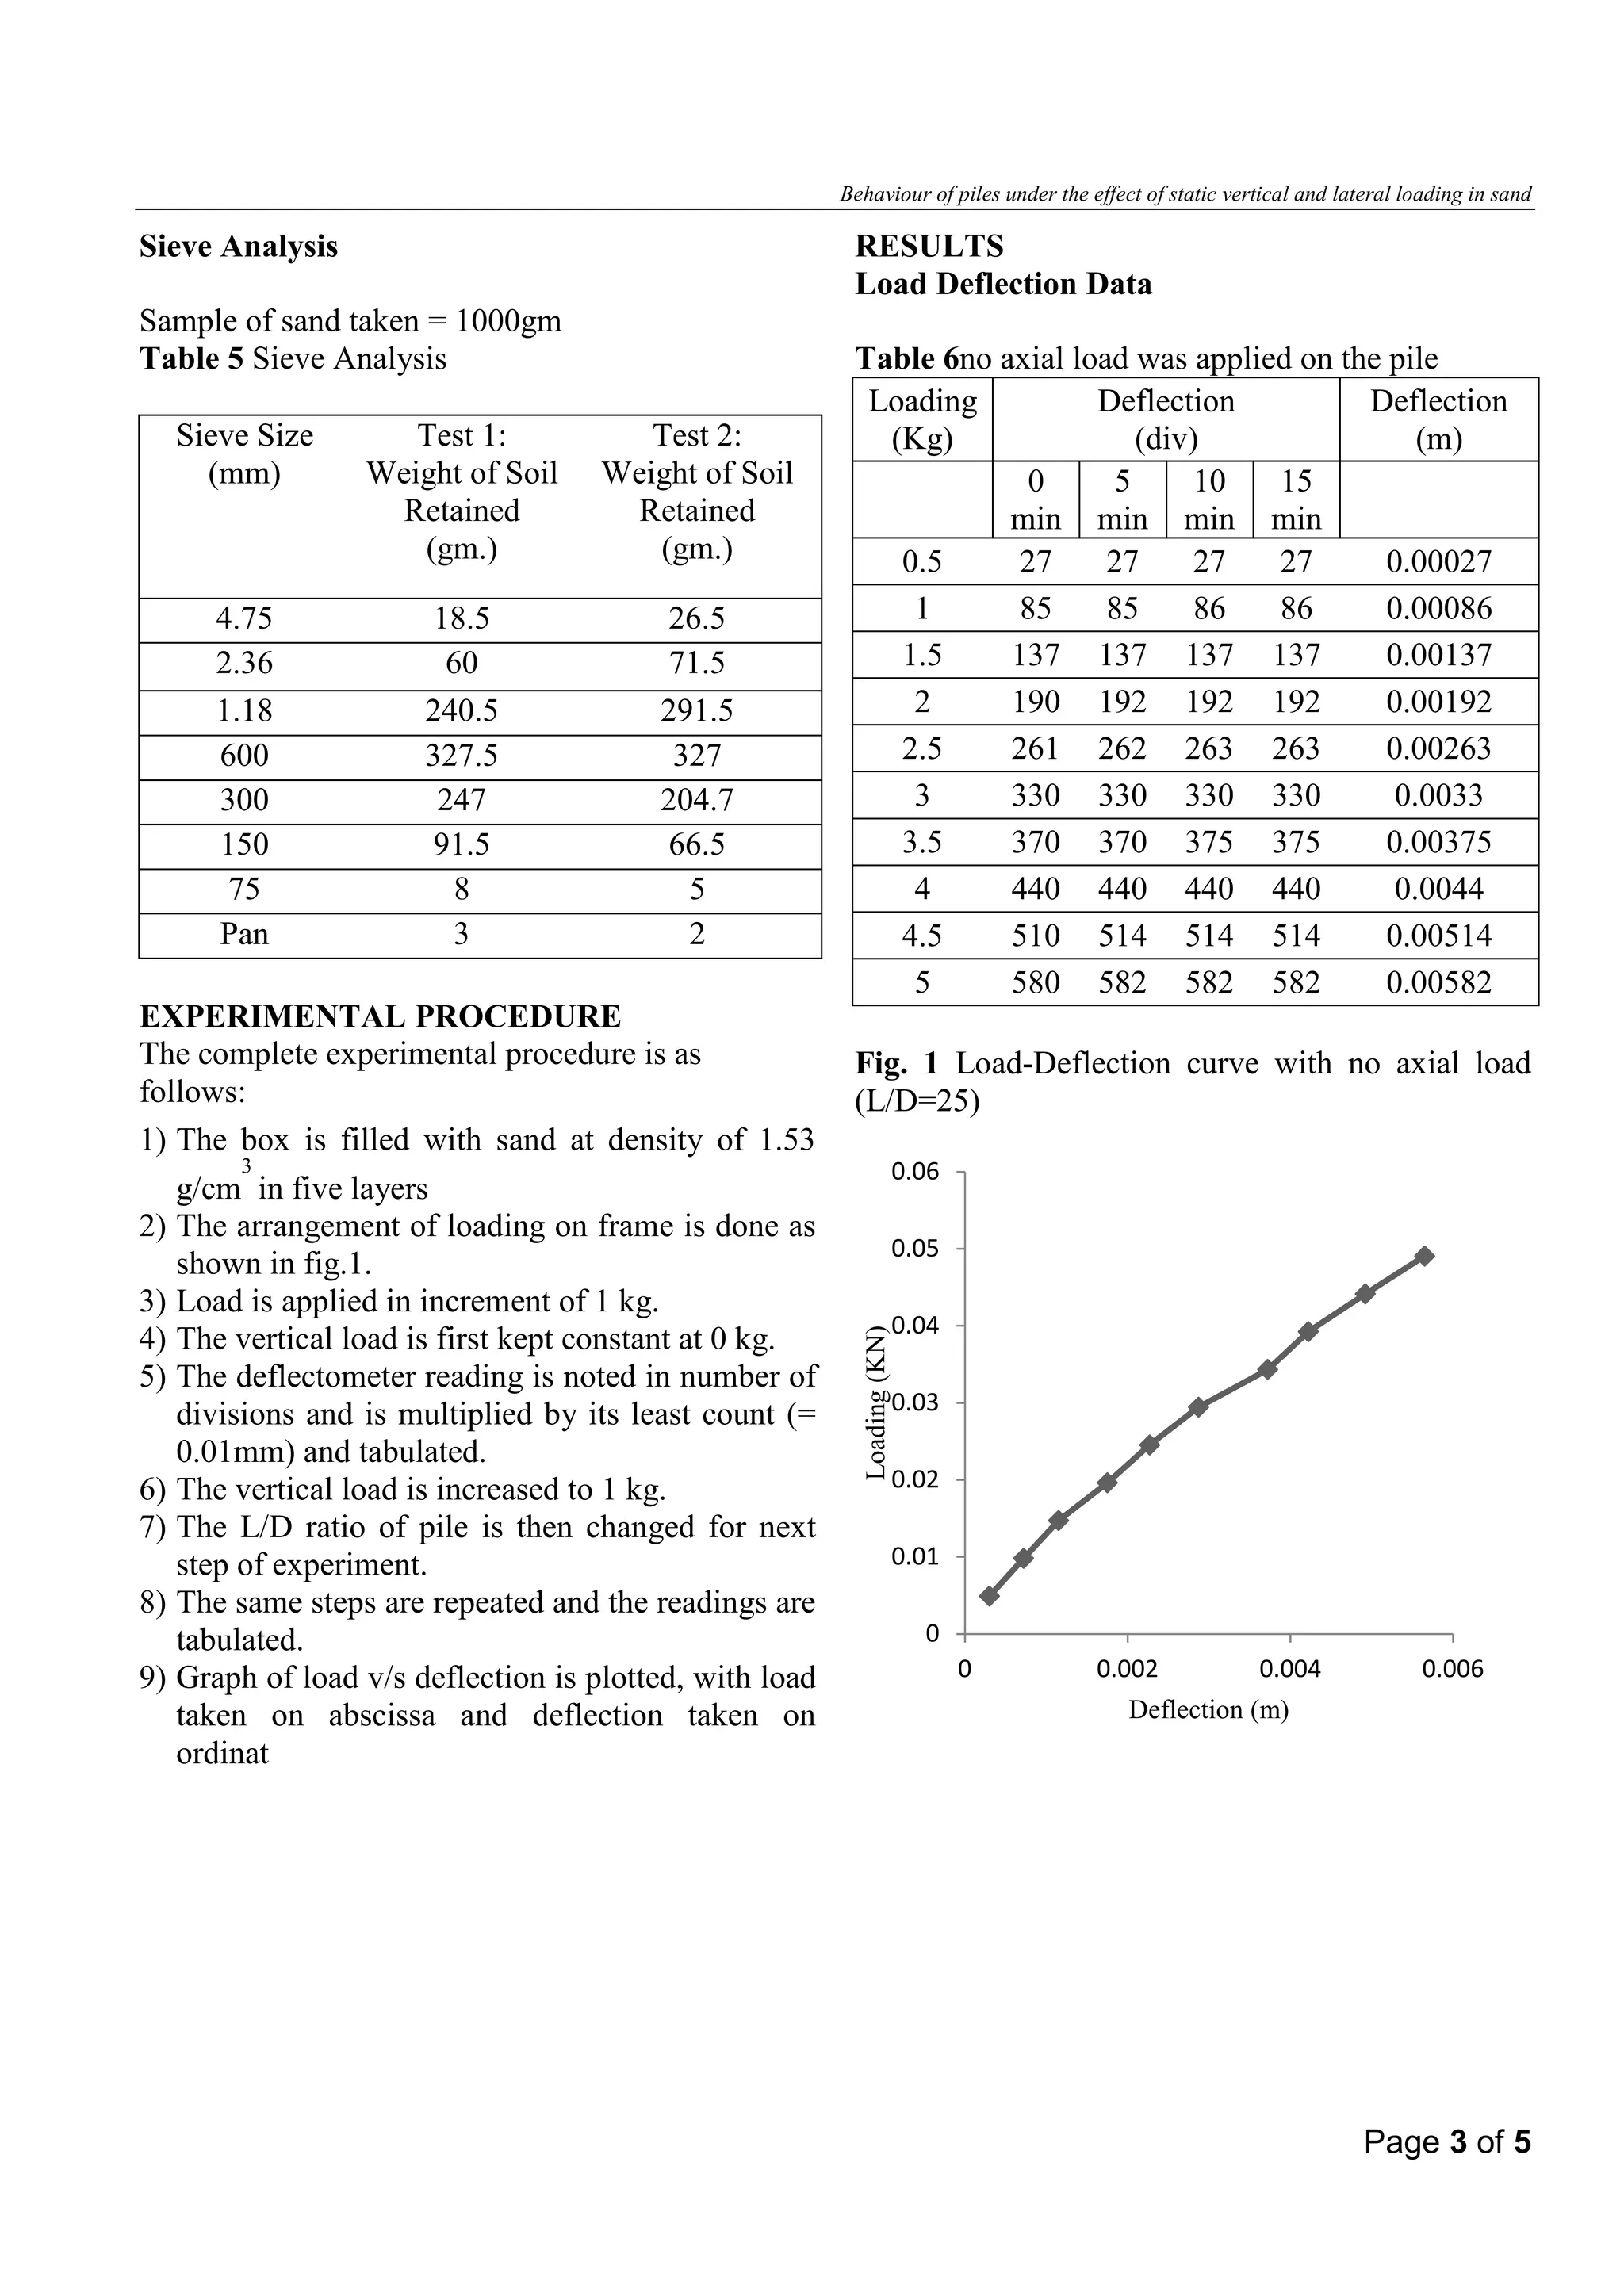
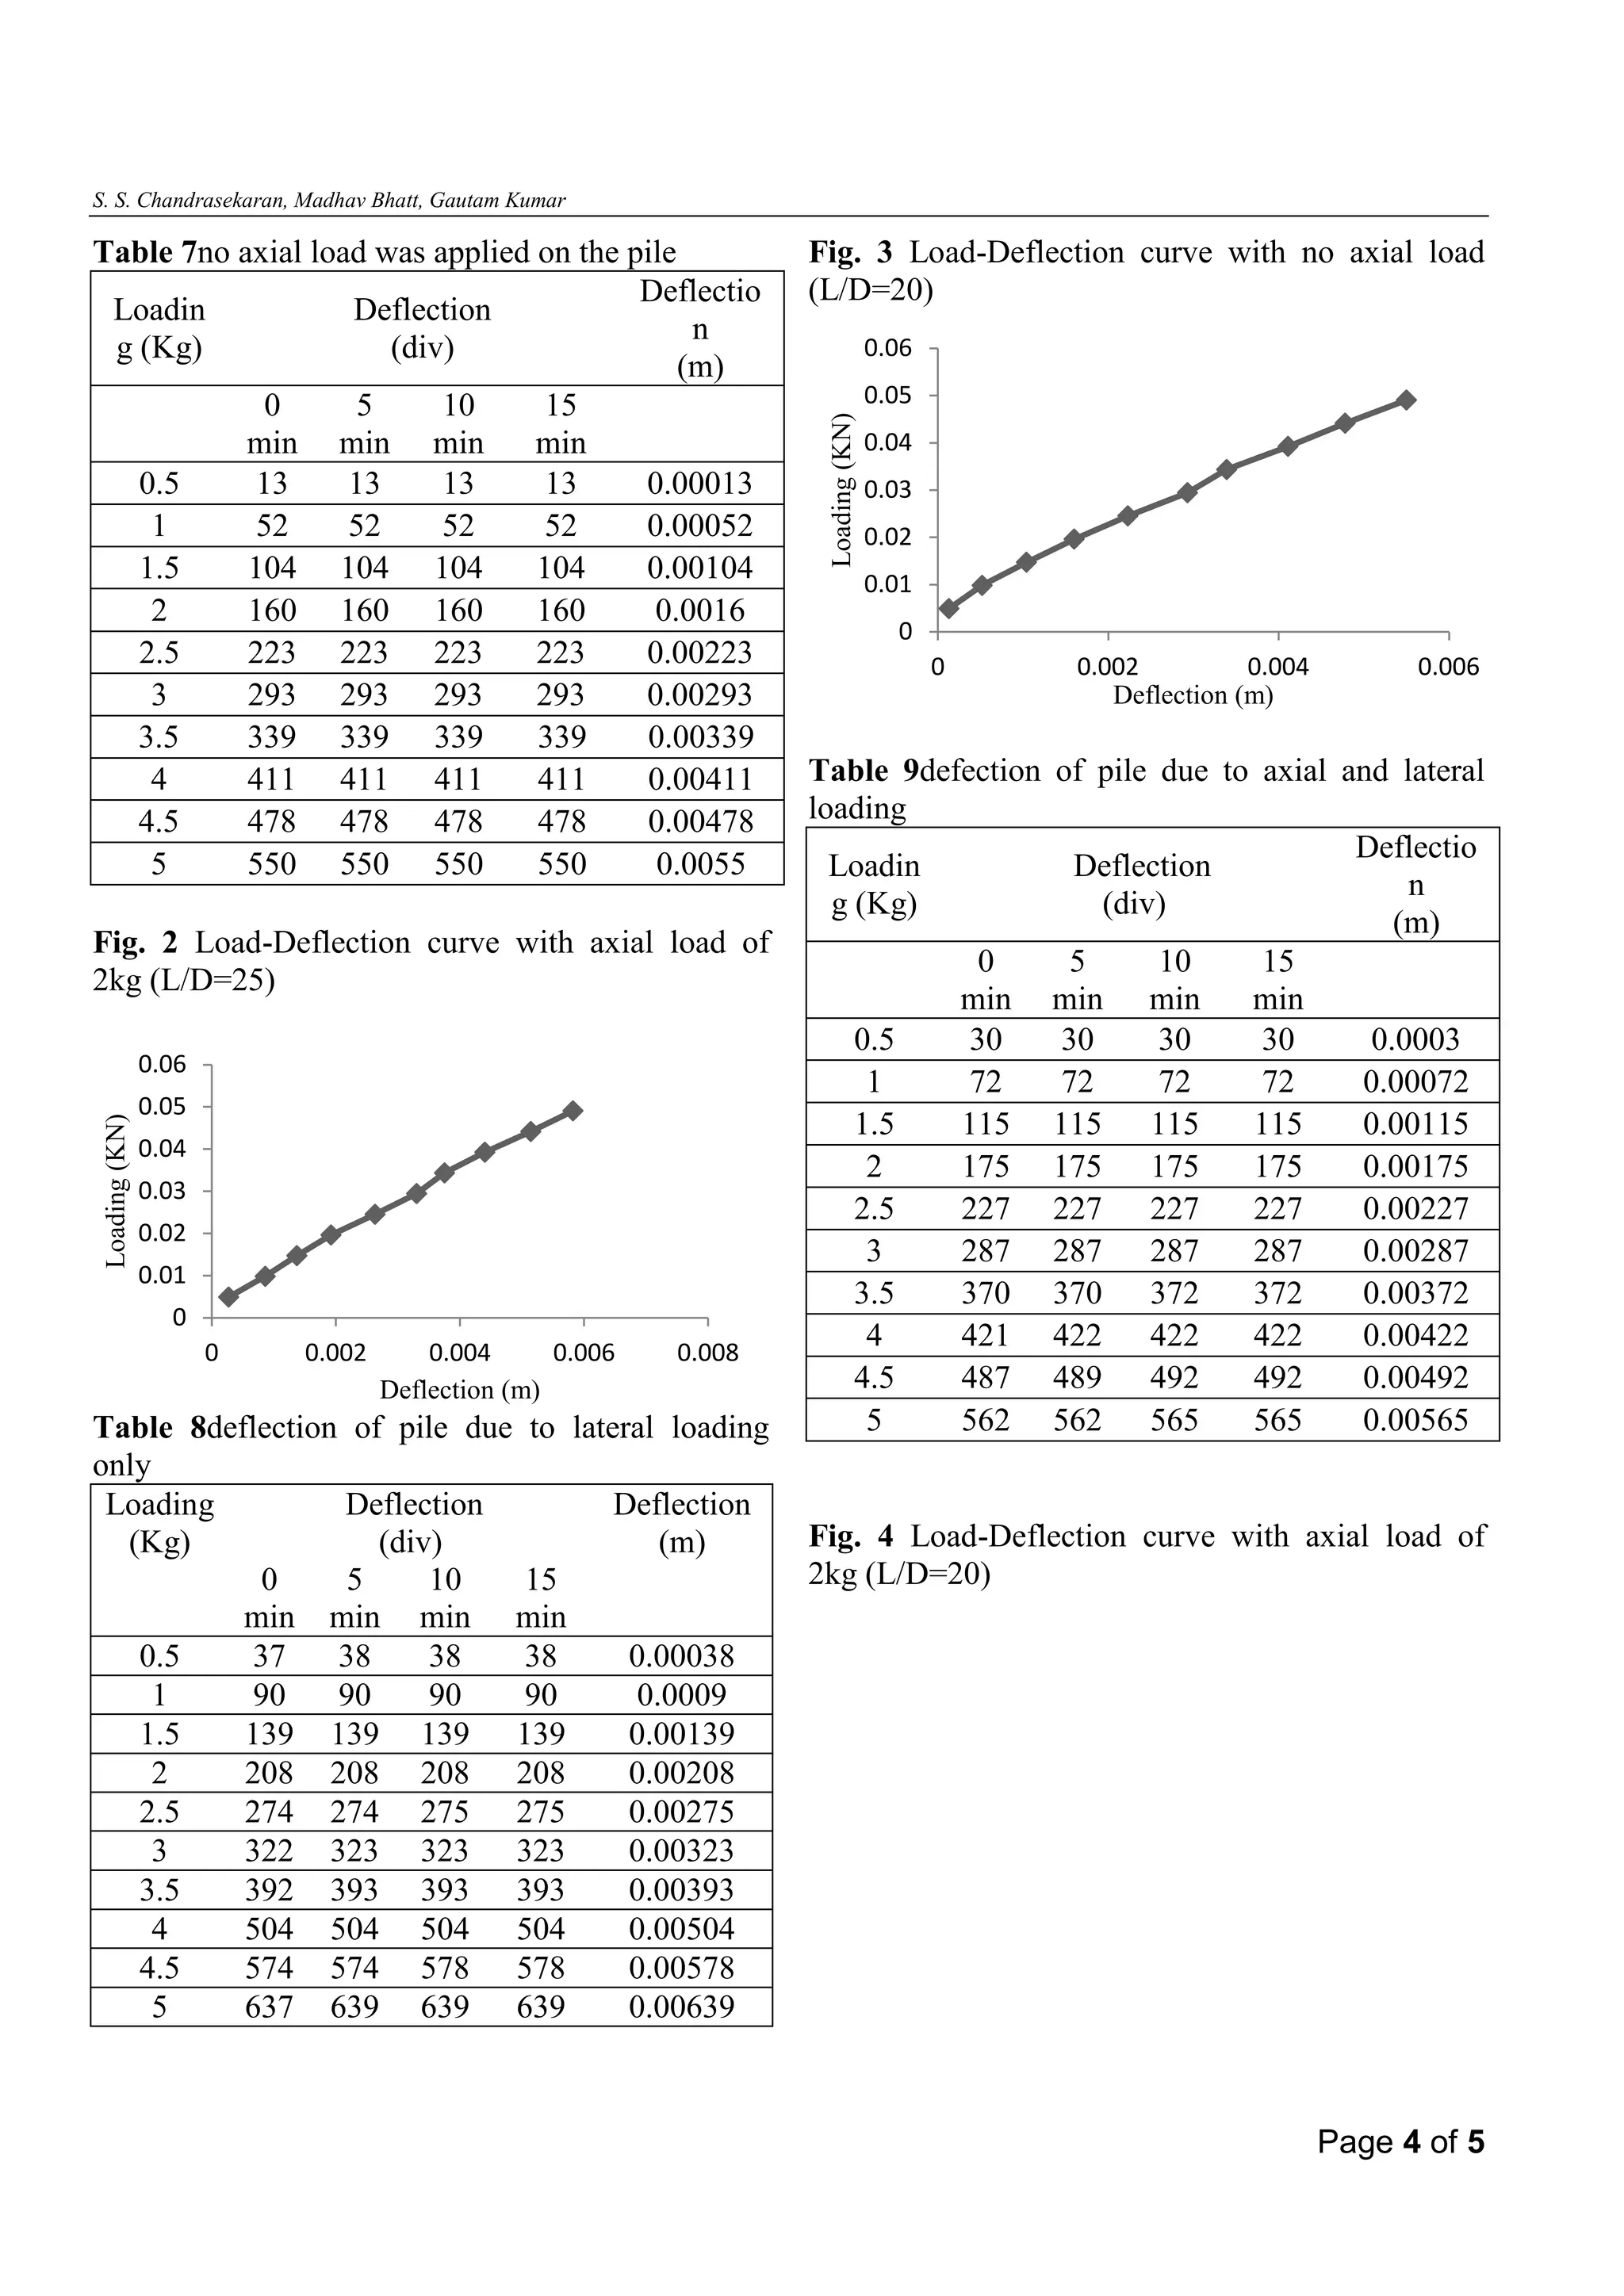
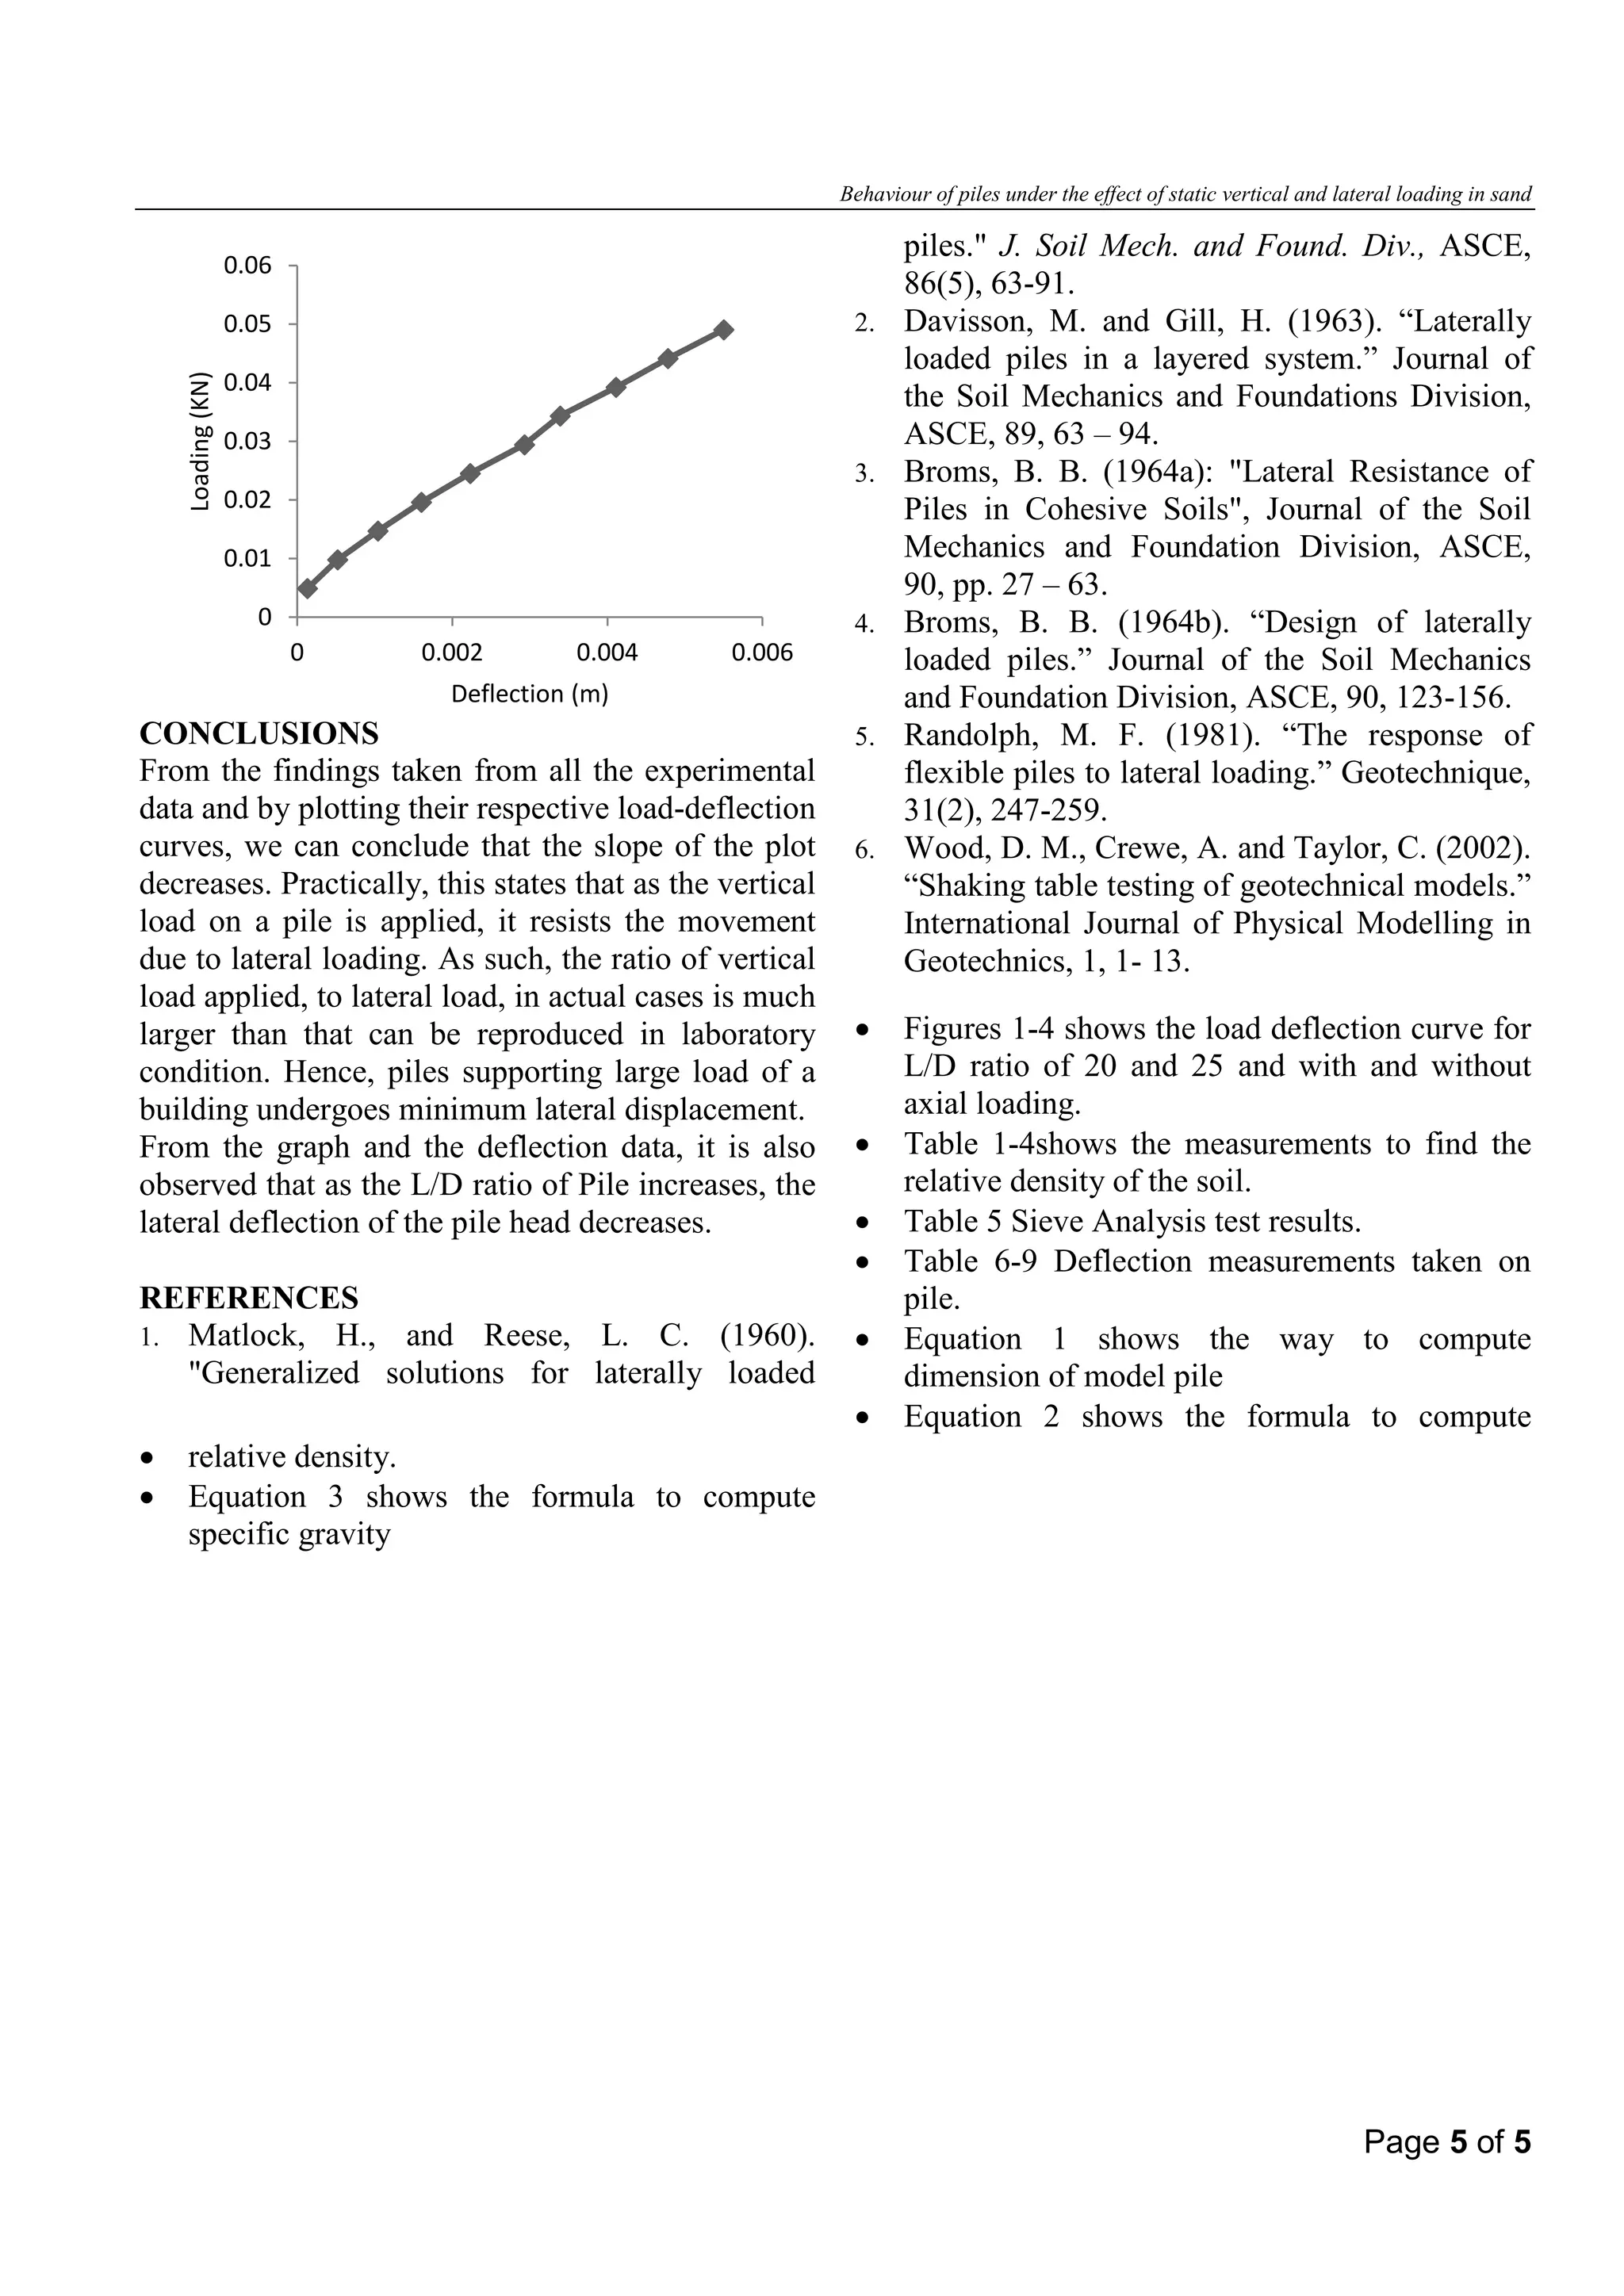
Proceedings of Indian Geotechnical Conference 
December 22-24,2013, Roorkee 
BEHAVIOUR OF PILES UNDER THE EFFECT OF STATIC VERTICAL AND LATERAL LOADING IN SAND 
S. S. Chandrasekaran, Associate Professor, SMBS, VIT University. chandrasekaran.ss@vit.ac.in 
M. Bhatt, Student, School of Mechanical and Building Sciences, VIT University. madhav.bhatt31@gmail.com 
G. Kumar,Student, School of Mechanical and Building Sciences, VIT University. gaumji22@gmail.com 
ABSTRACT: This project reports on the behaviour of single pile due to both vertical and horizontal load applied directly. The cohesionless soil (sandy) was taken and tests were performed on it to find out the property of soil. The sand was filled in the box in five layers (each layer of depth 170mm), each layer compacted using hammer. The pile is then fixed as per the required L/D ratio. The vertical and horizontal load tests were performed and deflection was found using mechanical dial gauges. The curve was drawn and behaviour of pile was found under different vertical and horizontal load. 
INTRODUCTION 
Pile foundations are the part of a structure used to carry and transfer the load of the structure to the bearing ground located at some depth below ground surface. The main components of the foundation are the pile cap and the piles. Piles are long and slender members which transfer the load to deeper soil or rock of high bearing capacity avoiding shallow soil of low bearing capacity. The main types of materials used for piles are wood, steel and concrete. Piles made from these materials are driven, drilled or jacked into the ground and connected to pile caps. 
Piles are frequently subjected to lateral forces and moments viz., i) quay and harbor structures in which horizontal forces are generated due to the impact of ships during berthing and wave action, ii) offshore structures subjected to wind and wave action, iii) tall structures like chimneys, transmission towers subjected to wind loads and iv) in structures situated in earthquake prone areas. In the design of such pile foundations, not only the ultimate loads shall be worked out to arrive at the safe loads but also the deflections need to be worked out. Matlock and Reese (1960)[1] presented a generalized iterative solution method for rigid and flexible laterally loaded piles embedded in soils with two forms of varying modulus with depth. Davisson and Gill (1963)[2] investigated the case of a laterally loaded pile embedded in a layered soil system with a constant (but different) modulus of subgrade reaction in each layer. Broms (1964a, b)[3,4] method is also based on earth pressure theory with simplifying assumption for distribution of ultimate soil resistance along the pile length and this method is applicable for both short piles and long piles. Randolph (1981)[5] studied the problem of flexible piles under lateral loading and proposed algebraic expressions for pile head displacement and rotation. 
METHODOLOGY 
Wooden Box arrangement 
Setup consists of a box made from ply of 6mm thickness having dimension 640mm X 750mm X 850mm. This box is filled with sand in 5 layers. Each layer with a thickness of 170mm. After one layer is filled, it is compacted with to get the required height which was calculated taking in consideration the required density of the sand. 
Pulley Arrangement 
A wooden frame was fabricated to support the pulley system. Height of the frame is 1000mm, and the bottom support is given by three legs on each side of the frame. A hook is attached to the pile cap at its centre and also at the centre of the frame top flange. A wire is made to pass through this hooks Page 1 of 5
S. S. Chandrasekaran, Madhav Bhatt, Gautam Kumar 
and the pulley is suspended on the frame. The extension of the wire serves the purpose to support the weights. 
Deflectometer Arrangement 
The deflectometer is placed behind the pile cap. The needle is first pressed in and then the magnetic base is attached to a sheet metal box placed on the soil layer. The readings are noted down as the needle is released due to pile movement on loading. The error due to weight of brick placed on sheet metal box is negligible when the soil consolidation is measured. 
Pile 
PVC is used as the pile material. The pile under study is a floating/friction pile and hence the clearance from the bottom of the box is 250mm. the diameter of the pile is 32mm and length is 800mm. the pile is placed centrally before the sand filling is done in order to minimize the disturbance produced by driven pile to soil. It is attached to a wooden pile cap at the centre. 
Pile Cap 
The pile cap is fabricated from a wooden block of 20mm thickness. It is square in shape with sides of 95mm. a hole is cut out in at its centre to allow the pile to fit. A hole is drilled at one of its side for attaching the hook where load can be applied. 
Model Pile 
In the present experimental investigations, model pile material and its dimensions are selected adhering to the following similitude law proposed by Wood et al (2002): 
m4.51ImppEEIn= 
Equation 1 
Em = modulus of elasticity of model pile, 
Ep = modulus of elasticity of prototype pile, 
Im = moment of inertia of model pile, 
Ip = moment of inertia of prototype pile and 
1/n = scale factor for length. 
SOIL TESTS 
Relative Density Test 
Relative density is defined by the following formula: 
()minmaxmaxmindrdD ρρρρρρ − =− 
Equation 2 
For determination of minimum dry density ρmin, a representative oven dry sample of soil is taken. The sample is then pulverized and sieved. The minimum dry density is found by pouring the dry sand in mould using a pouring device. The spout of the pouring device is so adjusted that the height of the fall is always 25mm. the mass and the volume of the soil deposited are found, and the dry density of the soil is determined. 
The maximum dry density is determined by dry method. In this method, the mould is filled with thoroughly mixed oven-fry soil. A surcharge load is placed on the soil surface, and the mould is fixed to a vibrator deck. The specimen is vibrated for 8 minutes. The mass and volume of the soil in the compacted state are found. The maximum is then found. 
Mould height = 170mm 
Diameter = 150mm 
3max1.71/gcmγ= 
3min1.53/gcmγ= 
Direct Shear Test 
31.57/dgcmγ= 
Specific Gravity Test 
The specific gravity of a soil sample is given by the following formula: 
Equation 3 ()(){} 212134MMGMMMM− = −−− 
Where: 
M1 = mass of empty pycnometer 
M2 = mass of pycnometer and dry soil 
M3 = mass of pycnometer, soil and water 
M4 = mass of Pycnometer filled with water 
G = 2.60 
Page 2 of 5
Behaviour of piles under the effect of static vertical and lateral loading in sand 
Sieve Analysis 
Sample of sand taken = 1000gm 
Table 5 Sieve Analysis 
Sieve Size 
(mm) 
Test 1: 
Weight of Soil Retained 
(gm.) 
Test 2: 
Weight of Soil Retained 
(gm.) 
4.75 
18.5 
26.5 
2.36 
60 
71.5 
1.18 
240.5 
291.5 
600 
327.5 
327 
300 
247 
204.7 
150 
91.5 
66.5 
75 
8 
5 
Pan 
3 
2 
EXPERIMENTAL PROCEDURE 
The complete experimental procedure is as follows: 
1) The box is filled with sand at density of 1.53 g/cm3 in five layers 
2) The arrangement of loading on frame is done as shown in fig.1. 
3) Load is applied in increment of 1 kg. 
4) The vertical load is first kept constant at 0 kg. 
5) The deflectometer reading is noted in number of divisions and is multiplied by its least count (= 0.01mm) and tabulated. 
6) The vertical load is increased to 1 kg. 
7) The L/D ratio of pile is then changed for next step of experiment. 
8) The same steps are repeated and the readings are tabulated. 
9) Graph of load v/s deflection is plotted, with load taken on abscissa and deflection taken on ordinat 
RESULTS 
Load Deflection Data 
Table 6no axial load was applied on the pile 
Loading (Kg) 
Deflection 
(div) 
Deflection 
(m) 
0 min 
5 min 
10 min 
15 min 
0.5 
27 
27 
27 
27 
0.00027 
1 
85 
85 
86 
86 
0.00086 
1.5 
137 
137 
137 
137 
0.00137 
2 
190 
192 
192 
192 
0.00192 
2.5 
261 
262 
263 
263 
0.00263 
3 
330 
330 
330 
330 
0.0033 
3.5 
370 
370 
375 
375 
0.00375 
4 
440 
440 
440 
440 
0.0044 
4.5 
510 
514 
514 
514 
0.00514 
5 
580 
582 
582 
582 
0.00582 
Fig. 1 Load-Deflection curve with no axial load (L/D=25) 
0 
0.01 
0.02 
0.03 
0.04 
0.05 
0.06 
0 
0.002 
0.004 
0.006 
Loading (KN) 
Deflection (m) 
Page 3 of 5
S. S. Chandrasekaran, Madhav Bhatt, Gautam Kumar 
Table 7no axial load was applied on the pile 
Loading (Kg) 
Deflection 
(div) 
Deflection 
(m) 
0 min 
5 
min 
10 min 
15 
min 
0.5 
13 
13 
13 
13 
0.00013 
1 
52 
52 
52 
52 
0.00052 
1.5 
104 
104 
104 
104 
0.00104 
2 
160 
160 
160 
160 
0.0016 
2.5 
223 
223 
223 
223 
0.00223 
3 
293 
293 
293 
293 
0.00293 
3.5 
339 
339 
339 
339 
0.00339 
4 
411 
411 
411 
411 
0.00411 
4.5 
478 
478 
478 
478 
0.00478 
5 
550 
550 
550 
550 
0.0055 
Fig. 2 Load-Deflection curve with axial load of 2kg (L/D=25) 
Table 8deflection of pile due to lateral loading only 
Loading (Kg) 
Deflection 
(div) 
Deflection 
(m) 
0 min 
5 min 
10 min 
15 min 
0.5 
37 
38 
38 
38 
0.00038 
1 
90 
90 
90 
90 
0.0009 
1.5 
139 
139 
139 
139 
0.00139 
2 
208 
208 
208 
208 
0.00208 
2.5 
274 
274 
275 
275 
0.00275 
3 
322 
323 
323 
323 
0.00323 
3.5 
392 
393 
393 
393 
0.00393 
4 
504 
504 
504 
504 
0.00504 
4.5 
574 
574 
578 
578 
0.00578 
5 
637 
639 
639 
639 
0.00639 
Fig. 3 Load-Deflection curve with no axial load (L/D=20) 
Table 9defection of pile due to axial and lateral loading 
Loading (Kg) 
Deflection 
(div) 
Deflection 
(m) 
0 min 
5 
min 
10 min 
15 min 
0.5 
30 
30 
30 
30 
0.0003 
1 
72 
72 
72 
72 
0.00072 
1.5 
115 
115 
115 
115 
0.00115 
2 
175 
175 
175 
175 
0.00175 
2.5 
227 
227 
227 
227 
0.00227 
3 
287 
287 
287 
287 
0.00287 
3.5 
370 
370 
372 
372 
0.00372 
4 
421 
422 
422 
422 
0.00422 
4.5 
487 
489 
492 
492 
0.00492 
5 
562 
562 
565 
565 
0.00565 
Fig. 4 Load-Deflection curve with axial load of 2kg (L/D=20) 
0 
0.01 
0.02 
0.03 
0.04 
0.05 
0.06 
0 
0.002 
0.004 
0.006 
0.008 
Loading (KN) 
Deflection (m) 
0 
0.01 
0.02 
0.03 
0.04 
0.05 
0.06 
0 
0.002 
0.004 
0.006 
Loading (KN) 
Deflection (m) 
Page 4 of 5
Behaviour of piles under the effect of static vertical and lateral loading in sand 
CONCLUSIONS 
From the findings taken from all the experimental data and by plotting their respective load-deflection curves, we can conclude that the slope of the plot decreases. Practically, this states that as the vertical load on a pile is applied, it resists the movement due to lateral loading. As such, the ratio of vertical load applied, to lateral load, in actual cases is much larger than that can be reproduced in laboratory condition. Hence, piles supporting large load of a building undergoes minimum lateral displacement. 
From the graph and the deflection data, it is also observed that as the L/D ratio of Pile increases, the lateral deflection of the pile head decreases. 
REFERENCES 
1. Matlock, H., and Reese, L. C. (1960). "Generalized solutions for laterally loaded 
piles." J. Soil Mech. and Found. Div., ASCE, 86(5), 63-91. 
2. Davisson, M. and Gill, H. (1963). “Laterally loaded piles in a layered system.” Journal of the Soil Mechanics and Foundations Division, ASCE, 89, 63 – 94. 
3. Broms, B. B. (1964a): "Lateral Resistance of Piles in Cohesive Soils", Journal of the Soil Mechanics and Foundation Division, ASCE, 90, pp. 27 – 63. 
4. Broms, B. B. (1964b). “Design of laterally loaded piles.” Journal of the Soil Mechanics and Foundation Division, ASCE, 90, 123-156. 
5. Randolph, M. F. (1981). “The response of flexible piles to lateral loading.” Geotechnique, 31(2), 247-259. 
6. Wood, D. M., Crewe, A. and Taylor, C. (2002). “Shaking table testing of geotechnical models.” International Journal of Physical Modelling in Geotechnics, 1, 1- 13. 
• Figures 1-4 shows the load deflection curve for L/D ratio of 20 and 25 and with and without axial loading. 
• Table 1-4shows the measurements to find the relative density of the soil. 
• Table 5 Sieve Analysis test results. 
• Table 6-9 Deflection measurements taken on pile. 
• Equation 1 shows the way to compute dimension of model pile 
• Equation 2 shows the formula to compute 
• relative density. 
• Equation 3 shows the formula to compute specific gravity 
0 
0.01 
0.02 
0.03 
0.04 
0.05 
0.06 
0 
0.002 
0.004 
0.006 
Loading (KN) 
Deflection (m) Page 5 of 5

1 th 07

  • 1.
    Proceedings of IndianGeotechnical Conference December 22-24,2013, Roorkee BEHAVIOUR OF PILES UNDER THE EFFECT OF STATIC VERTICAL AND LATERAL LOADING IN SAND S. S. Chandrasekaran, Associate Professor, SMBS, VIT University. chandrasekaran.ss@vit.ac.in M. Bhatt, Student, School of Mechanical and Building Sciences, VIT University. madhav.bhatt31@gmail.com G. Kumar,Student, School of Mechanical and Building Sciences, VIT University. gaumji22@gmail.com ABSTRACT: This project reports on the behaviour of single pile due to both vertical and horizontal load applied directly. The cohesionless soil (sandy) was taken and tests were performed on it to find out the property of soil. The sand was filled in the box in five layers (each layer of depth 170mm), each layer compacted using hammer. The pile is then fixed as per the required L/D ratio. The vertical and horizontal load tests were performed and deflection was found using mechanical dial gauges. The curve was drawn and behaviour of pile was found under different vertical and horizontal load. INTRODUCTION Pile foundations are the part of a structure used to carry and transfer the load of the structure to the bearing ground located at some depth below ground surface. The main components of the foundation are the pile cap and the piles. Piles are long and slender members which transfer the load to deeper soil or rock of high bearing capacity avoiding shallow soil of low bearing capacity. The main types of materials used for piles are wood, steel and concrete. Piles made from these materials are driven, drilled or jacked into the ground and connected to pile caps. Piles are frequently subjected to lateral forces and moments viz., i) quay and harbor structures in which horizontal forces are generated due to the impact of ships during berthing and wave action, ii) offshore structures subjected to wind and wave action, iii) tall structures like chimneys, transmission towers subjected to wind loads and iv) in structures situated in earthquake prone areas. In the design of such pile foundations, not only the ultimate loads shall be worked out to arrive at the safe loads but also the deflections need to be worked out. Matlock and Reese (1960)[1] presented a generalized iterative solution method for rigid and flexible laterally loaded piles embedded in soils with two forms of varying modulus with depth. Davisson and Gill (1963)[2] investigated the case of a laterally loaded pile embedded in a layered soil system with a constant (but different) modulus of subgrade reaction in each layer. Broms (1964a, b)[3,4] method is also based on earth pressure theory with simplifying assumption for distribution of ultimate soil resistance along the pile length and this method is applicable for both short piles and long piles. Randolph (1981)[5] studied the problem of flexible piles under lateral loading and proposed algebraic expressions for pile head displacement and rotation. METHODOLOGY Wooden Box arrangement Setup consists of a box made from ply of 6mm thickness having dimension 640mm X 750mm X 850mm. This box is filled with sand in 5 layers. Each layer with a thickness of 170mm. After one layer is filled, it is compacted with to get the required height which was calculated taking in consideration the required density of the sand. Pulley Arrangement A wooden frame was fabricated to support the pulley system. Height of the frame is 1000mm, and the bottom support is given by three legs on each side of the frame. A hook is attached to the pile cap at its centre and also at the centre of the frame top flange. A wire is made to pass through this hooks Page 1 of 5
  • 2.
    S. S. Chandrasekaran,Madhav Bhatt, Gautam Kumar and the pulley is suspended on the frame. The extension of the wire serves the purpose to support the weights. Deflectometer Arrangement The deflectometer is placed behind the pile cap. The needle is first pressed in and then the magnetic base is attached to a sheet metal box placed on the soil layer. The readings are noted down as the needle is released due to pile movement on loading. The error due to weight of brick placed on sheet metal box is negligible when the soil consolidation is measured. Pile PVC is used as the pile material. The pile under study is a floating/friction pile and hence the clearance from the bottom of the box is 250mm. the diameter of the pile is 32mm and length is 800mm. the pile is placed centrally before the sand filling is done in order to minimize the disturbance produced by driven pile to soil. It is attached to a wooden pile cap at the centre. Pile Cap The pile cap is fabricated from a wooden block of 20mm thickness. It is square in shape with sides of 95mm. a hole is cut out in at its centre to allow the pile to fit. A hole is drilled at one of its side for attaching the hook where load can be applied. Model Pile In the present experimental investigations, model pile material and its dimensions are selected adhering to the following similitude law proposed by Wood et al (2002): m4.51ImppEEIn= Equation 1 Em = modulus of elasticity of model pile, Ep = modulus of elasticity of prototype pile, Im = moment of inertia of model pile, Ip = moment of inertia of prototype pile and 1/n = scale factor for length. SOIL TESTS Relative Density Test Relative density is defined by the following formula: ()minmaxmaxmindrdD ρρρρρρ − =− Equation 2 For determination of minimum dry density ρmin, a representative oven dry sample of soil is taken. The sample is then pulverized and sieved. The minimum dry density is found by pouring the dry sand in mould using a pouring device. The spout of the pouring device is so adjusted that the height of the fall is always 25mm. the mass and the volume of the soil deposited are found, and the dry density of the soil is determined. The maximum dry density is determined by dry method. In this method, the mould is filled with thoroughly mixed oven-fry soil. A surcharge load is placed on the soil surface, and the mould is fixed to a vibrator deck. The specimen is vibrated for 8 minutes. The mass and volume of the soil in the compacted state are found. The maximum is then found. Mould height = 170mm Diameter = 150mm 3max1.71/gcmγ= 3min1.53/gcmγ= Direct Shear Test 31.57/dgcmγ= Specific Gravity Test The specific gravity of a soil sample is given by the following formula: Equation 3 ()(){} 212134MMGMMMM− = −−− Where: M1 = mass of empty pycnometer M2 = mass of pycnometer and dry soil M3 = mass of pycnometer, soil and water M4 = mass of Pycnometer filled with water G = 2.60 Page 2 of 5
  • 3.
    Behaviour of pilesunder the effect of static vertical and lateral loading in sand Sieve Analysis Sample of sand taken = 1000gm Table 5 Sieve Analysis Sieve Size (mm) Test 1: Weight of Soil Retained (gm.) Test 2: Weight of Soil Retained (gm.) 4.75 18.5 26.5 2.36 60 71.5 1.18 240.5 291.5 600 327.5 327 300 247 204.7 150 91.5 66.5 75 8 5 Pan 3 2 EXPERIMENTAL PROCEDURE The complete experimental procedure is as follows: 1) The box is filled with sand at density of 1.53 g/cm3 in five layers 2) The arrangement of loading on frame is done as shown in fig.1. 3) Load is applied in increment of 1 kg. 4) The vertical load is first kept constant at 0 kg. 5) The deflectometer reading is noted in number of divisions and is multiplied by its least count (= 0.01mm) and tabulated. 6) The vertical load is increased to 1 kg. 7) The L/D ratio of pile is then changed for next step of experiment. 8) The same steps are repeated and the readings are tabulated. 9) Graph of load v/s deflection is plotted, with load taken on abscissa and deflection taken on ordinat RESULTS Load Deflection Data Table 6no axial load was applied on the pile Loading (Kg) Deflection (div) Deflection (m) 0 min 5 min 10 min 15 min 0.5 27 27 27 27 0.00027 1 85 85 86 86 0.00086 1.5 137 137 137 137 0.00137 2 190 192 192 192 0.00192 2.5 261 262 263 263 0.00263 3 330 330 330 330 0.0033 3.5 370 370 375 375 0.00375 4 440 440 440 440 0.0044 4.5 510 514 514 514 0.00514 5 580 582 582 582 0.00582 Fig. 1 Load-Deflection curve with no axial load (L/D=25) 0 0.01 0.02 0.03 0.04 0.05 0.06 0 0.002 0.004 0.006 Loading (KN) Deflection (m) Page 3 of 5
  • 4.
    S. S. Chandrasekaran,Madhav Bhatt, Gautam Kumar Table 7no axial load was applied on the pile Loading (Kg) Deflection (div) Deflection (m) 0 min 5 min 10 min 15 min 0.5 13 13 13 13 0.00013 1 52 52 52 52 0.00052 1.5 104 104 104 104 0.00104 2 160 160 160 160 0.0016 2.5 223 223 223 223 0.00223 3 293 293 293 293 0.00293 3.5 339 339 339 339 0.00339 4 411 411 411 411 0.00411 4.5 478 478 478 478 0.00478 5 550 550 550 550 0.0055 Fig. 2 Load-Deflection curve with axial load of 2kg (L/D=25) Table 8deflection of pile due to lateral loading only Loading (Kg) Deflection (div) Deflection (m) 0 min 5 min 10 min 15 min 0.5 37 38 38 38 0.00038 1 90 90 90 90 0.0009 1.5 139 139 139 139 0.00139 2 208 208 208 208 0.00208 2.5 274 274 275 275 0.00275 3 322 323 323 323 0.00323 3.5 392 393 393 393 0.00393 4 504 504 504 504 0.00504 4.5 574 574 578 578 0.00578 5 637 639 639 639 0.00639 Fig. 3 Load-Deflection curve with no axial load (L/D=20) Table 9defection of pile due to axial and lateral loading Loading (Kg) Deflection (div) Deflection (m) 0 min 5 min 10 min 15 min 0.5 30 30 30 30 0.0003 1 72 72 72 72 0.00072 1.5 115 115 115 115 0.00115 2 175 175 175 175 0.00175 2.5 227 227 227 227 0.00227 3 287 287 287 287 0.00287 3.5 370 370 372 372 0.00372 4 421 422 422 422 0.00422 4.5 487 489 492 492 0.00492 5 562 562 565 565 0.00565 Fig. 4 Load-Deflection curve with axial load of 2kg (L/D=20) 0 0.01 0.02 0.03 0.04 0.05 0.06 0 0.002 0.004 0.006 0.008 Loading (KN) Deflection (m) 0 0.01 0.02 0.03 0.04 0.05 0.06 0 0.002 0.004 0.006 Loading (KN) Deflection (m) Page 4 of 5
  • 5.
    Behaviour of pilesunder the effect of static vertical and lateral loading in sand CONCLUSIONS From the findings taken from all the experimental data and by plotting their respective load-deflection curves, we can conclude that the slope of the plot decreases. Practically, this states that as the vertical load on a pile is applied, it resists the movement due to lateral loading. As such, the ratio of vertical load applied, to lateral load, in actual cases is much larger than that can be reproduced in laboratory condition. Hence, piles supporting large load of a building undergoes minimum lateral displacement. From the graph and the deflection data, it is also observed that as the L/D ratio of Pile increases, the lateral deflection of the pile head decreases. REFERENCES 1. Matlock, H., and Reese, L. C. (1960). "Generalized solutions for laterally loaded piles." J. Soil Mech. and Found. Div., ASCE, 86(5), 63-91. 2. Davisson, M. and Gill, H. (1963). “Laterally loaded piles in a layered system.” Journal of the Soil Mechanics and Foundations Division, ASCE, 89, 63 – 94. 3. Broms, B. B. (1964a): "Lateral Resistance of Piles in Cohesive Soils", Journal of the Soil Mechanics and Foundation Division, ASCE, 90, pp. 27 – 63. 4. Broms, B. B. (1964b). “Design of laterally loaded piles.” Journal of the Soil Mechanics and Foundation Division, ASCE, 90, 123-156. 5. Randolph, M. F. (1981). “The response of flexible piles to lateral loading.” Geotechnique, 31(2), 247-259. 6. Wood, D. M., Crewe, A. and Taylor, C. (2002). “Shaking table testing of geotechnical models.” International Journal of Physical Modelling in Geotechnics, 1, 1- 13. • Figures 1-4 shows the load deflection curve for L/D ratio of 20 and 25 and with and without axial loading. • Table 1-4shows the measurements to find the relative density of the soil. • Table 5 Sieve Analysis test results. • Table 6-9 Deflection measurements taken on pile. • Equation 1 shows the way to compute dimension of model pile • Equation 2 shows the formula to compute • relative density. • Equation 3 shows the formula to compute specific gravity 0 0.01 0.02 0.03 0.04 0.05 0.06 0 0.002 0.004 0.006 Loading (KN) Deflection (m) Page 5 of 5