Download to read offline
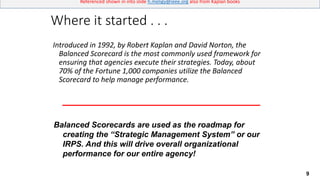

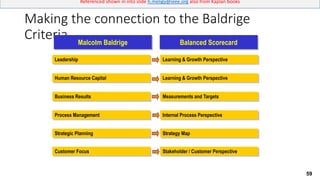
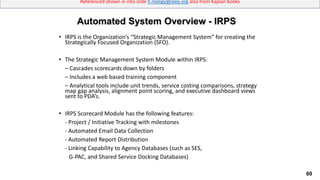

This document appears to be a presentation on introducing the balanced scorecard approach to an organization. The key points are: - The purpose is to introduce the balanced scorecard, ensure understanding of how it works, and how it fits with the Malcolm Baldrige model of performance excellence. - A major driver for adopting the balanced scorecard is the organization's new Information Resource Planning System, which will be designed around the balanced scorecard framework. - The balanced scorecard will provide a more strategic, balanced view of performance compared to the current tactical metrics, and will be the new strategic view and management system for the whole agency.


