Download to read offline
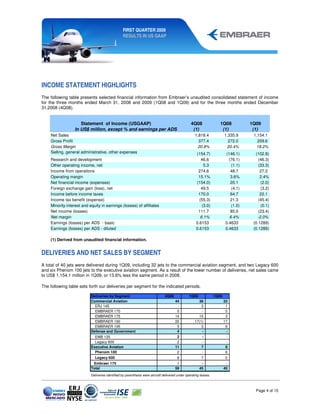
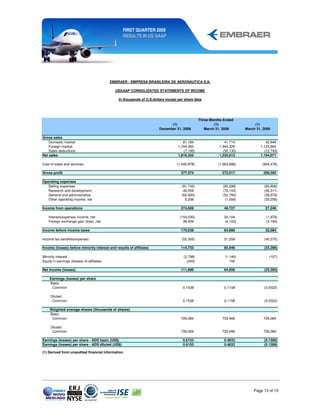

Embraer released its first quarter 2009 results according to US GAAP, reporting a net loss of $23.4 million compared to net income of $85 million in Q1 2008. Net sales decreased 13.6% to $1,154.1 million due to fewer aircraft deliveries. The operating margin fell to 2.4% from 3.6% in Q1 2008 due to lower revenues, costs from layoffs, and penalties from cancelled orders. Embraer revised its full-year guidance downward due to the economic downturn's effects on the aviation industry.


