Introduction
Physiological aspects ofphotosynthesis and
respiration have to be demonstrated in sorting out the
regulation and function of various components. If there are
inefficiencies in these systems and if causes can be
identified, they would represent legitimate targets for
genetic manipulation. Properties of rubisco, alternative
oxidase and photorespiration process already loom as
opportunities for genetic manipulation. However, about their
utilities we are yet uncertain.
2
3.
Serious reinvestigation offoliage canopies
offers promise for important gains in photosynthetic
productivity of crops. First cycle of such research,
begun over 50 years ago, in which importance of
strong advantages of erect leaves in dense canopies
and minimum interception by emergent reproductive
structures was demonstrated.
3
4.
Plant production isdriven by photosynthesis and the key
elements in the system are:
1. The interception of photosynthetically active
radiations (PAR, 400-700 nm spectral band),
2. Use of that energy in the reduction of CO2 and other
substrates (Photosynthesis),
3. Incorporation of assimilates into new plant structures
(biosynthesis and growth), and
4. Maintenance of plant as living unit. 4
5.
Achieving high yieldis conceptually simple:
Maximize the extent and duration of radiation
interception
Use captured energy in efficient photosynthesis
Partition new assimilates in ways that provide optimal
proportion of leaf, stem, root, and reproductive
structures and
Maintain those at minimum cost
5
6.
Crop yieldcomprises only a portion of biomass that accumulates
over a crop cycle. Effective root and canopy systems (including
stem structure for foliage display), for example, generally must
be established before onset of reproductive phase.
In addition, cost of maintenance increases as vegetative
biomass accumulates during season. Because crops are
at mercy of spatial and temporal variations in weather,
plant spacing, supplies of water and nutrients, and in
occurrence of pests and diseases.
Therefore, flexibility in morphogenesis and acclimation
of physiological systems is a key requirement for
achieving high and stable performance.
6
7.
During domesticationof crop plants, plant breeders selected
for crop yield via maximum investment into harvested
organs (mostly seeds).
Total plant biomass production of advanced wheat is the
same as its wild progenitors yet grain yield has increased
some 30-fold through breeding. That is, whole-plant source
and sink strength have not changed.
Impact of green Revolution can be attributed mostly to
improved partitioning of products of photosynthesis to
grain yield, progress in yield is strongly associated with
improved harvest index (HI).
Morphological traits associated with increased yield
potential include grain number and HI.
BIOMASS AND OTHER MORPHOLOGICAL TRAITS
7
8.
Even if HIcould be raised to 60% from its current
maximum value (50%), it implies that yields could only
be increased by a further 20% using HI as a selection
criterion, unless total crop biomass is also raised.
Furthermore, improved partitioning by greater
reduction in plant height is unlikely since research
suggest that optimal plant heights have already been
achieved. Some studies have shown increased biomass
to be associated with yield increases.
8
9.
PHOTOSYNTHESIS AND RELATEDTRAITS
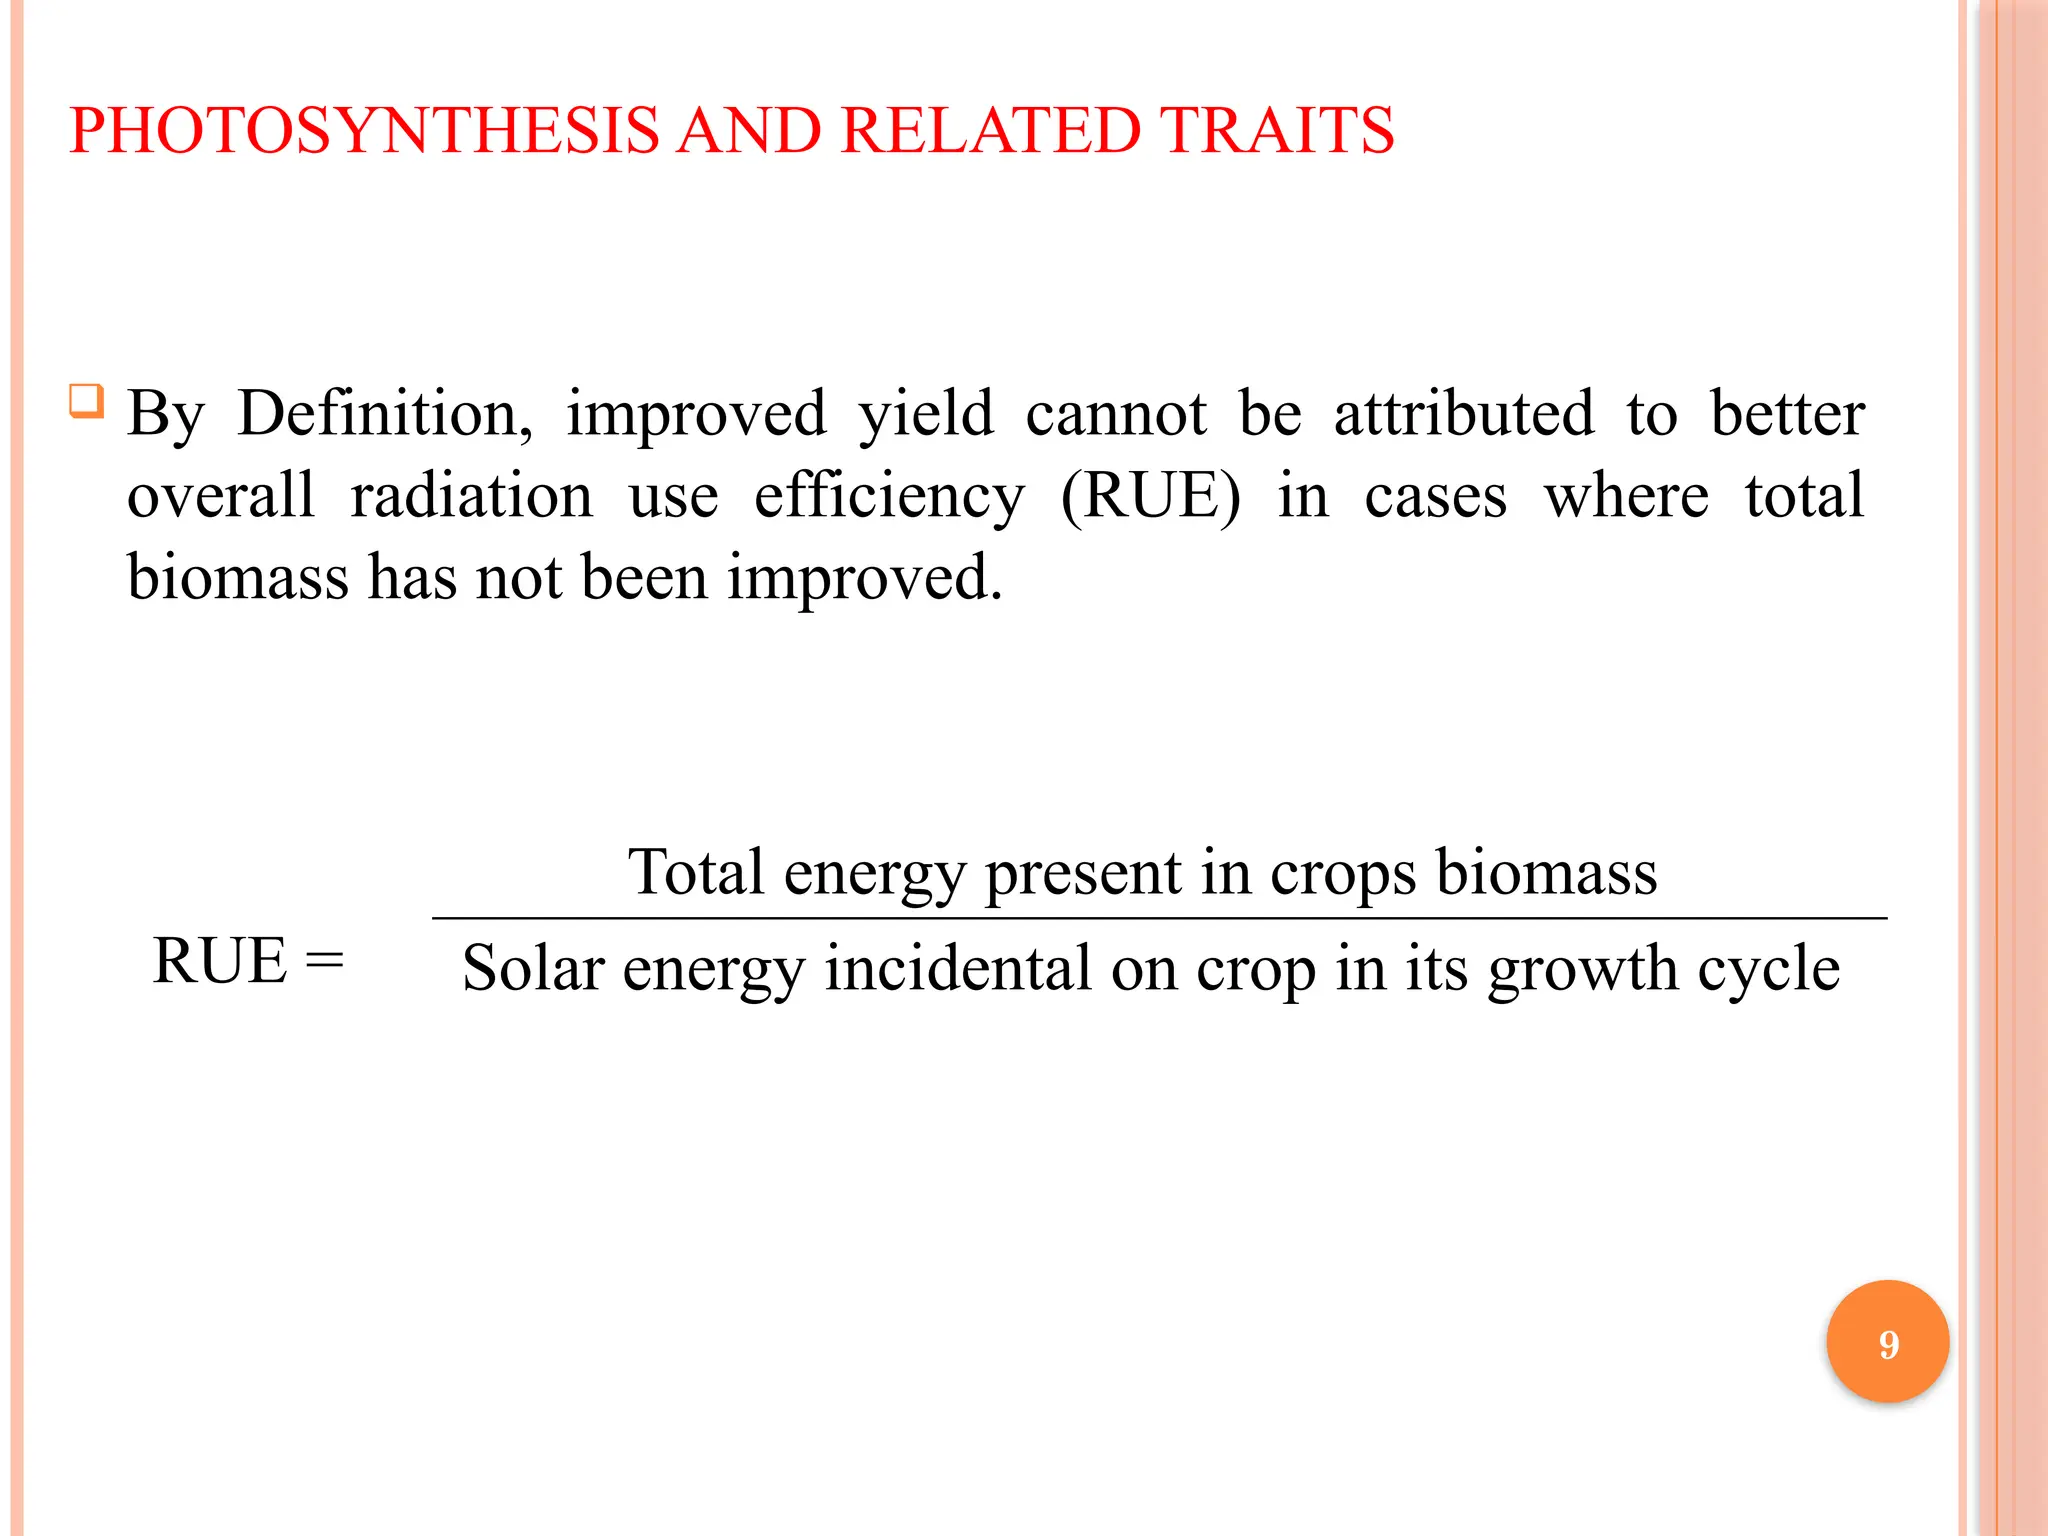
By Definition, improved yield cannot be attributed to better
overall radiation use efficiency (RUE) in cases where total
biomass has not been improved.
RUE =
Total energy present in crops biomass
Solar energy incidental on crop in its growth cycle
9
10.
Expression ofhigher photosynthetic rate in absence of
significant changes in biomass could be a pleiotropic effect of
improved partitioning to yield driven by high demand for
assimilates during grain filling.
Canopy temperature depression is a direct function of
evapotranspiration rate, which itself is determined largely by
stomatal conductance.
These traits could also be pleiotropic effects of genetic
variability among lines for a number of physiological and
metabolic processes including sink strenghth, photosynthetic
rate, vascular capacity and hormonal signals.
10
11.
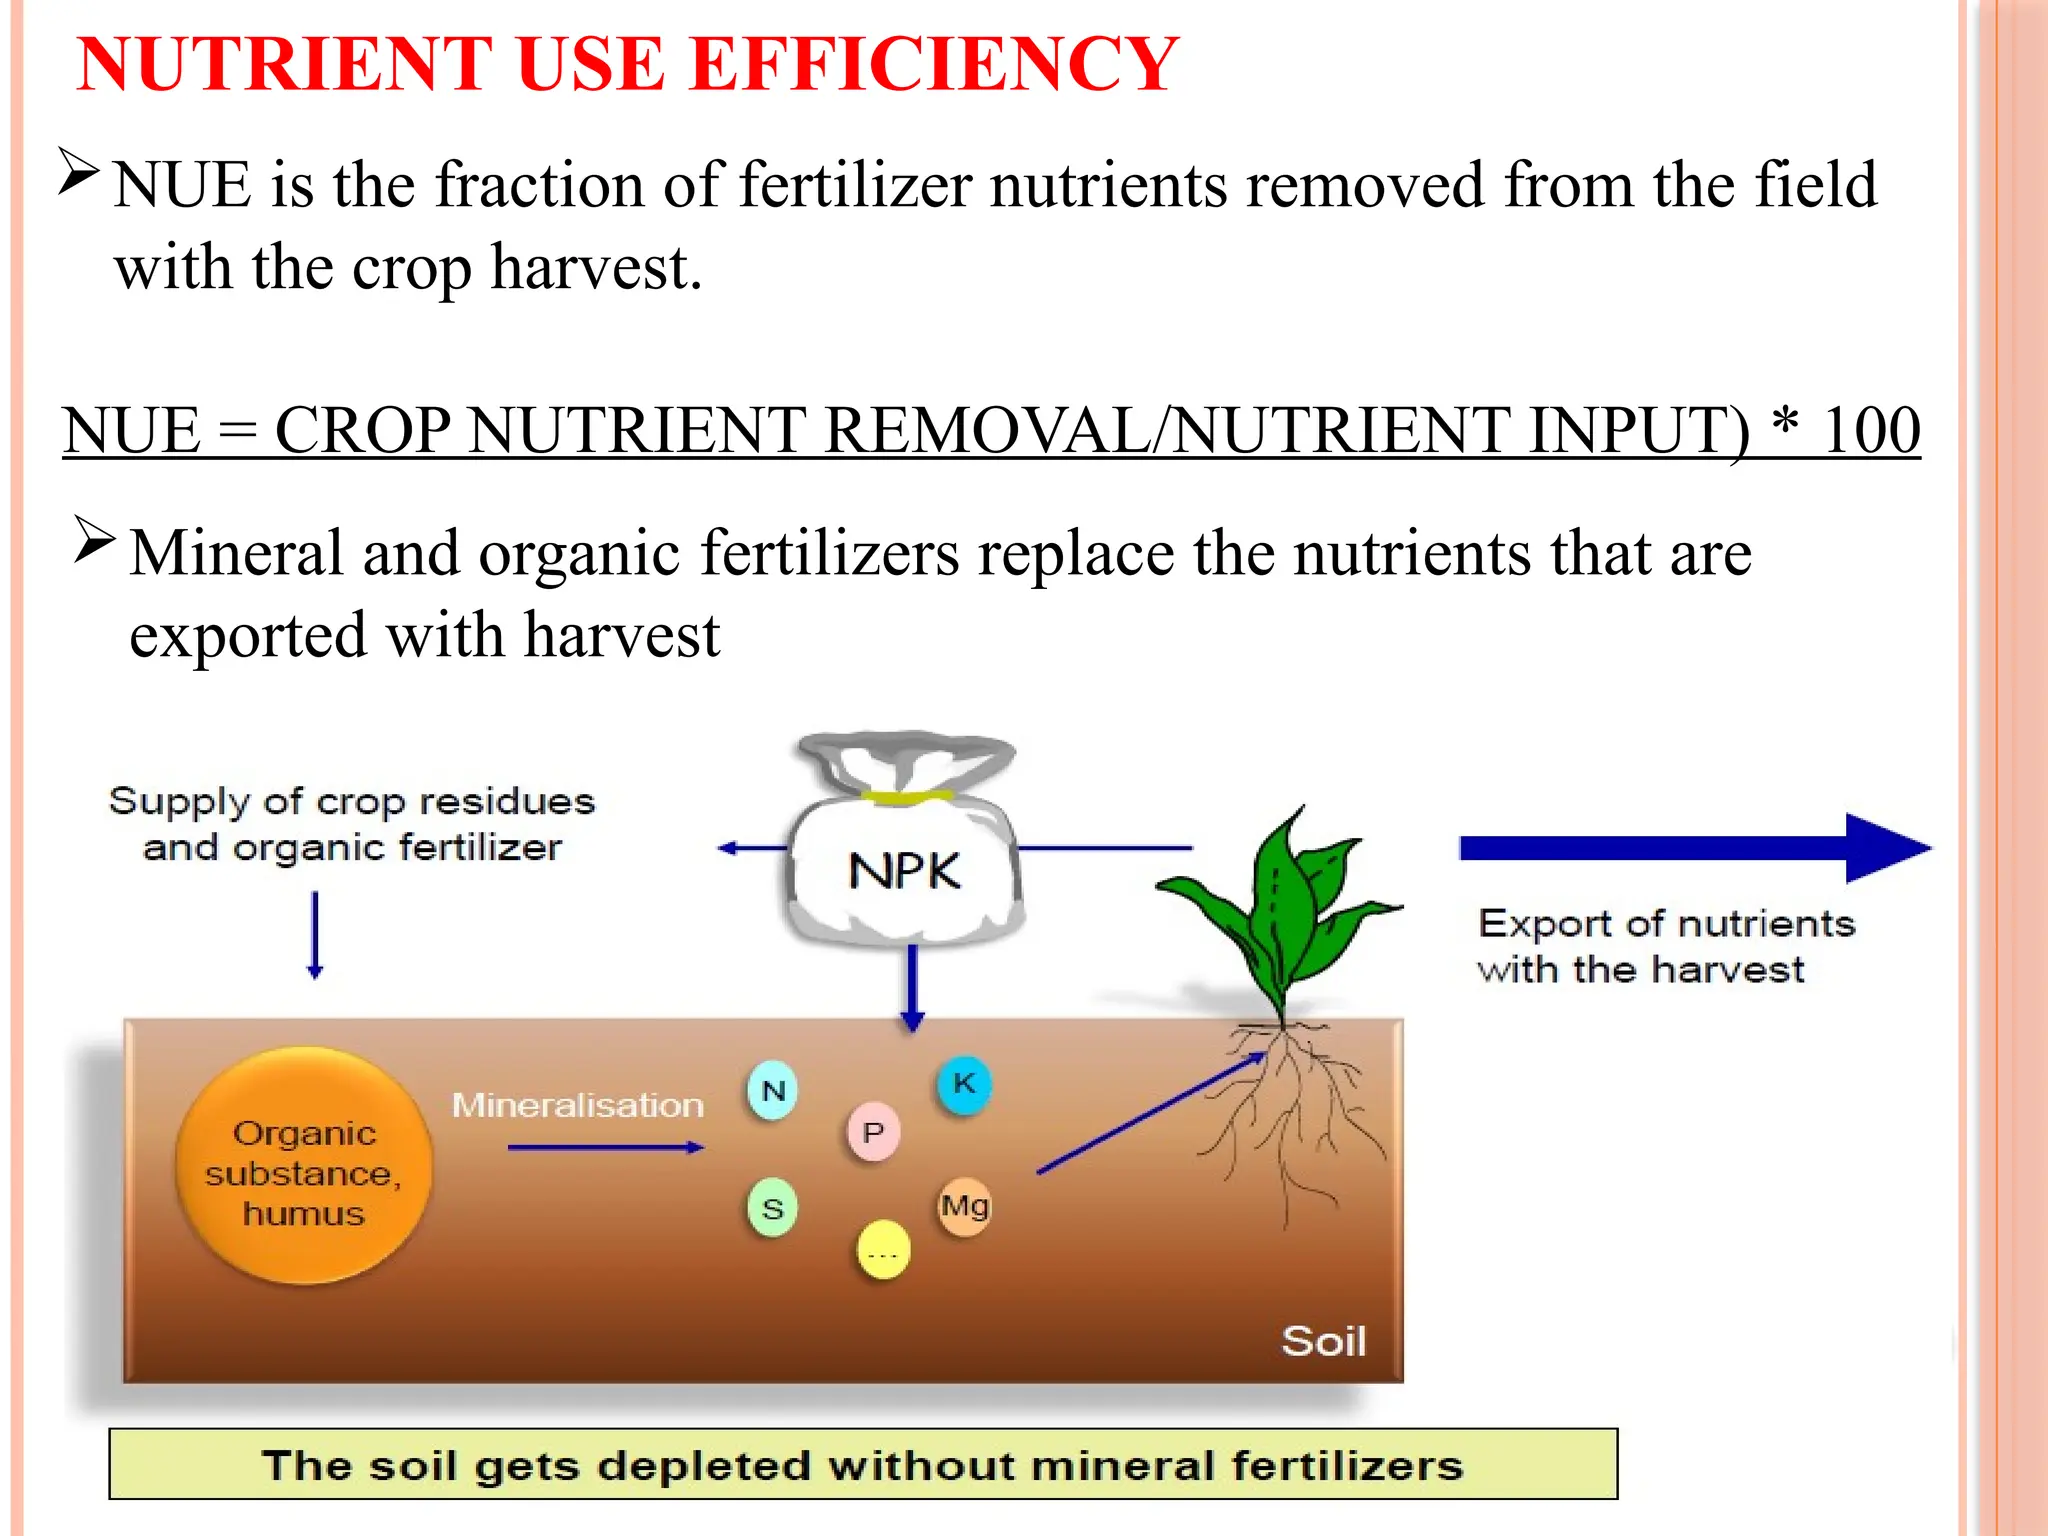
NUTRIENT USE EFFICIENCY
NUEis the fraction of fertilizer nutrients removed from the field
with the crop harvest.
NUE = CROP NUTRIENT REMOVAL/NUTRIENT INPUT) * 100
Mineral and organic fertilizers replace the nutrients that are
exported with harvest
11
12.
Nutrient use inIndia is largely subsidy driven and not
science-based, the practical benefits of high use efficiency
are distorted since N, the cheapest or most subsidized
nutrient, is used most while other nutrients are presently
ignored.
Although fertiliser consumption is increasing quantitatively,
the corresponding yield increase per unit of nutrient input is
substantially diminished compared to previous years.
Ultimately, the blame goes to a perceived
ineffectiveness of fertiliser. 12
13.
It is importantto understand that nutrient use efficiency is
dependant on several agronomic factors including:
Soil degradation, land tillage, time of sowing, appropriate
crop variety, proper planting or seeding, sufficient irrigation,
weed control, pest/disease management, and balanced and
proper nutrient use.
These factors largely influence nutrient use
efficiency, either individually or collectively.
For example, selection of proper planting material,
population density, and balanced fertilisation could
collectively improve nutrient use efficiency by 25 to 50%.
13
14.
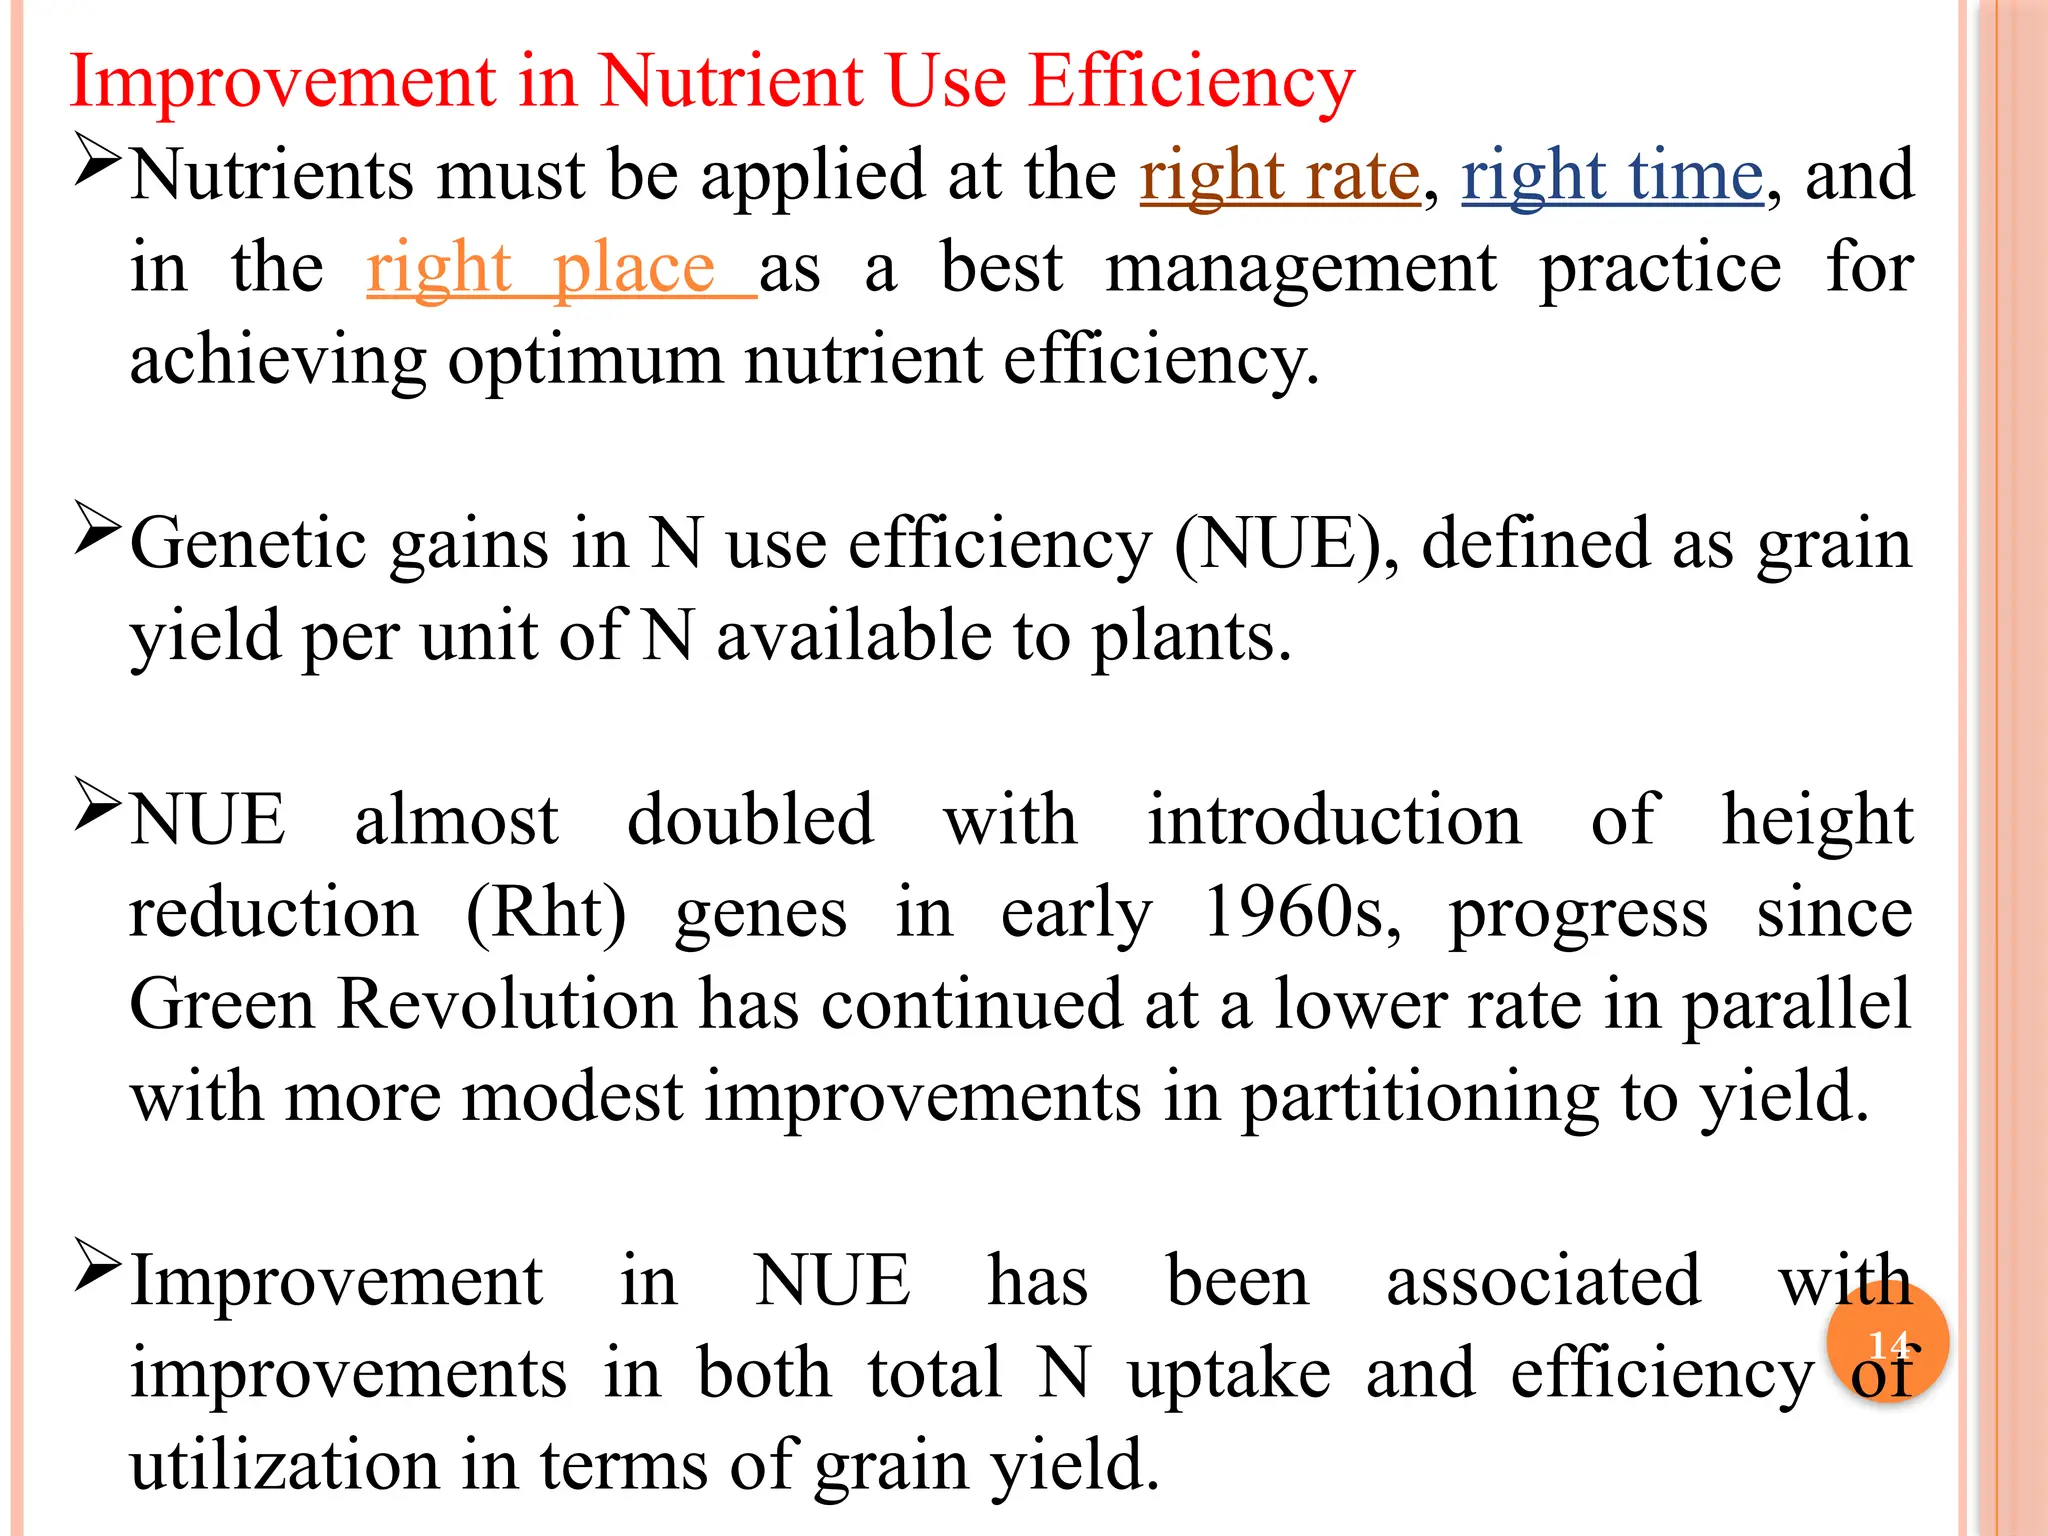
Improvement in NutrientUse Efficiency
Nutrients must be applied at the right rate, right time, and
in the right place as a best management practice for
achieving optimum nutrient efficiency.
Genetic gains in N use efficiency (NUE), defined as grain
yield per unit of N available to plants.
NUE almost doubled with introduction of height
reduction (Rht) genes in early 1960s, progress since
Green Revolution has continued at a lower rate in parallel
with more modest improvements in partitioning to yield.
Improvement in NUE has been associated with
improvements in both total N uptake and efficiency of
utilization in terms of grain yield.
14
15.
The GreenRevolution varieties demonstrated genetic
gains in yield even under severely N-limited conditions
i.e. 2 to 2.5 t/ha yield levels.
This trend has continued since 1966 with varieties of
mid 1980s yielding more than 3 t/ha under same
conditions.
Work in Argentina has demonstrated improvement in
both N and P use efficiency in modern varieties of
wheat. 15
16.
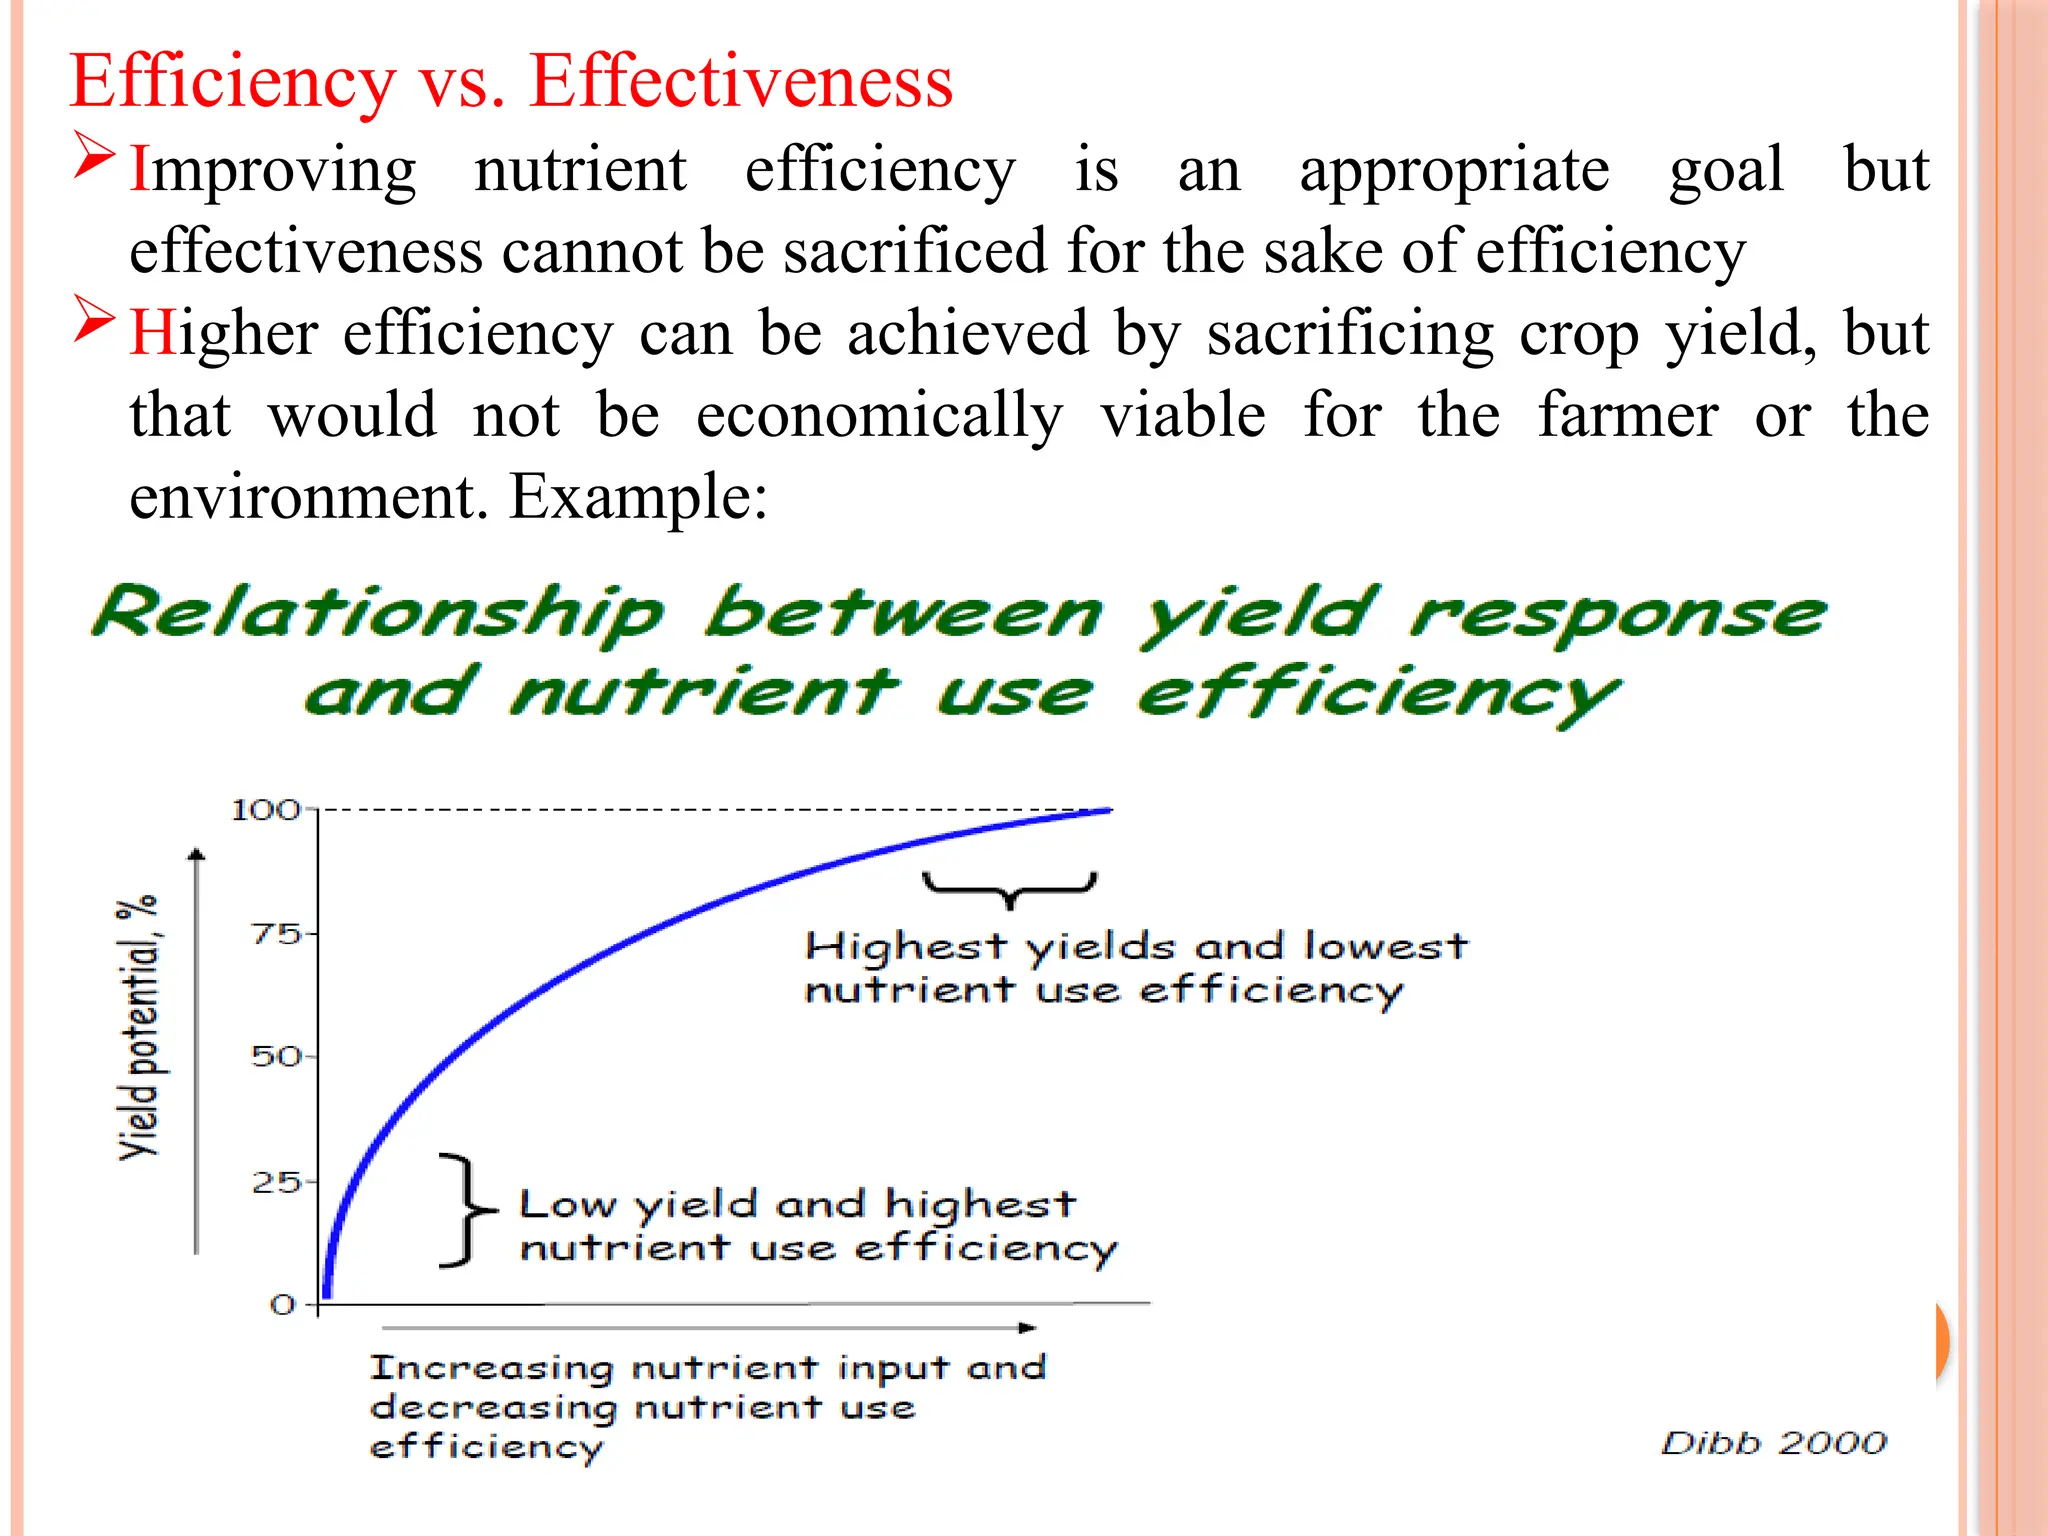
Efficiency vs. Effectiveness
Improvingnutrient efficiency is an appropriate goal but
effectiveness cannot be sacrificed for the sake of efficiency
Higher efficiency can be achieved by sacrificing crop yield, but
that would not be economically viable for the farmer or the
environment. Example:
16
17.
Adaptation to Density
Plantpopulation is defined as the number of plants per unit area.
Yield of a crop is the result of final plant population which
depends upon the no. of viable seeds, germination % and survival
rates.
Establishment of optimum plant population is essential to get
maximum yield.
Full yield potential of individual plant is achieved when
sown at wider spacing.
When sown densely, competition among plants is more for
growth factors resulting in reduction in size and yield of plant. 17
18.
Cont..
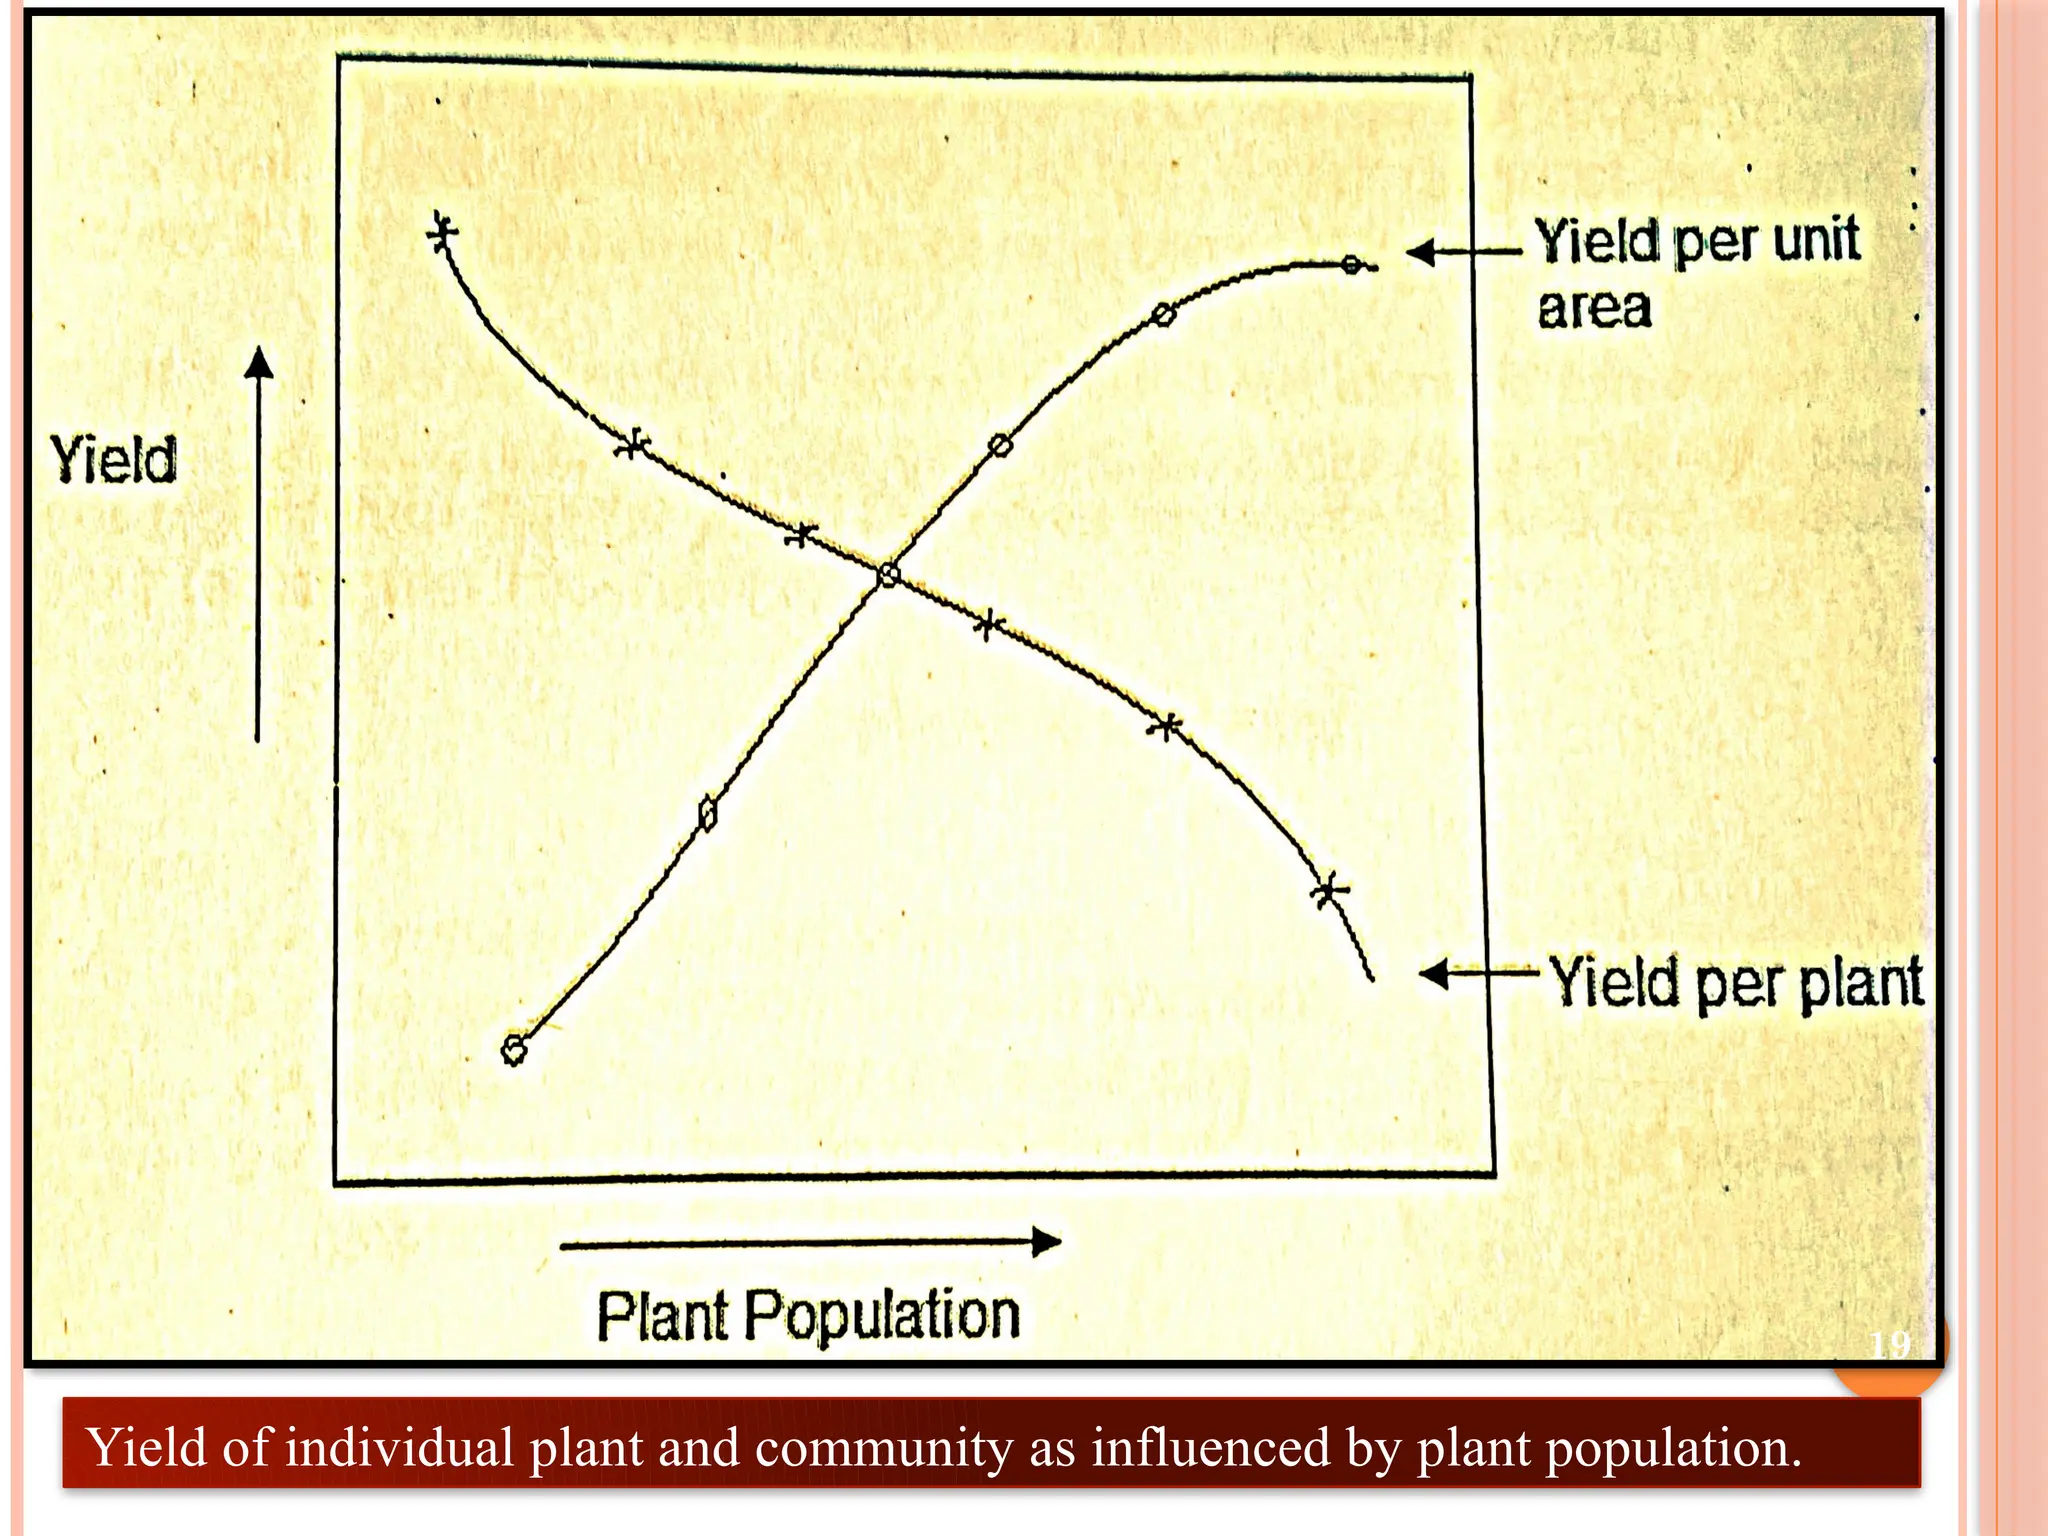
Yield per plantis decreased gradually as plant population per unit
area is increased. However, the yield per unit area is increased due
to efficient utilization of growth factors.
Maximum yield per unit area therefore can be obtained
when the individual plants are subjected to severe competition.
Dry matter production per unit area increases with increase in plant
population up to a limit when the reduction in the growth of a plant
is more than compensated by increase in the number of plants per
unit area.
Improvement in yield potential would appear to be more a function
of improved adaptation to canopy microenvironment, rather than
macro-environmental factors such as climate.
18
19.
Yield of individualplant and community as influenced by plant population.
19
20.
Idea that higheryield potential could be achieved by designing a
plant that is well adapted to commercial practice of sowing high
density monocultures was introduced by Donald (1968).
Selection for yield potential in early generations can be enhanced
by reducing interplant competition between genotypes in bread
wheat (Lungu et al., 1987), and durum wheat (Mitchell et al.,
1982). The conventional breeding approaches may lose yield
potential by selecting against it.
As in rice, the row spacing and number of seedlings per hill has been
scaled down from 30 cm to 15-20 cm and 5-6 seedlings per hill to 2-3
seedlings per hill respectively, when compared to traditional varieties.
This change may be attributed to non lodging, short stature and high
Cont..
20
21.
IMPROVING THE IDEOTYPE
Few studies, have been conducted to examine physiological
basis of yield improvement in post-Green Revolution era.
For this reason, further investment is made in understanding
which plant traits could be optimized to further improve
yield.
Many traits have been suggested in literature as having
potential to raise yield but very few have been examined in a
systematic way for their potential to increase genetic gains
when used as selection criteria. 21
22.
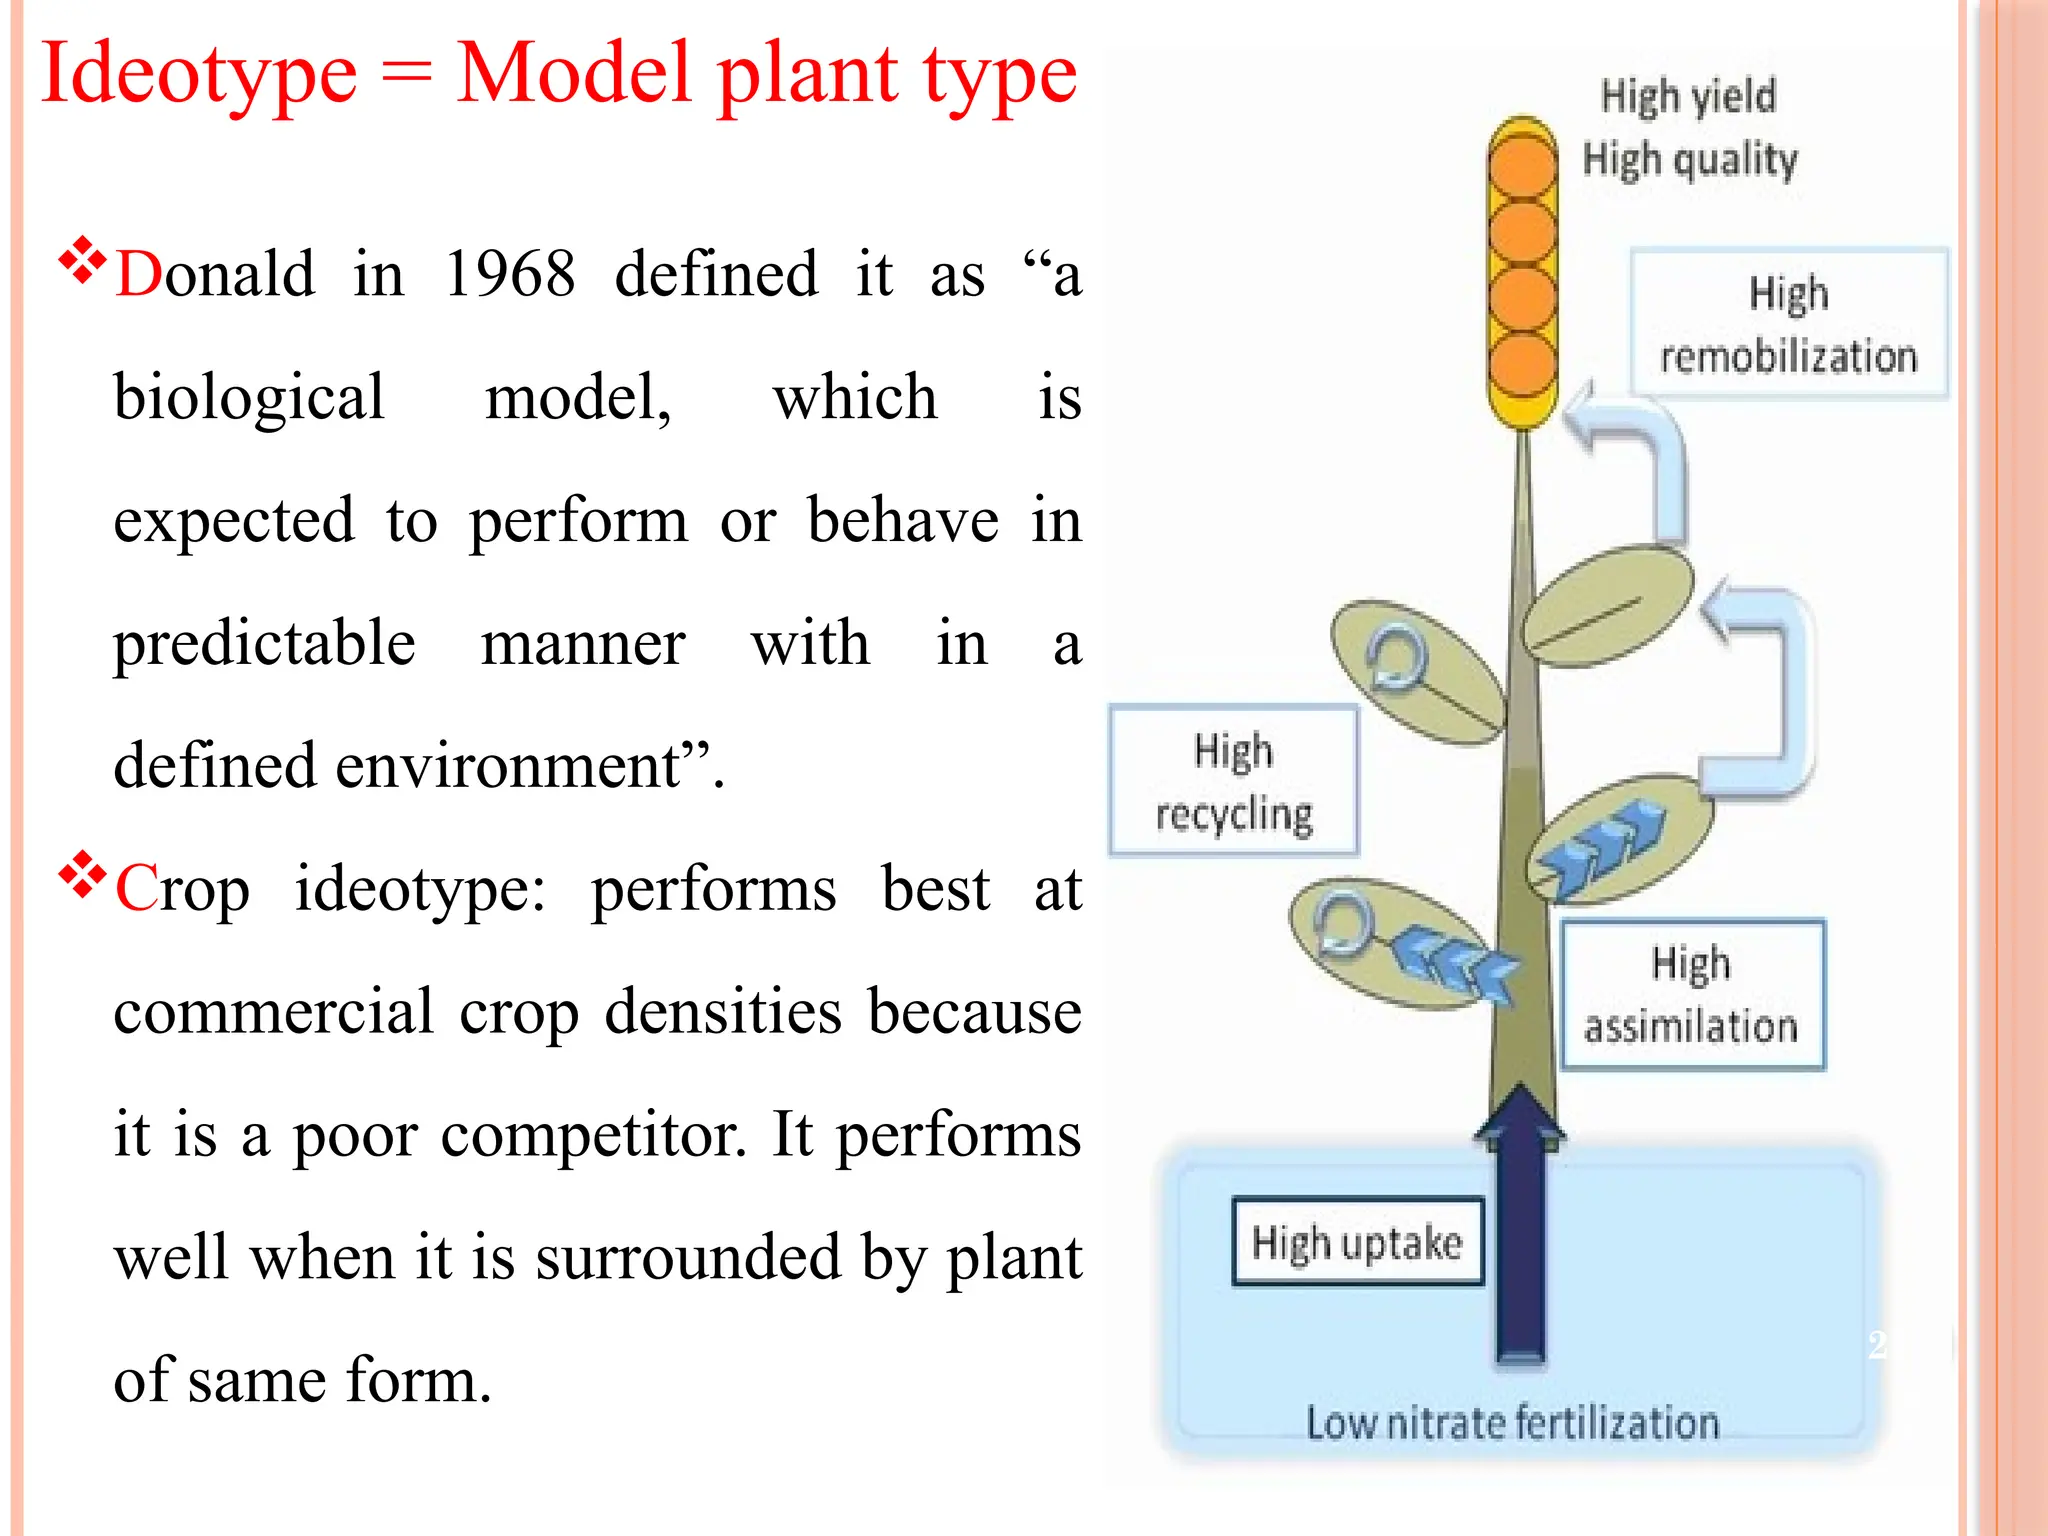
Ideotype = Modelplant type
Donald in 1968 defined it as “a
biological model, which is
expected to perform or behave in
predictable manner with in a
defined environment”.
Crop ideotype: performs best at
commercial crop densities because
it is a poor competitor. It performs
well when it is surrounded by plant
of same form.
22
23.
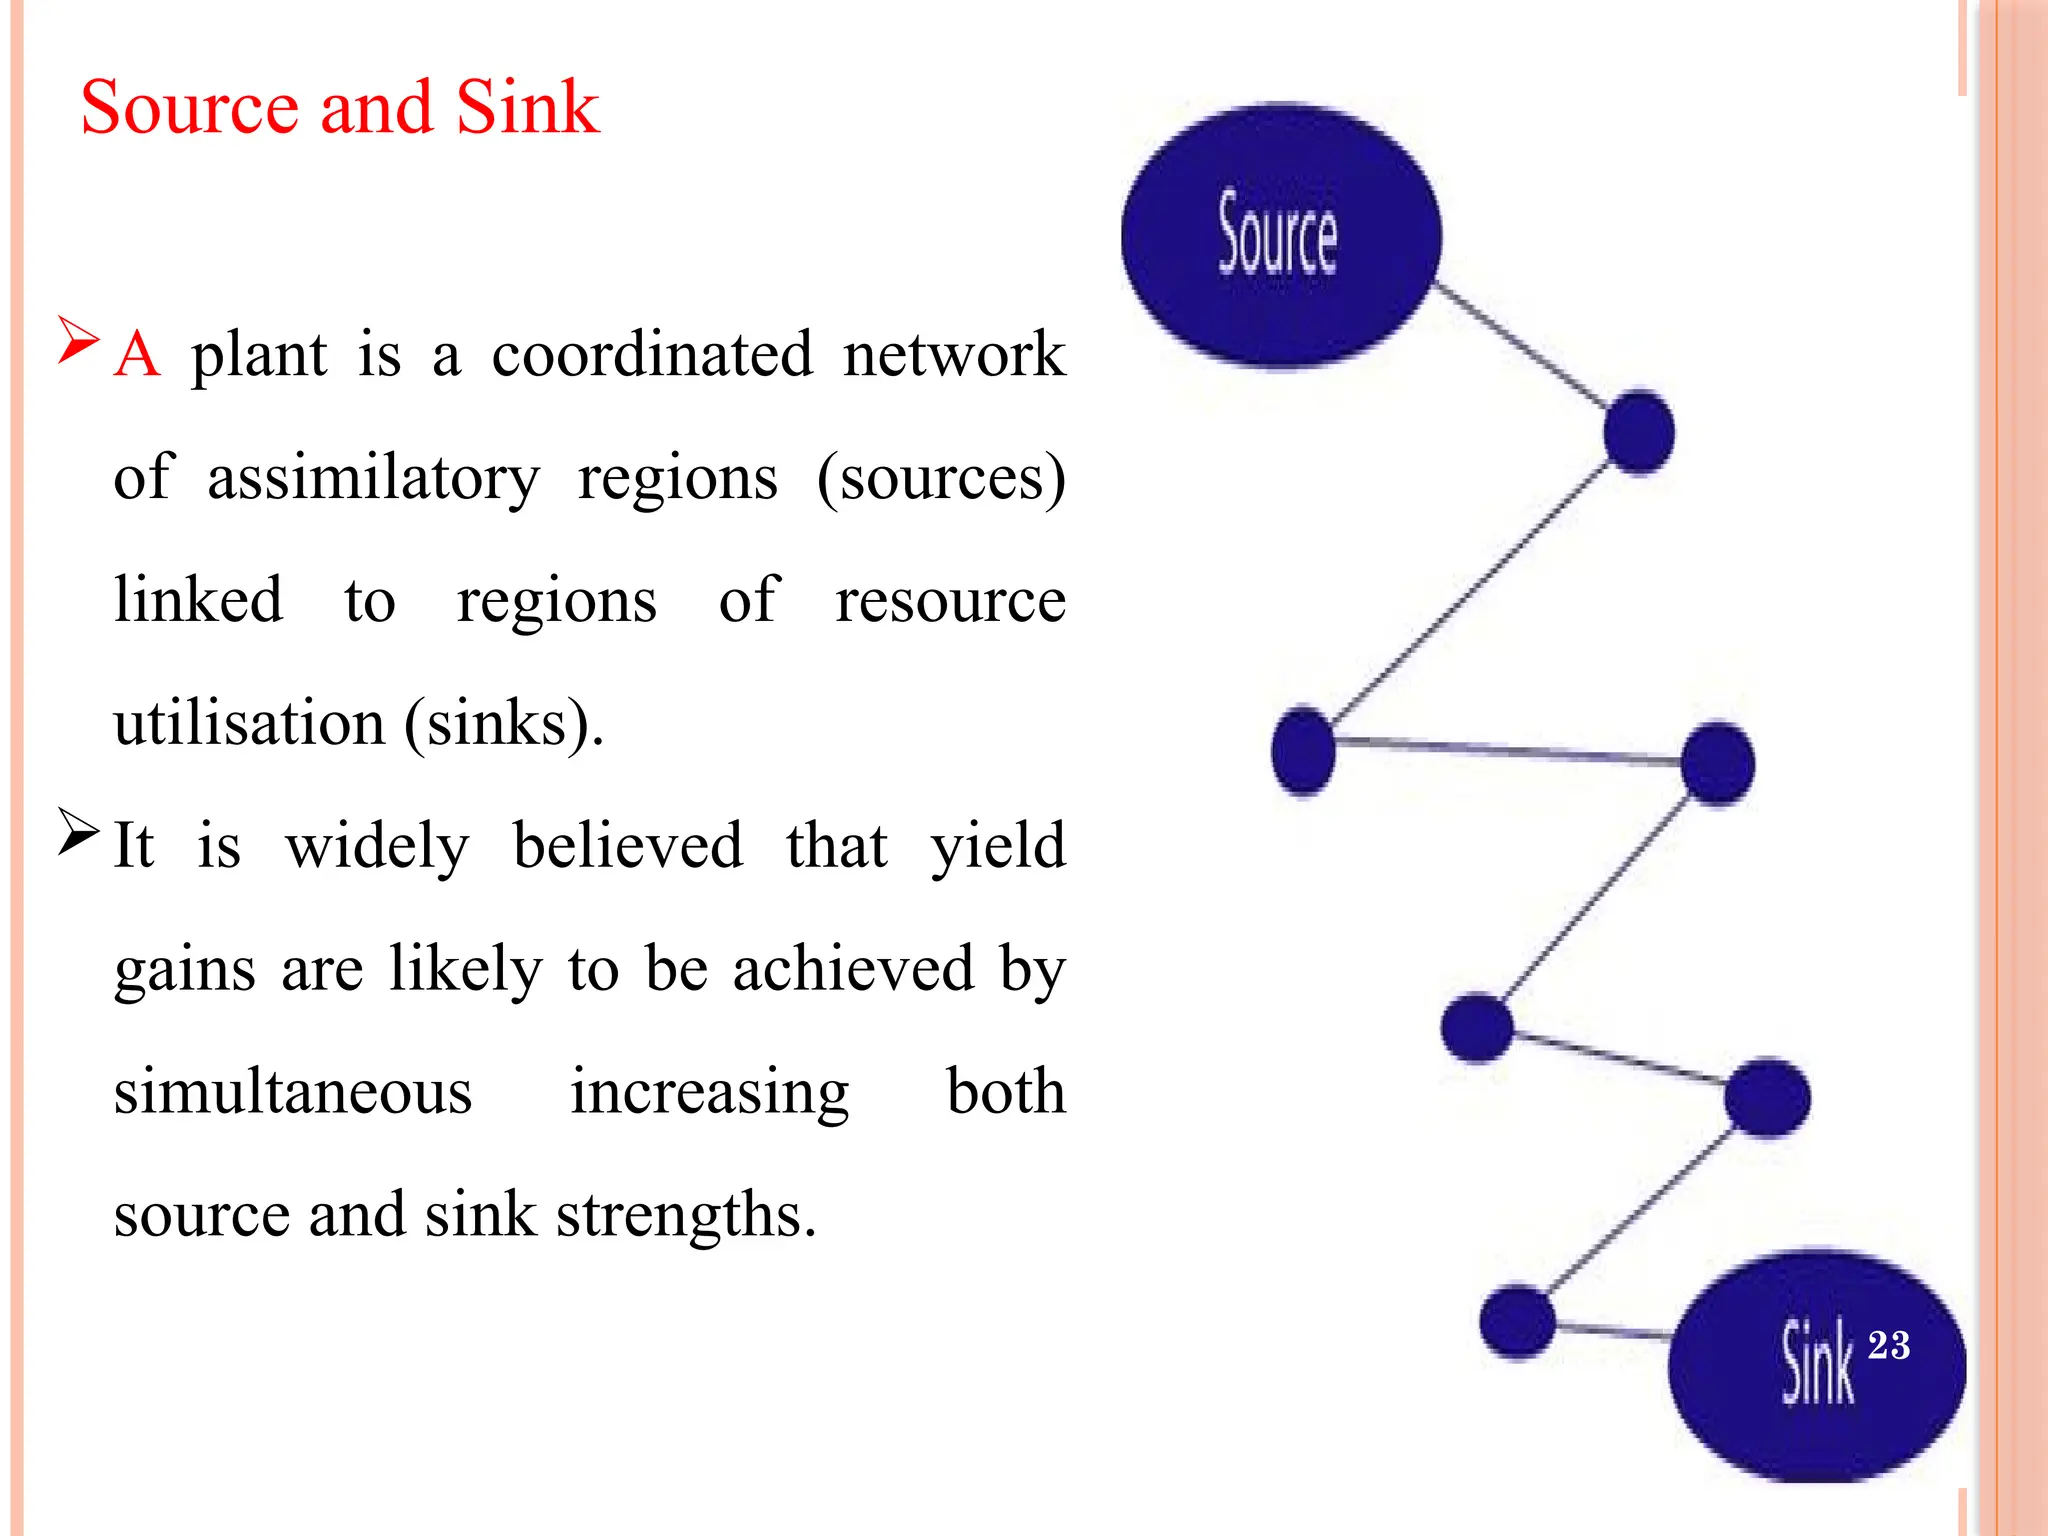
Source and Sink
Aplant is a coordinated network
of assimilatory regions (sources)
linked to regions of resource
utilisation (sinks).
It is widely believed that yield
gains are likely to be achieved by
simultaneous increasing both
source and sink strengths.
23
24.
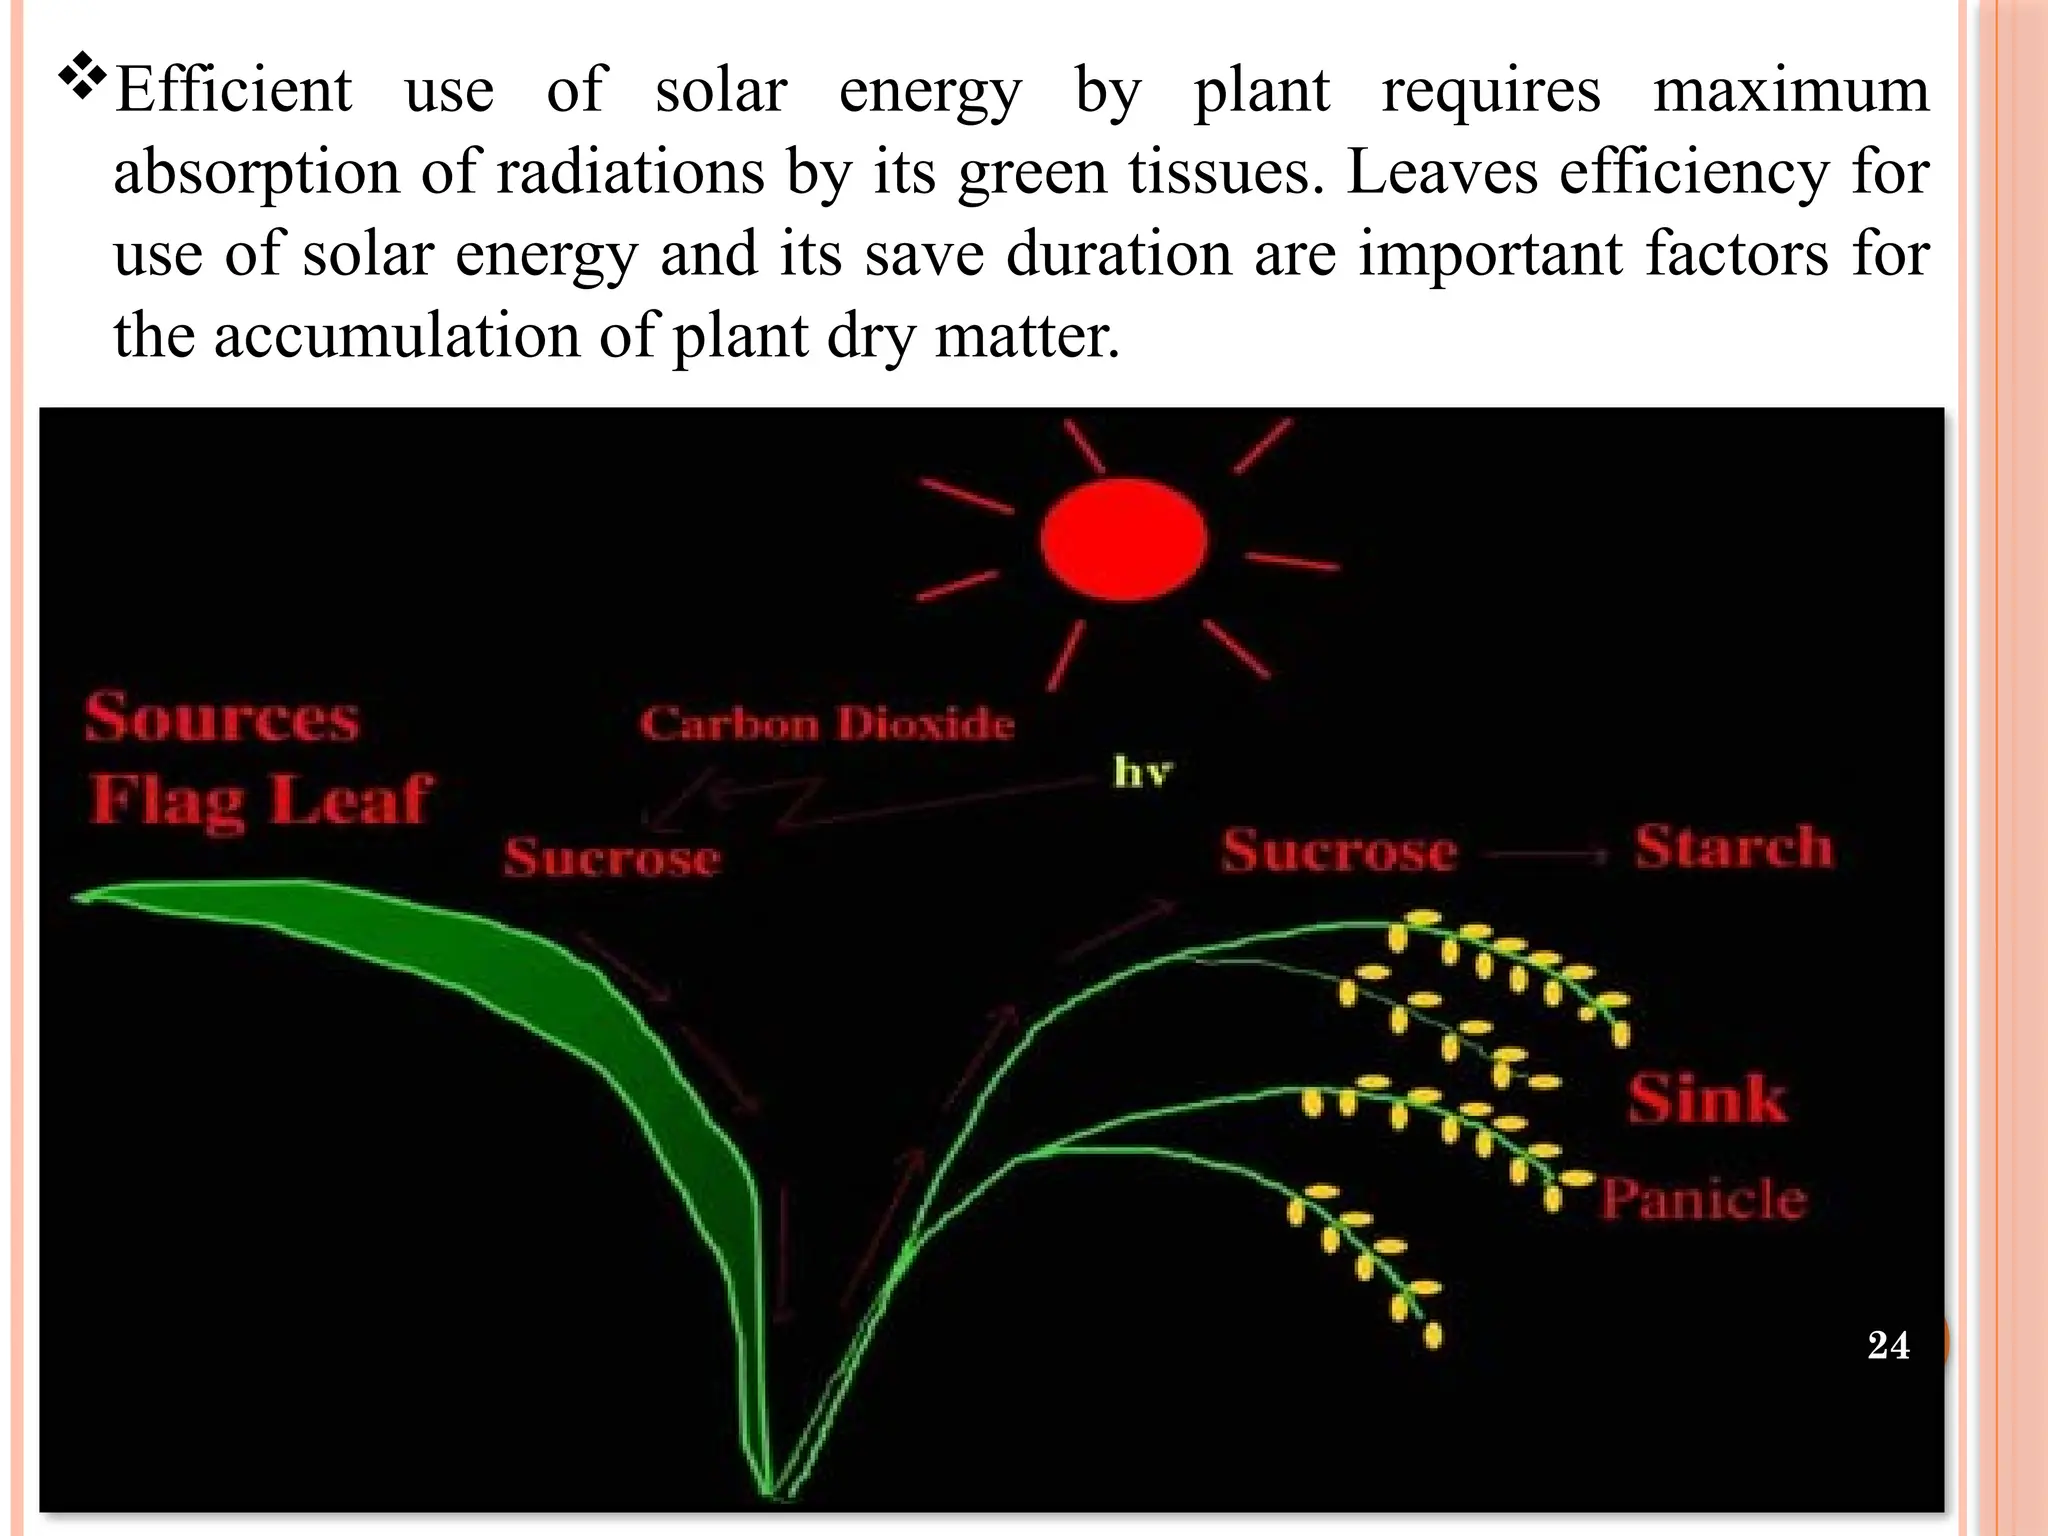
Efficient use ofsolar energy by plant requires maximum
absorption of radiations by its green tissues. Leaves efficiency for
use of solar energy and its save duration are important factors for
the accumulation of plant dry matter.
24
25.
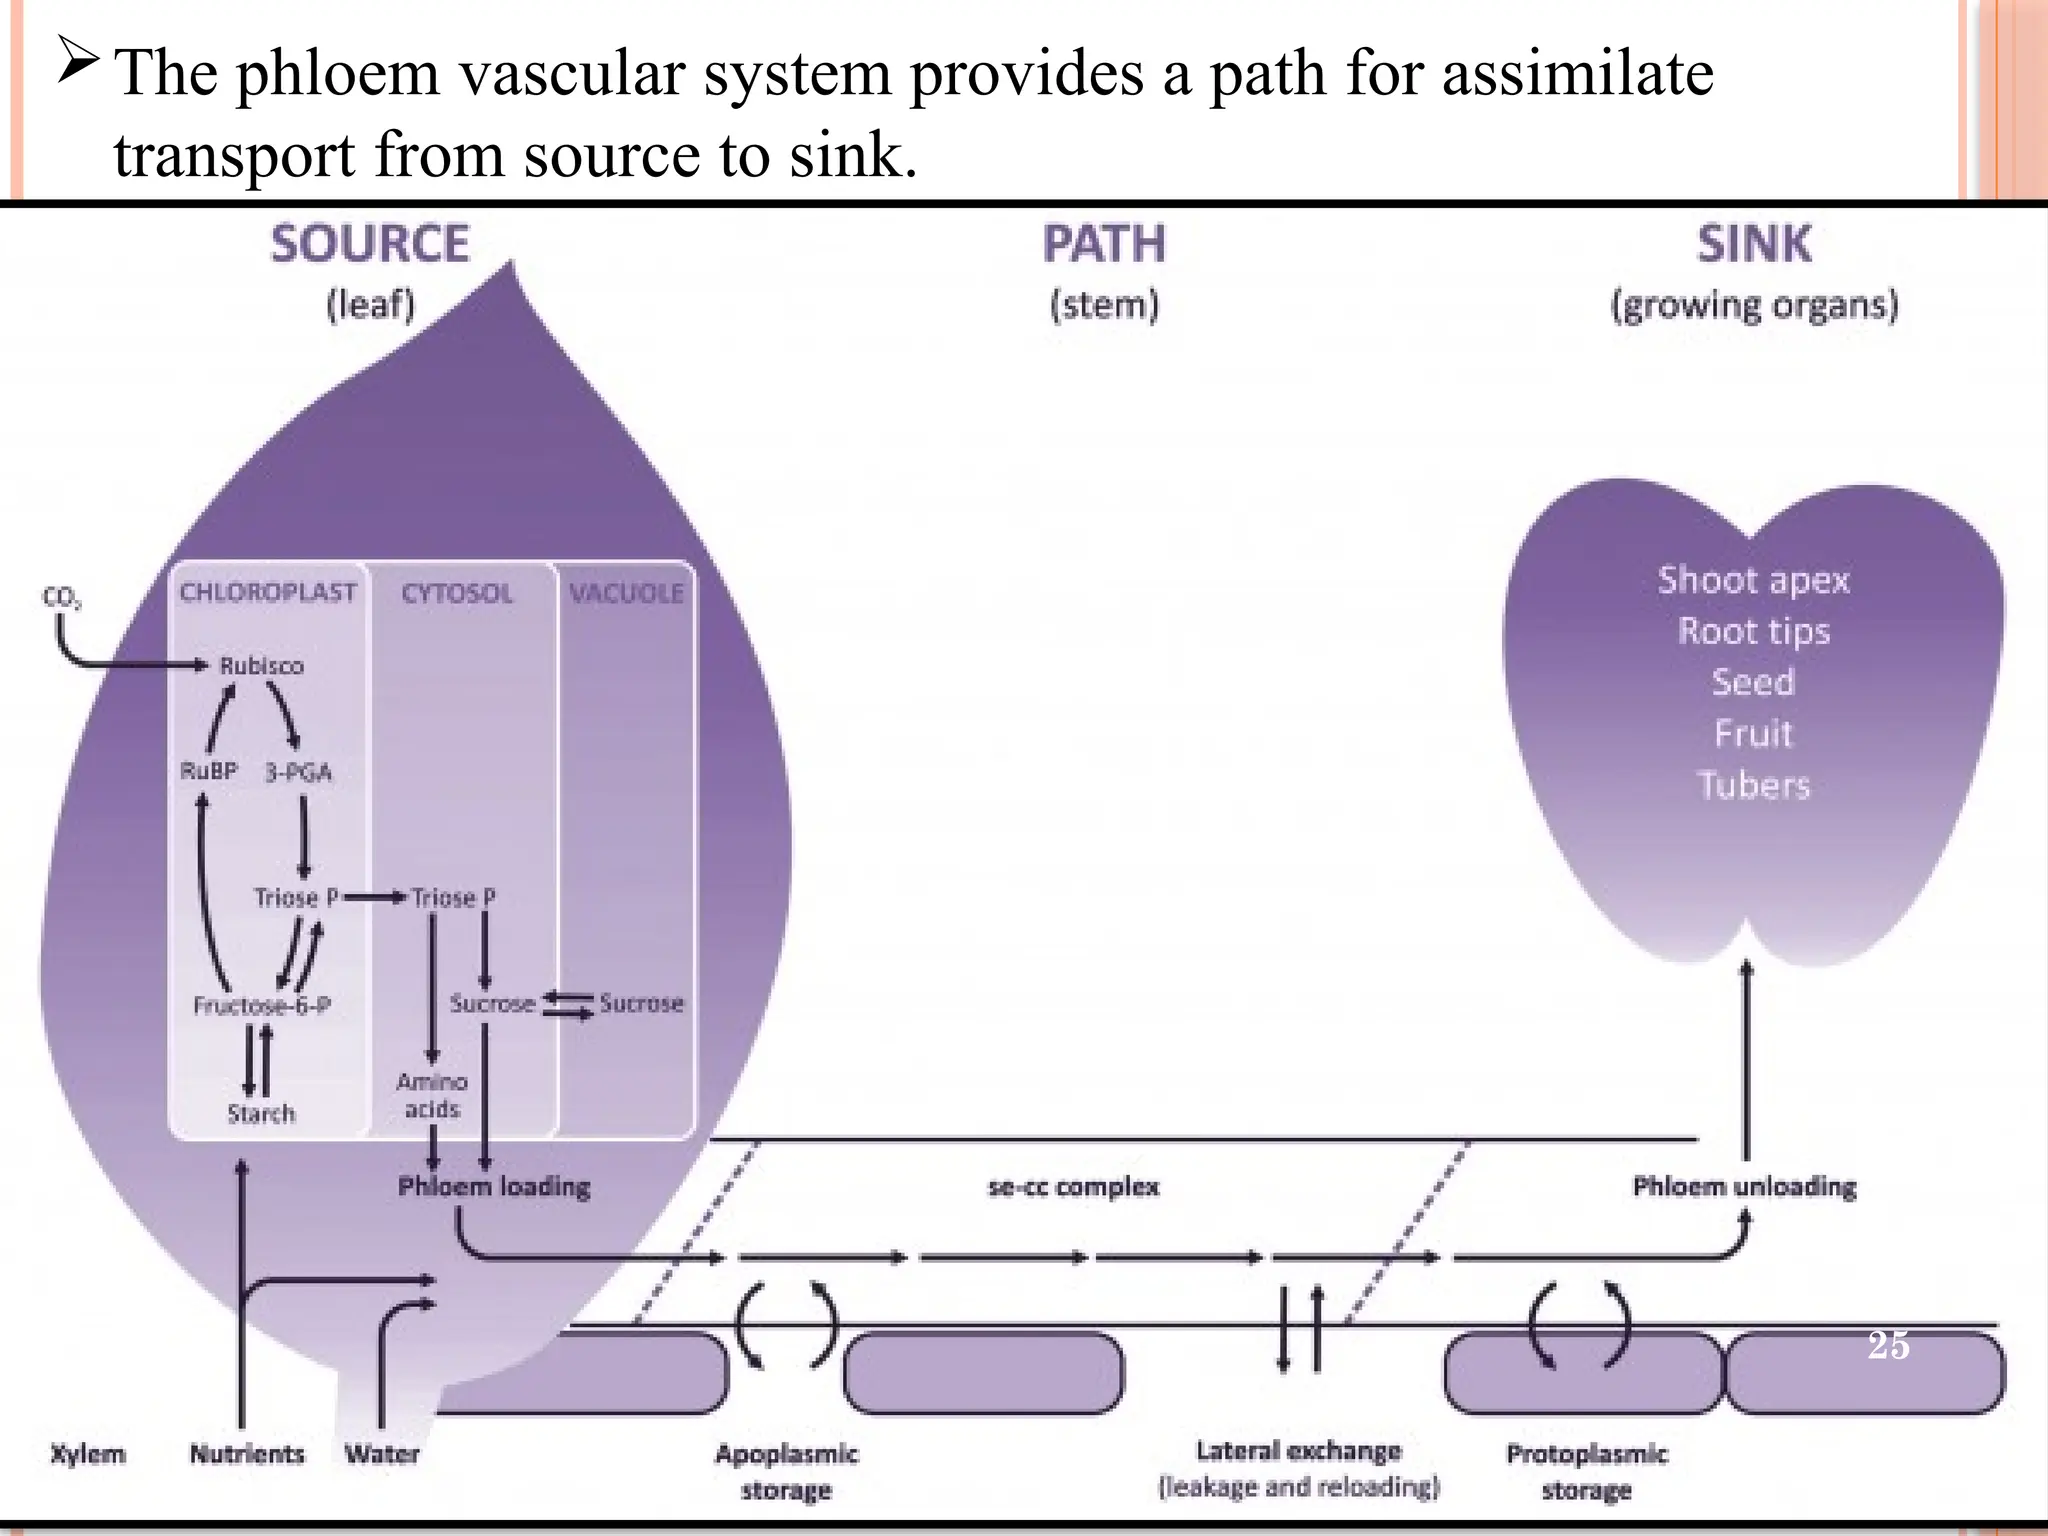
The phloem vascularsystem provides a path for assimilate
transport from source to sink.
25
26.
The mobilization ofphotosynthetic materials from source to sink is
related to production capacity of photosynthetic matter on the one
hand and consumption capacity of photosynthetic matter on the
other hand.
The inequality between these two factors leads to decrease in yield.
In other words, a suitable balance between sink and source is an
important factor to have a good yield.
While most experiments indicates that yield is primarily limited by
growth factors prior to anthesis.
Reproductive stages of development, from initiation of floral
development to anthesis, are pivotal in determining yield potential.
Cont…
26
27.
Rapid spikegrowth phase has a duration of 25 days in irrigated
spring wheat in northwest Mexico and Argentina.
During this period, final grain number is determined; a major
factor determining subsequent partitioning of assimilates to yield
as well as heavily influencing assimilation rate of photosynthesis
apparatus during grain filling.
This is associated with sensitivities to photoperiod, vernalization,
and developmental rate independent of these stimuli (i.e.,
earliness per se).
Cont…
27
28.
Slafer etal., 1996 suggested that possibility exists of improving final
grain number and yield potential by manipulating genes associated
with sensitivity to photoperiod and vernalization as well as earliness
per se.
Recently, duration of rapid spike growth has been sucessfully
manipulated using photoperiod , revealing a strong relationship
between its duration and no. of spike/florets (Miralles and Richards,
1999).
By maintaining plants at a relatively short photoperiod during this
growth phase, number of days from terminal spikelet to heading was
increased from 50 to 70 days with 13- and 19- hrs
photoperiods .While the number of fertile florets per spike increased
Cont…
28
29.
SOURCE AND SINK:SEED SIZE
Genetic progress in yield potential is strongly associated with increase in
grain number while weight per gram has generally declined.
Nonetheless, some studies have shown increased kernel weight has
contributed to improved yield potential in irrigated wheat.
Simplistically it can be argued that this inverse relationship is a necessary
trade off when more grains are competing, for limited assimilates during,
grain filling.
Studies have shown that the ways for increasing photosynthesis is sink
demand. The sink demand will be increased when there are more seeds, thus
the leaves will have more photosynthesis.
So increasing seed number may increase the sink demand and yield.
29
30.
However, studiesthat have examined the relationship between
kernel sizes and number at different spike positions using lines
from different ears conclude that size of kernels at low potential
weight spikelet positions are independent of kernel number or year
of release.
It is suggested that grain weight is co-limited by both source and
sinks, such that grain weight potential would be most likely
determined during spike growth resulting in different potential
sizes at different spike positions.
Realization of potential would he determined by assimilate
availability during grain filling.
Cont…
30
31.
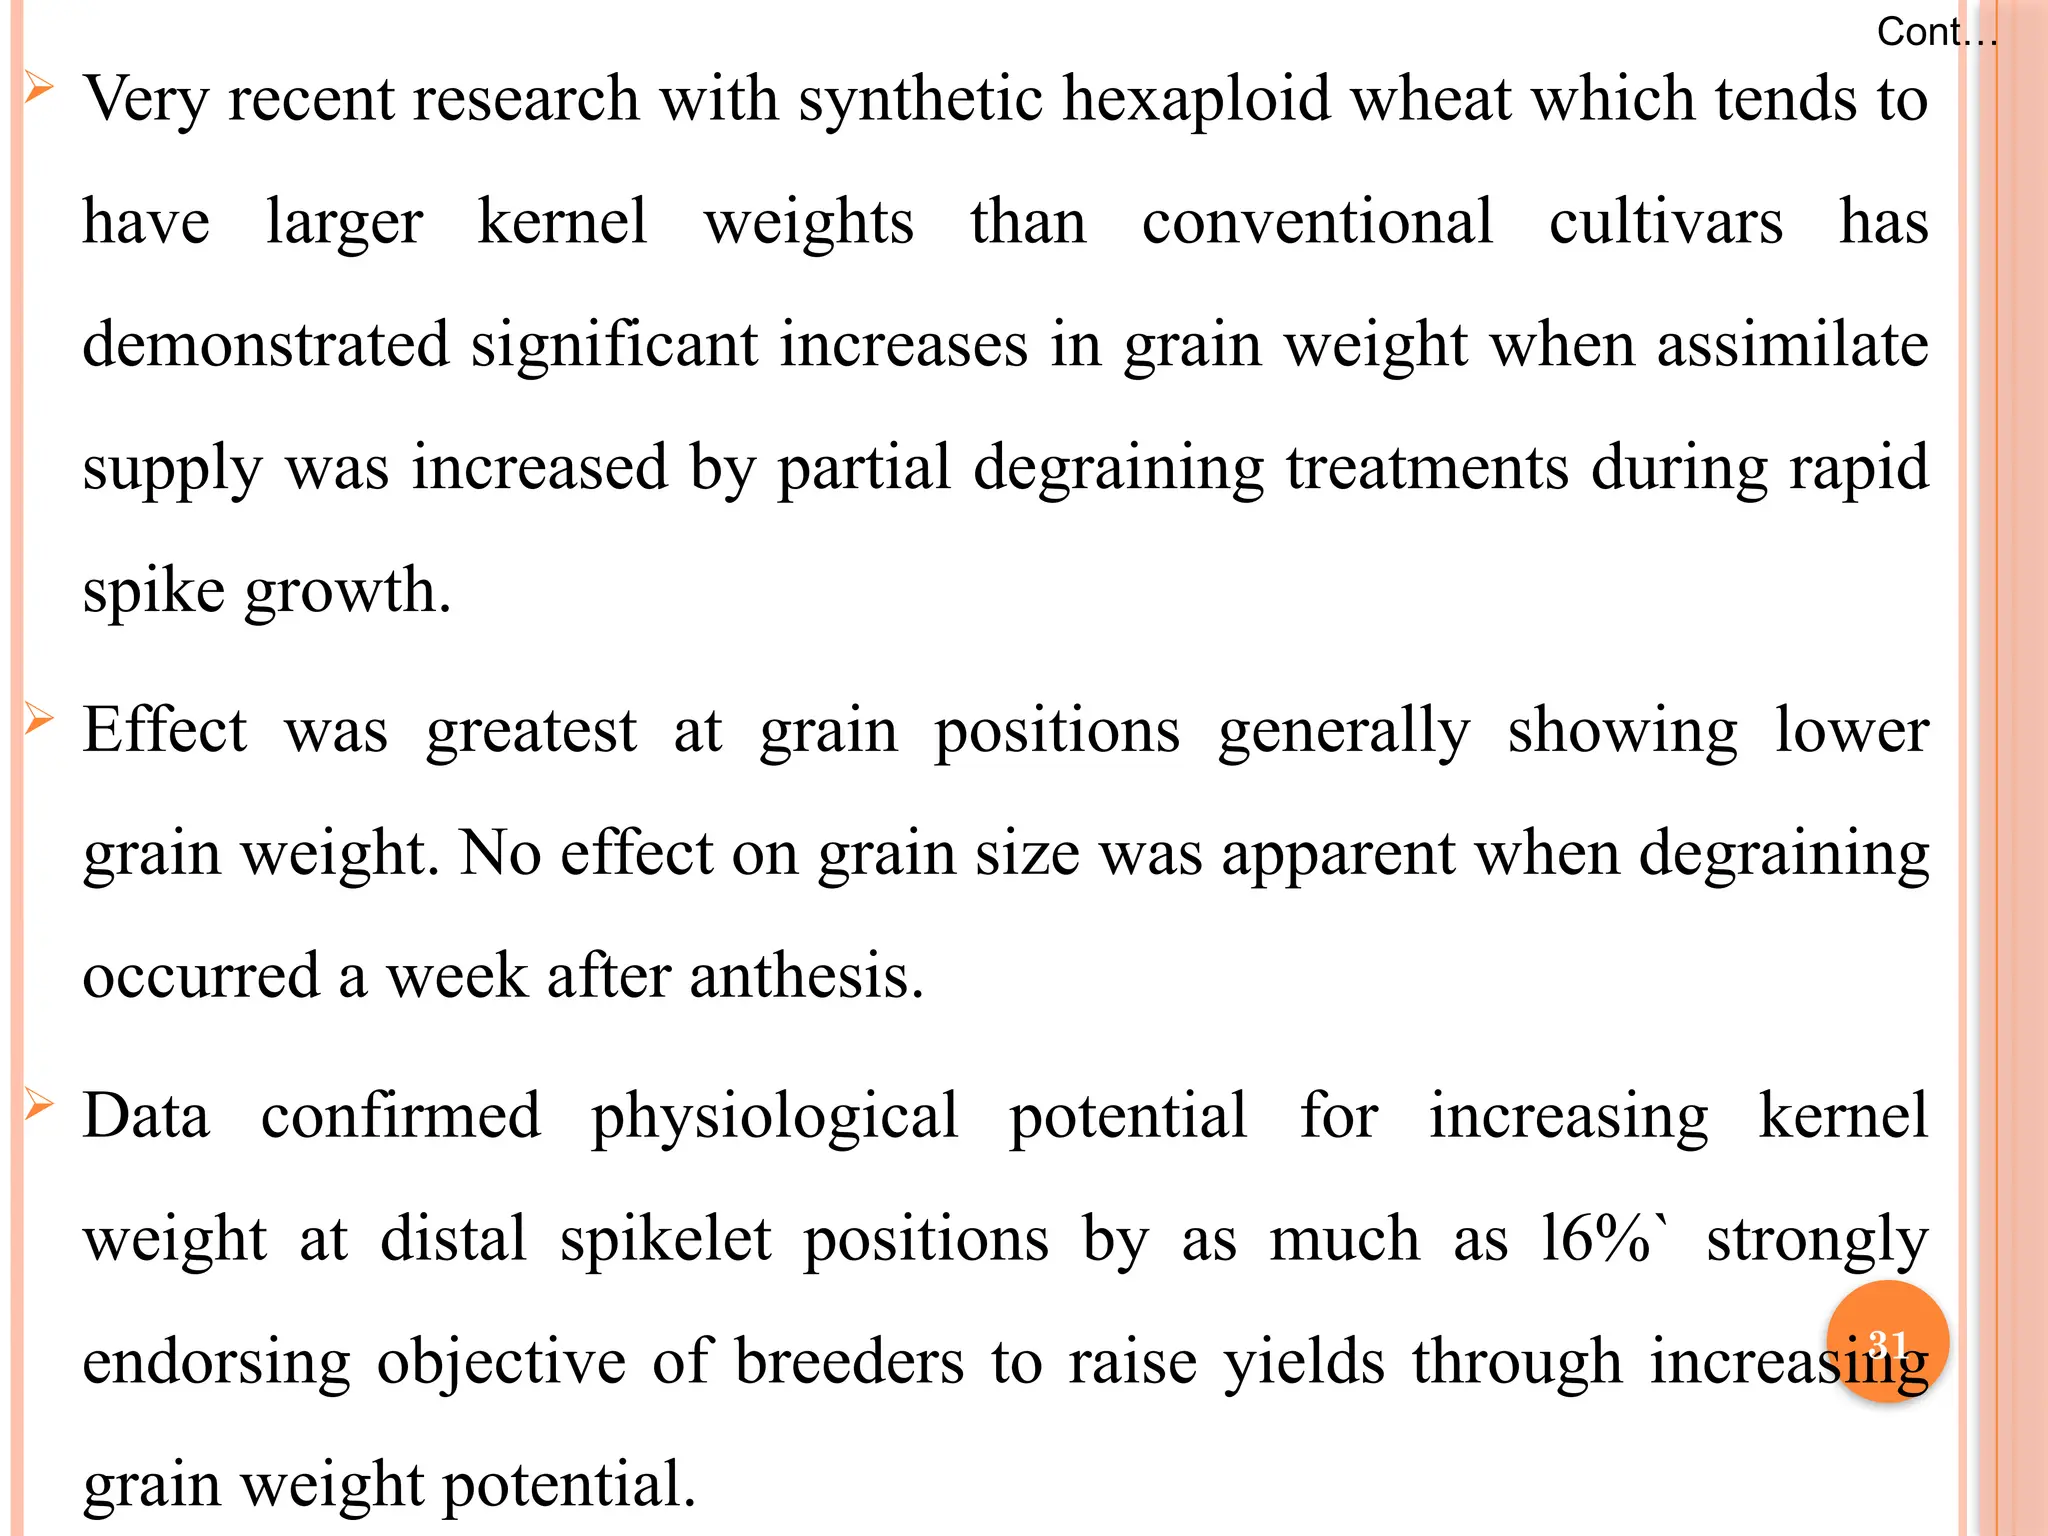
Very recentresearch with synthetic hexaploid wheat which tends to
have larger kernel weights than conventional cultivars has
demonstrated significant increases in grain weight when assimilate
supply was increased by partial degraining treatments during rapid
spike growth.
Effect was greatest at grain positions generally showing lower
grain weight. No effect on grain size was apparent when degraining
occurred a week after anthesis.
Data confirmed physiological potential for increasing kernel
weight at distal spikelet positions by as much as l6%` strongly
endorsing objective of breeders to raise yields through increasing
grain weight potential.
Cont…
31
32.
On basisof these data. it is proposed that extending duration
of rapid spike-growth phase may increase yield potential not
only by increasing grain weight potential through extending
window of opportunity for individual kernel development
(Calderini and Reynolds,2000).
Cont…
32
33.
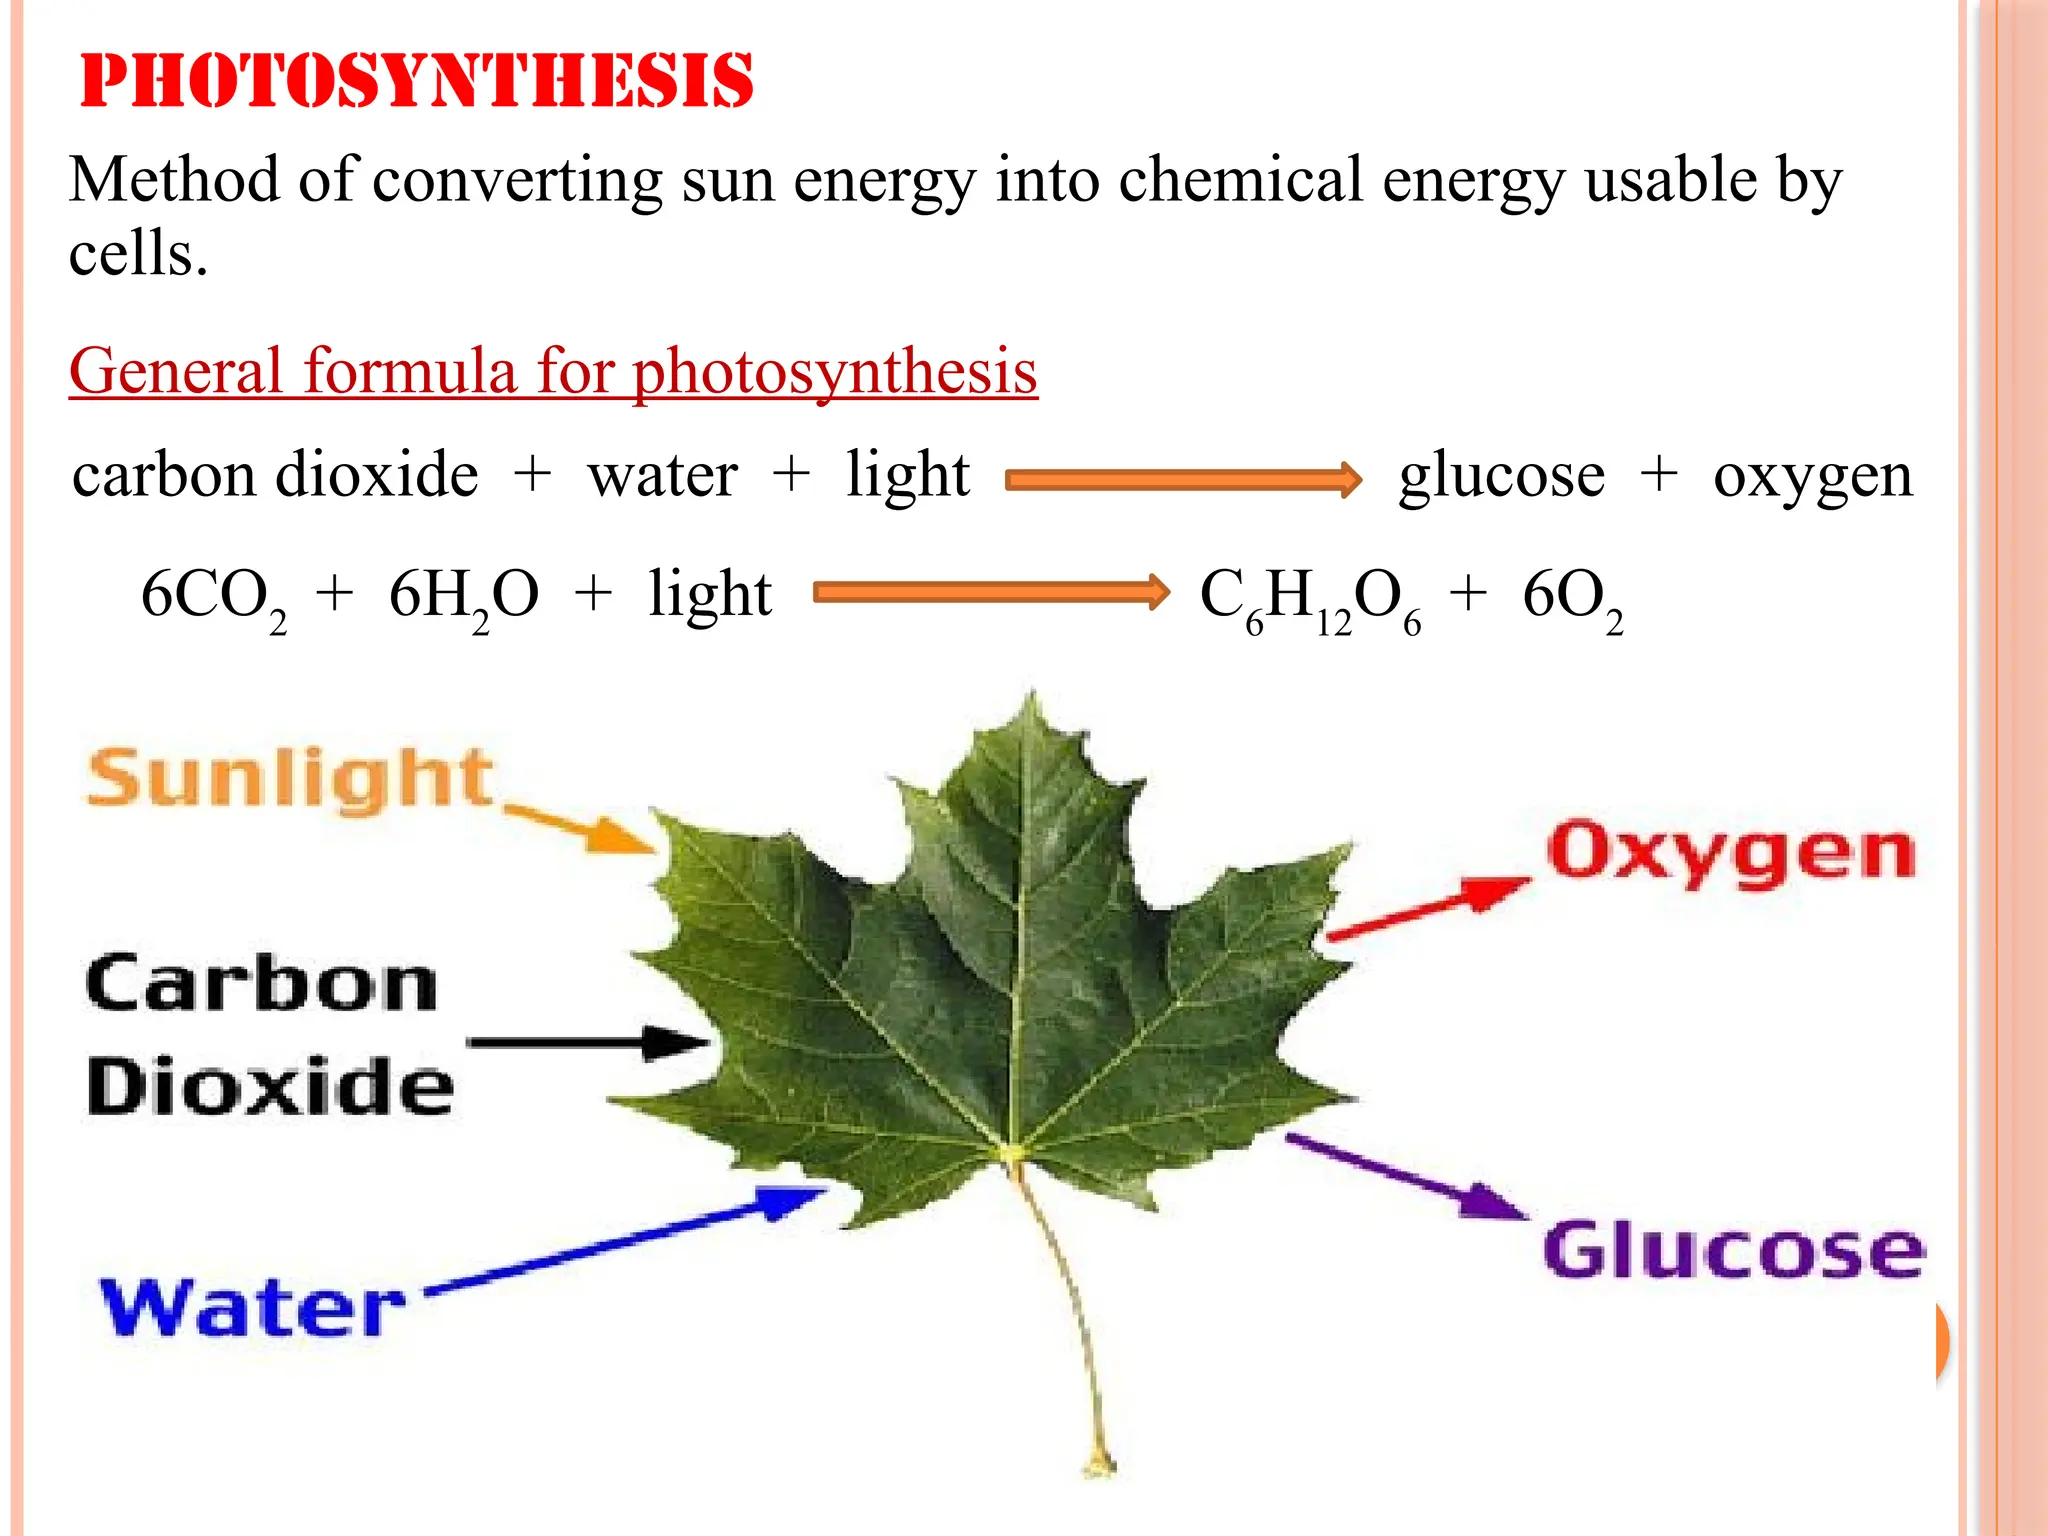
General formula forphotosynthesis
carbon dioxide + water + light glucose + oxygen
6CO2
+ 6H2
O + light C6
H12
O6
+ 6O2
Photosynthesis
Method of converting sun energy into chemical energy usable by
cells.
33
34.
PHOTOSYNTHETIC PRODUCTION
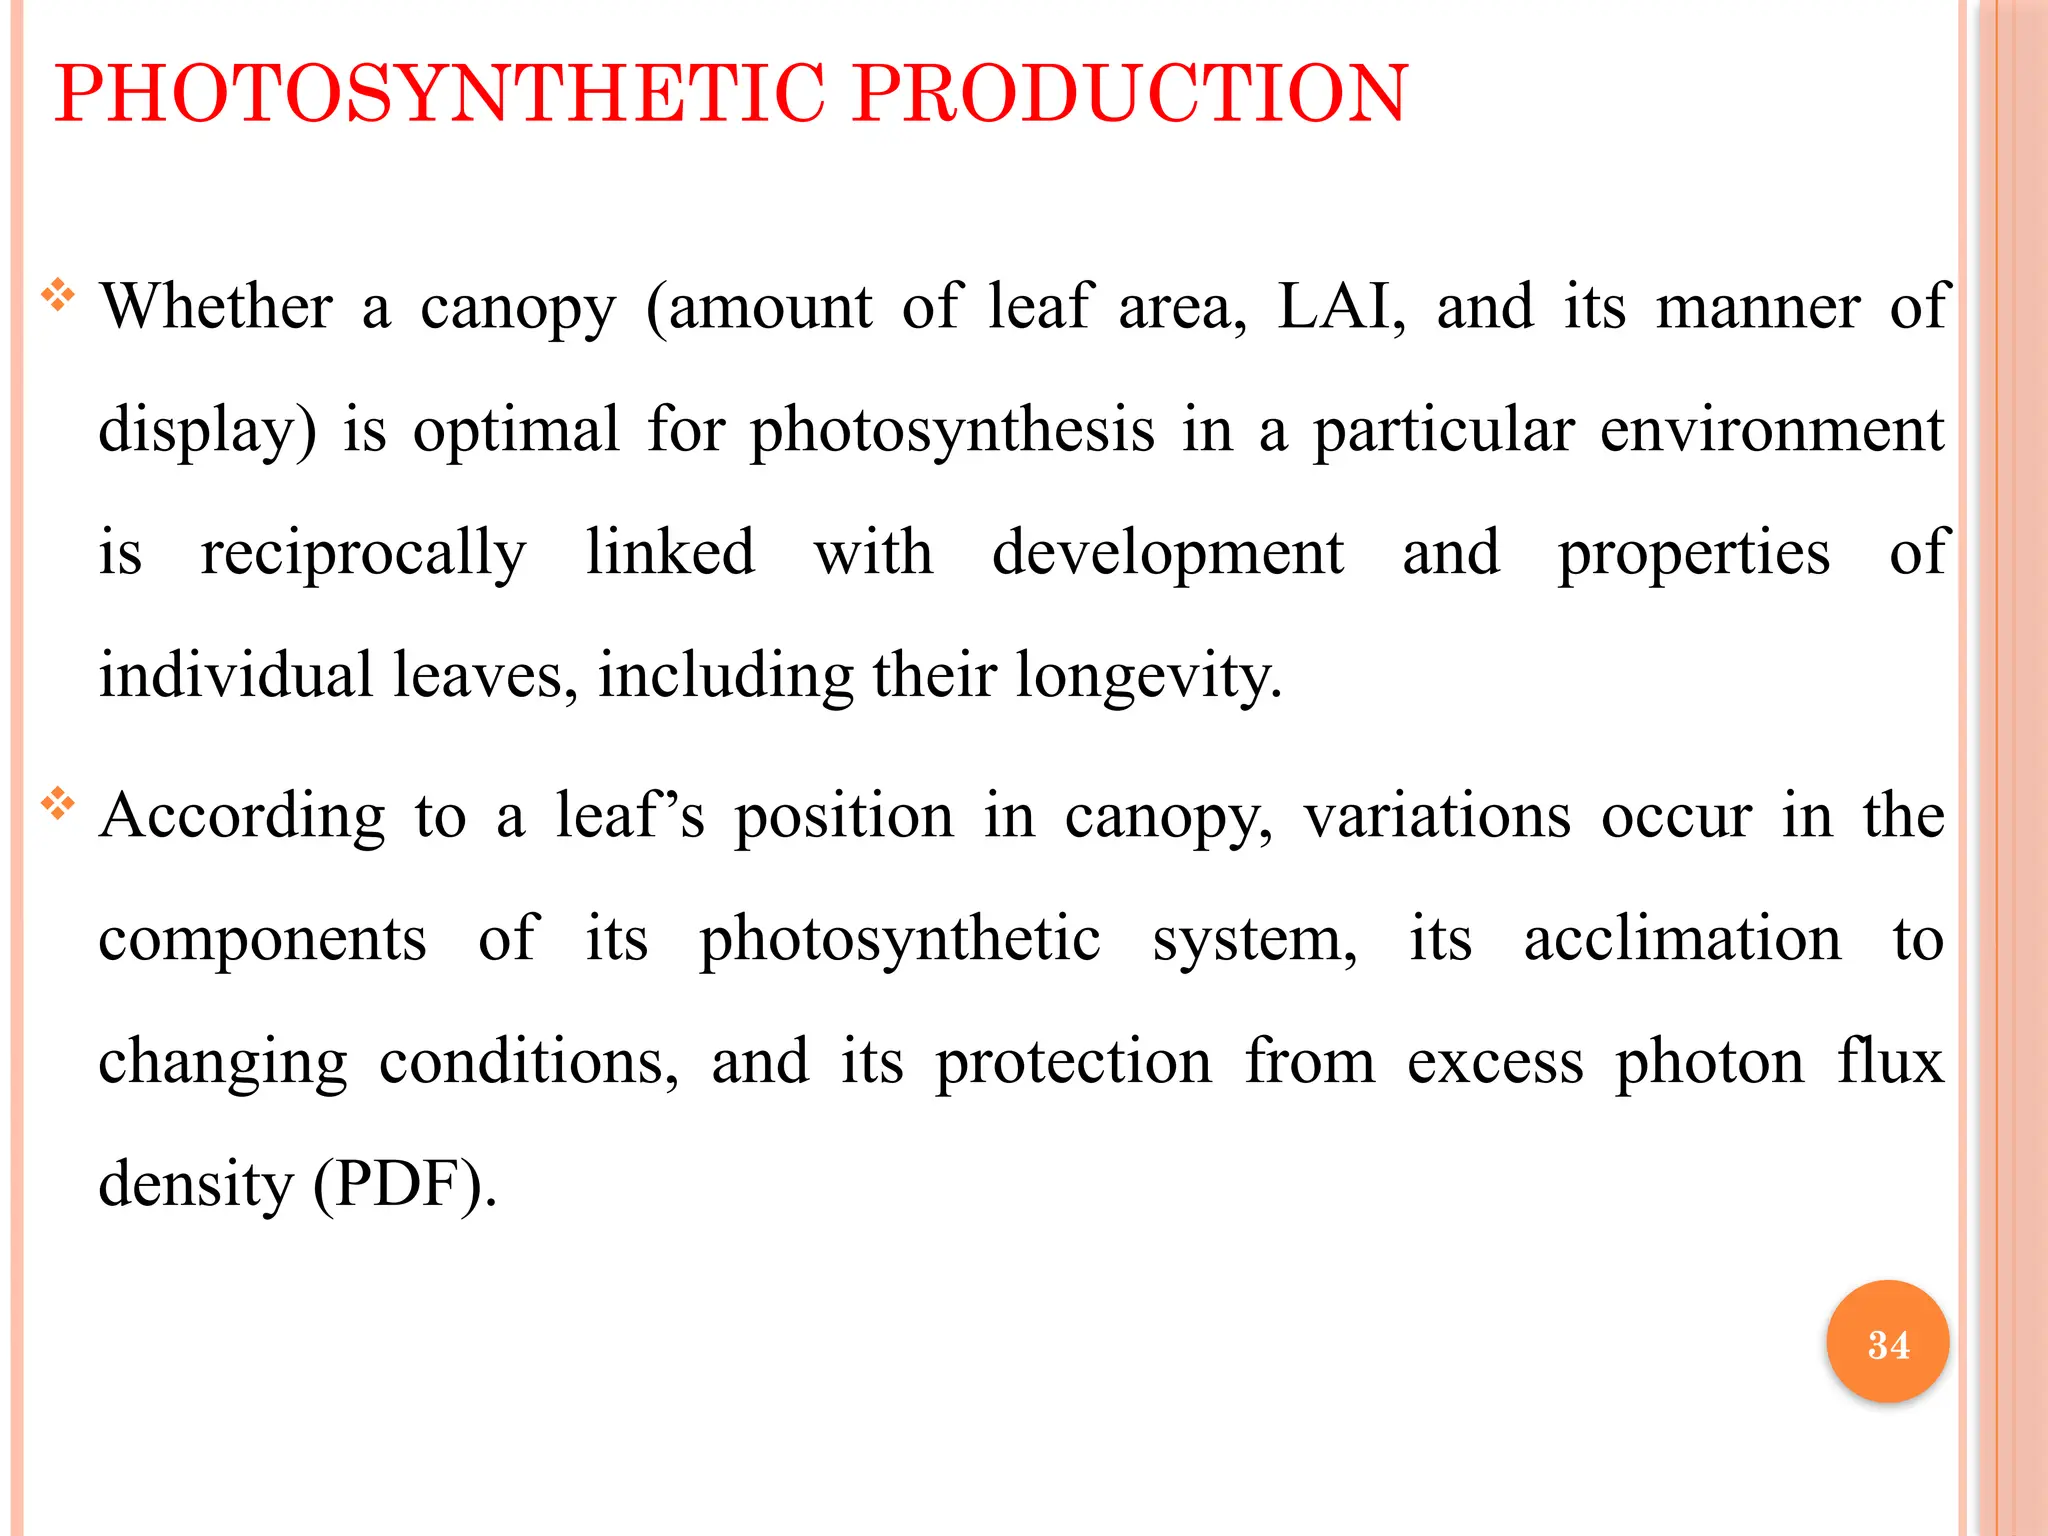
Whethera canopy (amount of leaf area, LAI, and its manner of
display) is optimal for photosynthesis in a particular environment
is reciprocally linked with development and properties of
individual leaves, including their longevity.
According to a leaf’s position in canopy, variations occur in the
components of its photosynthetic system, its acclimation to
changing conditions, and its protection from excess photon flux
density (PDF).
34
35.
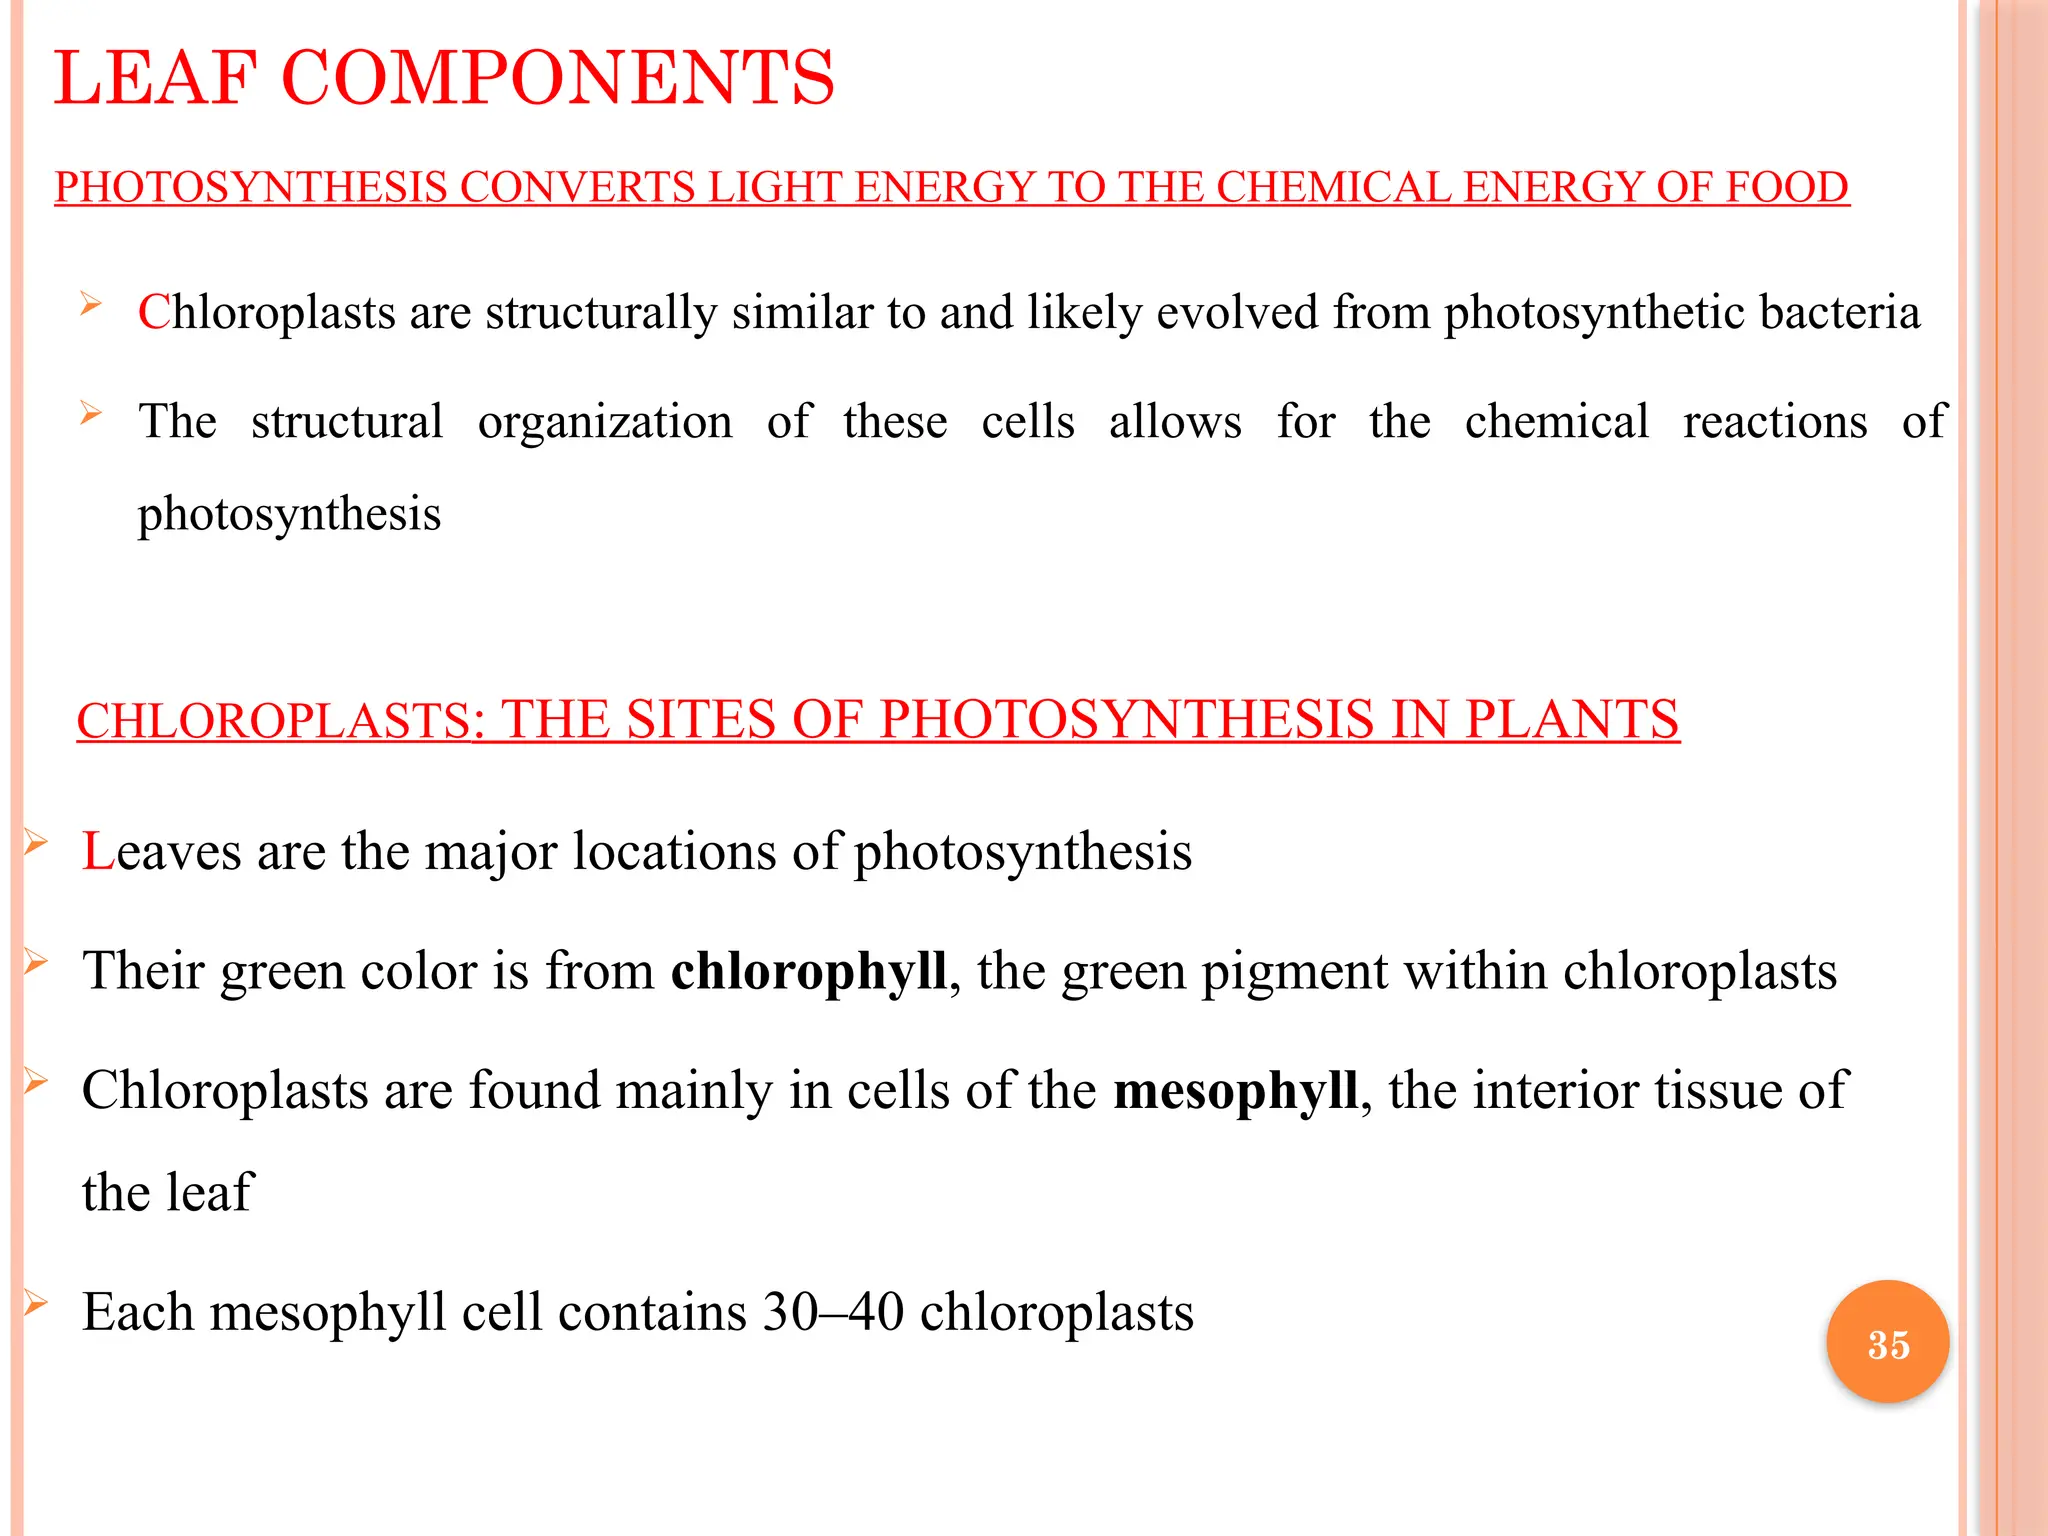
PHOTOSYNTHESIS CONVERTS LIGHTENERGY TO THE CHEMICAL ENERGY OF FOOD
Chloroplasts are structurally similar to and likely evolved from photosynthetic bacteria
The structural organization of these cells allows for the chemical reactions of
photosynthesis
LEAF COMPONENTS
CHLOROPLASTS: THE SITES OF PHOTOSYNTHESIS IN PLANTS
Leaves are the major locations of photosynthesis
Their green color is from chlorophyll, the green pigment within chloroplasts
Chloroplasts are found mainly in cells of the mesophyll, the interior tissue of
the leaf
Each mesophyll cell contains 30–40 chloroplasts
35
36.
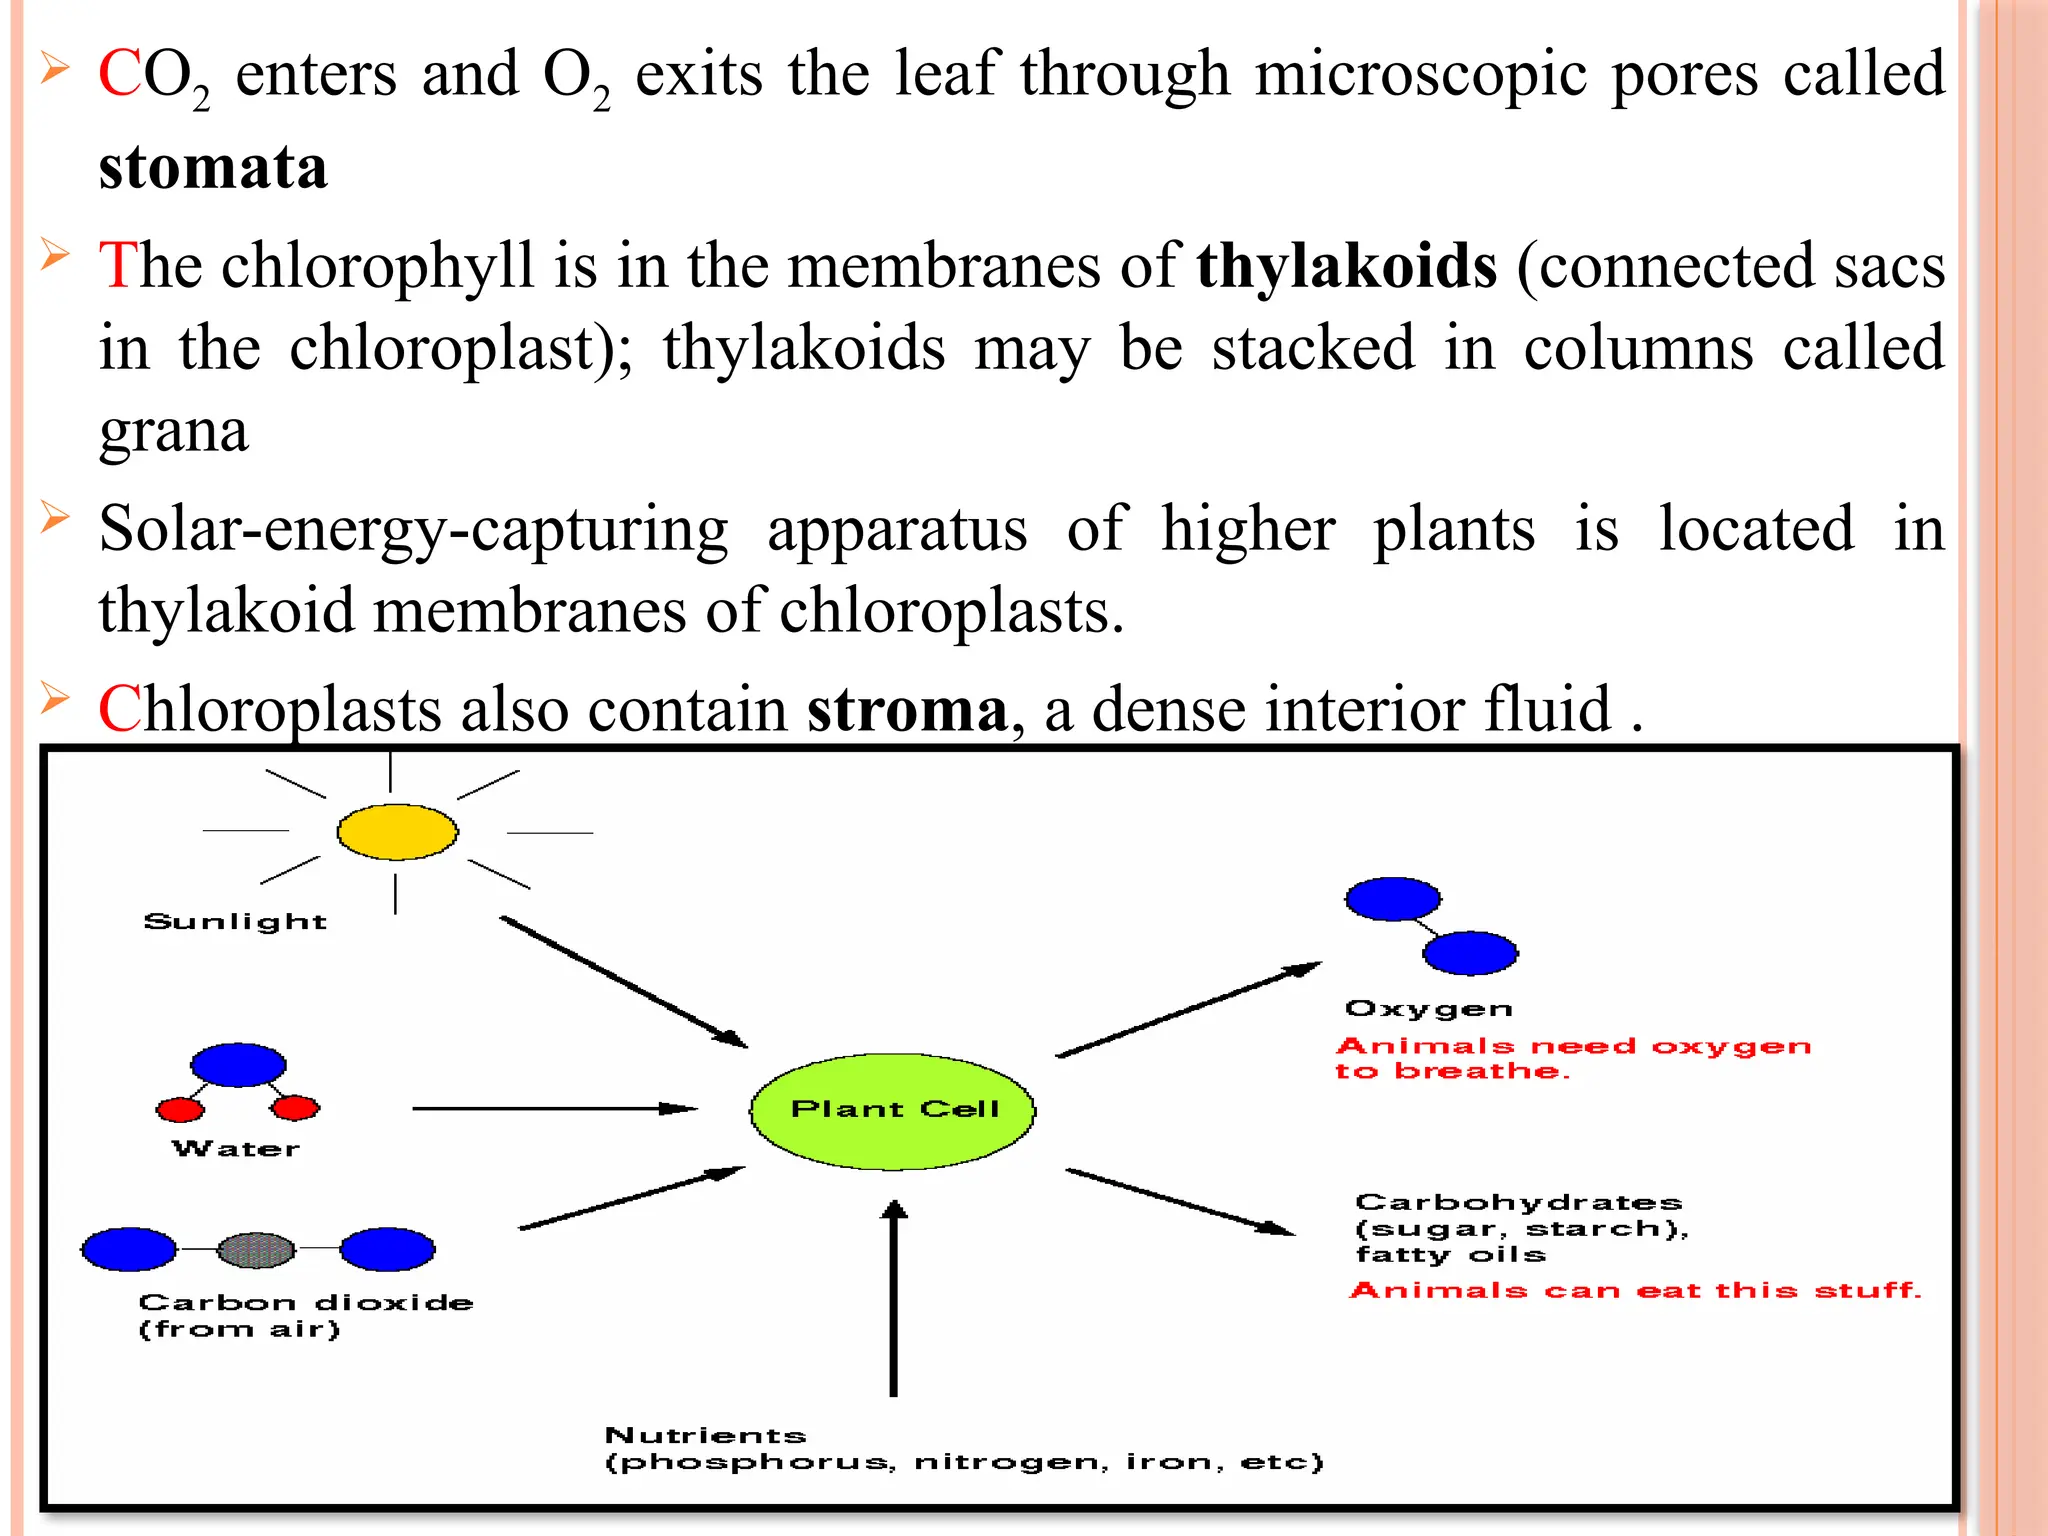
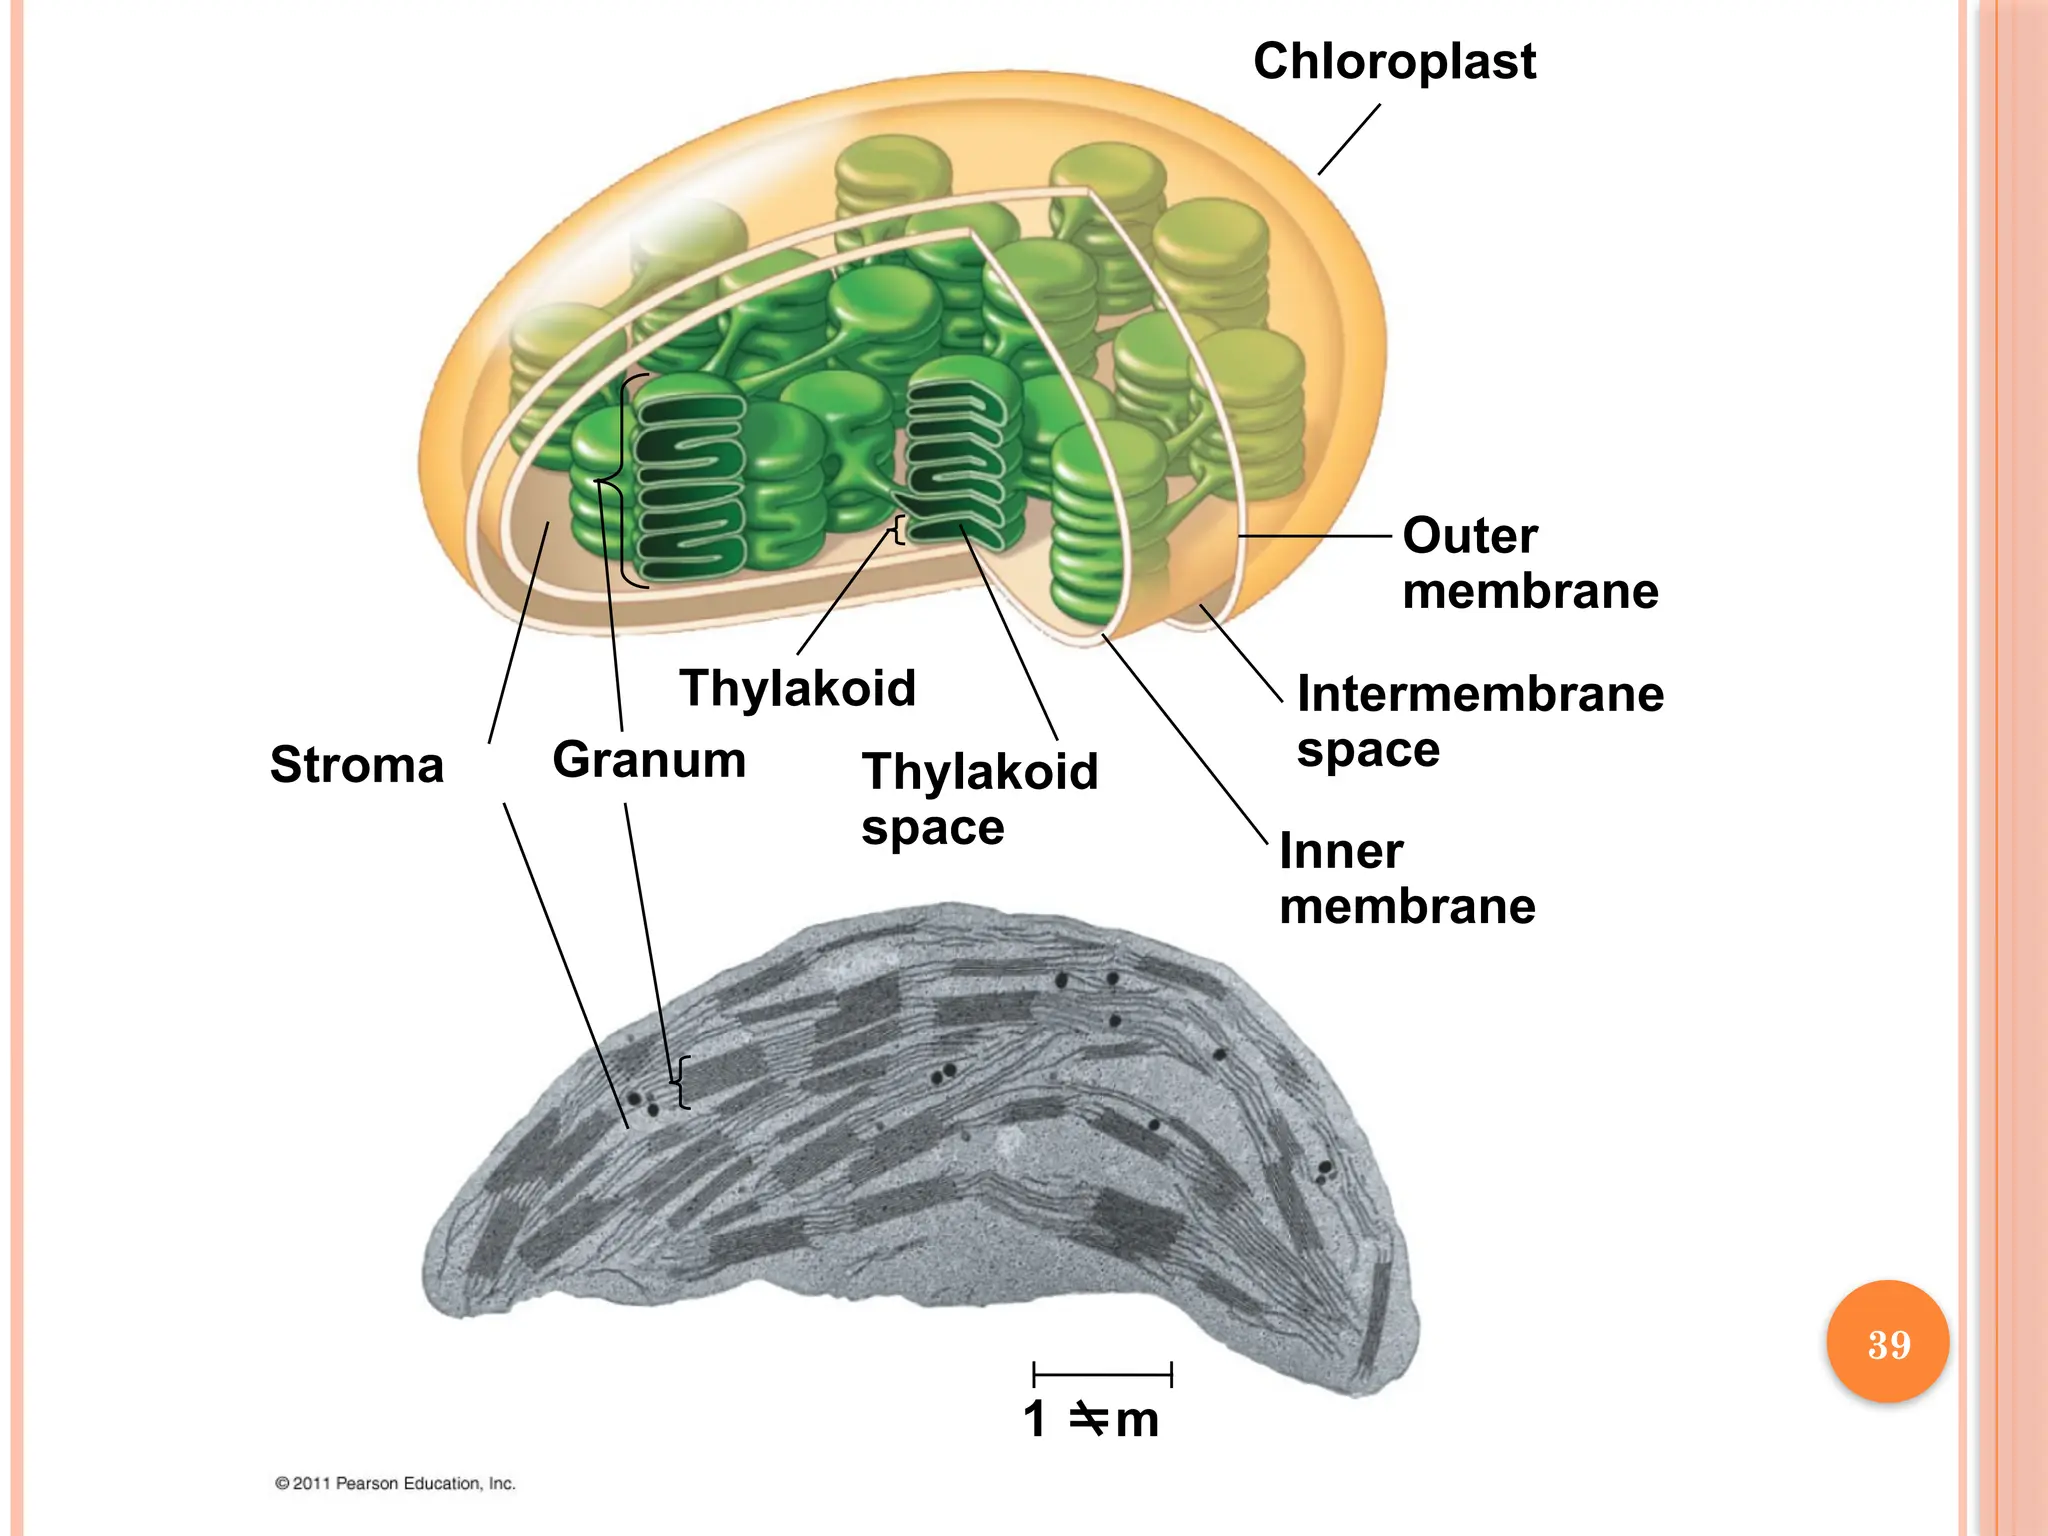
CO2 entersand O2 exits the leaf through microscopic pores called
stomata
The chlorophyll is in the membranes of thylakoids (connected sacs
in the chloroplast); thylakoids may be stacked in columns called
grana
Solar-energy-capturing apparatus of higher plants is located in
thylakoid membranes of chloroplasts.
Chloroplasts also contain stroma, a dense interior fluid .
36
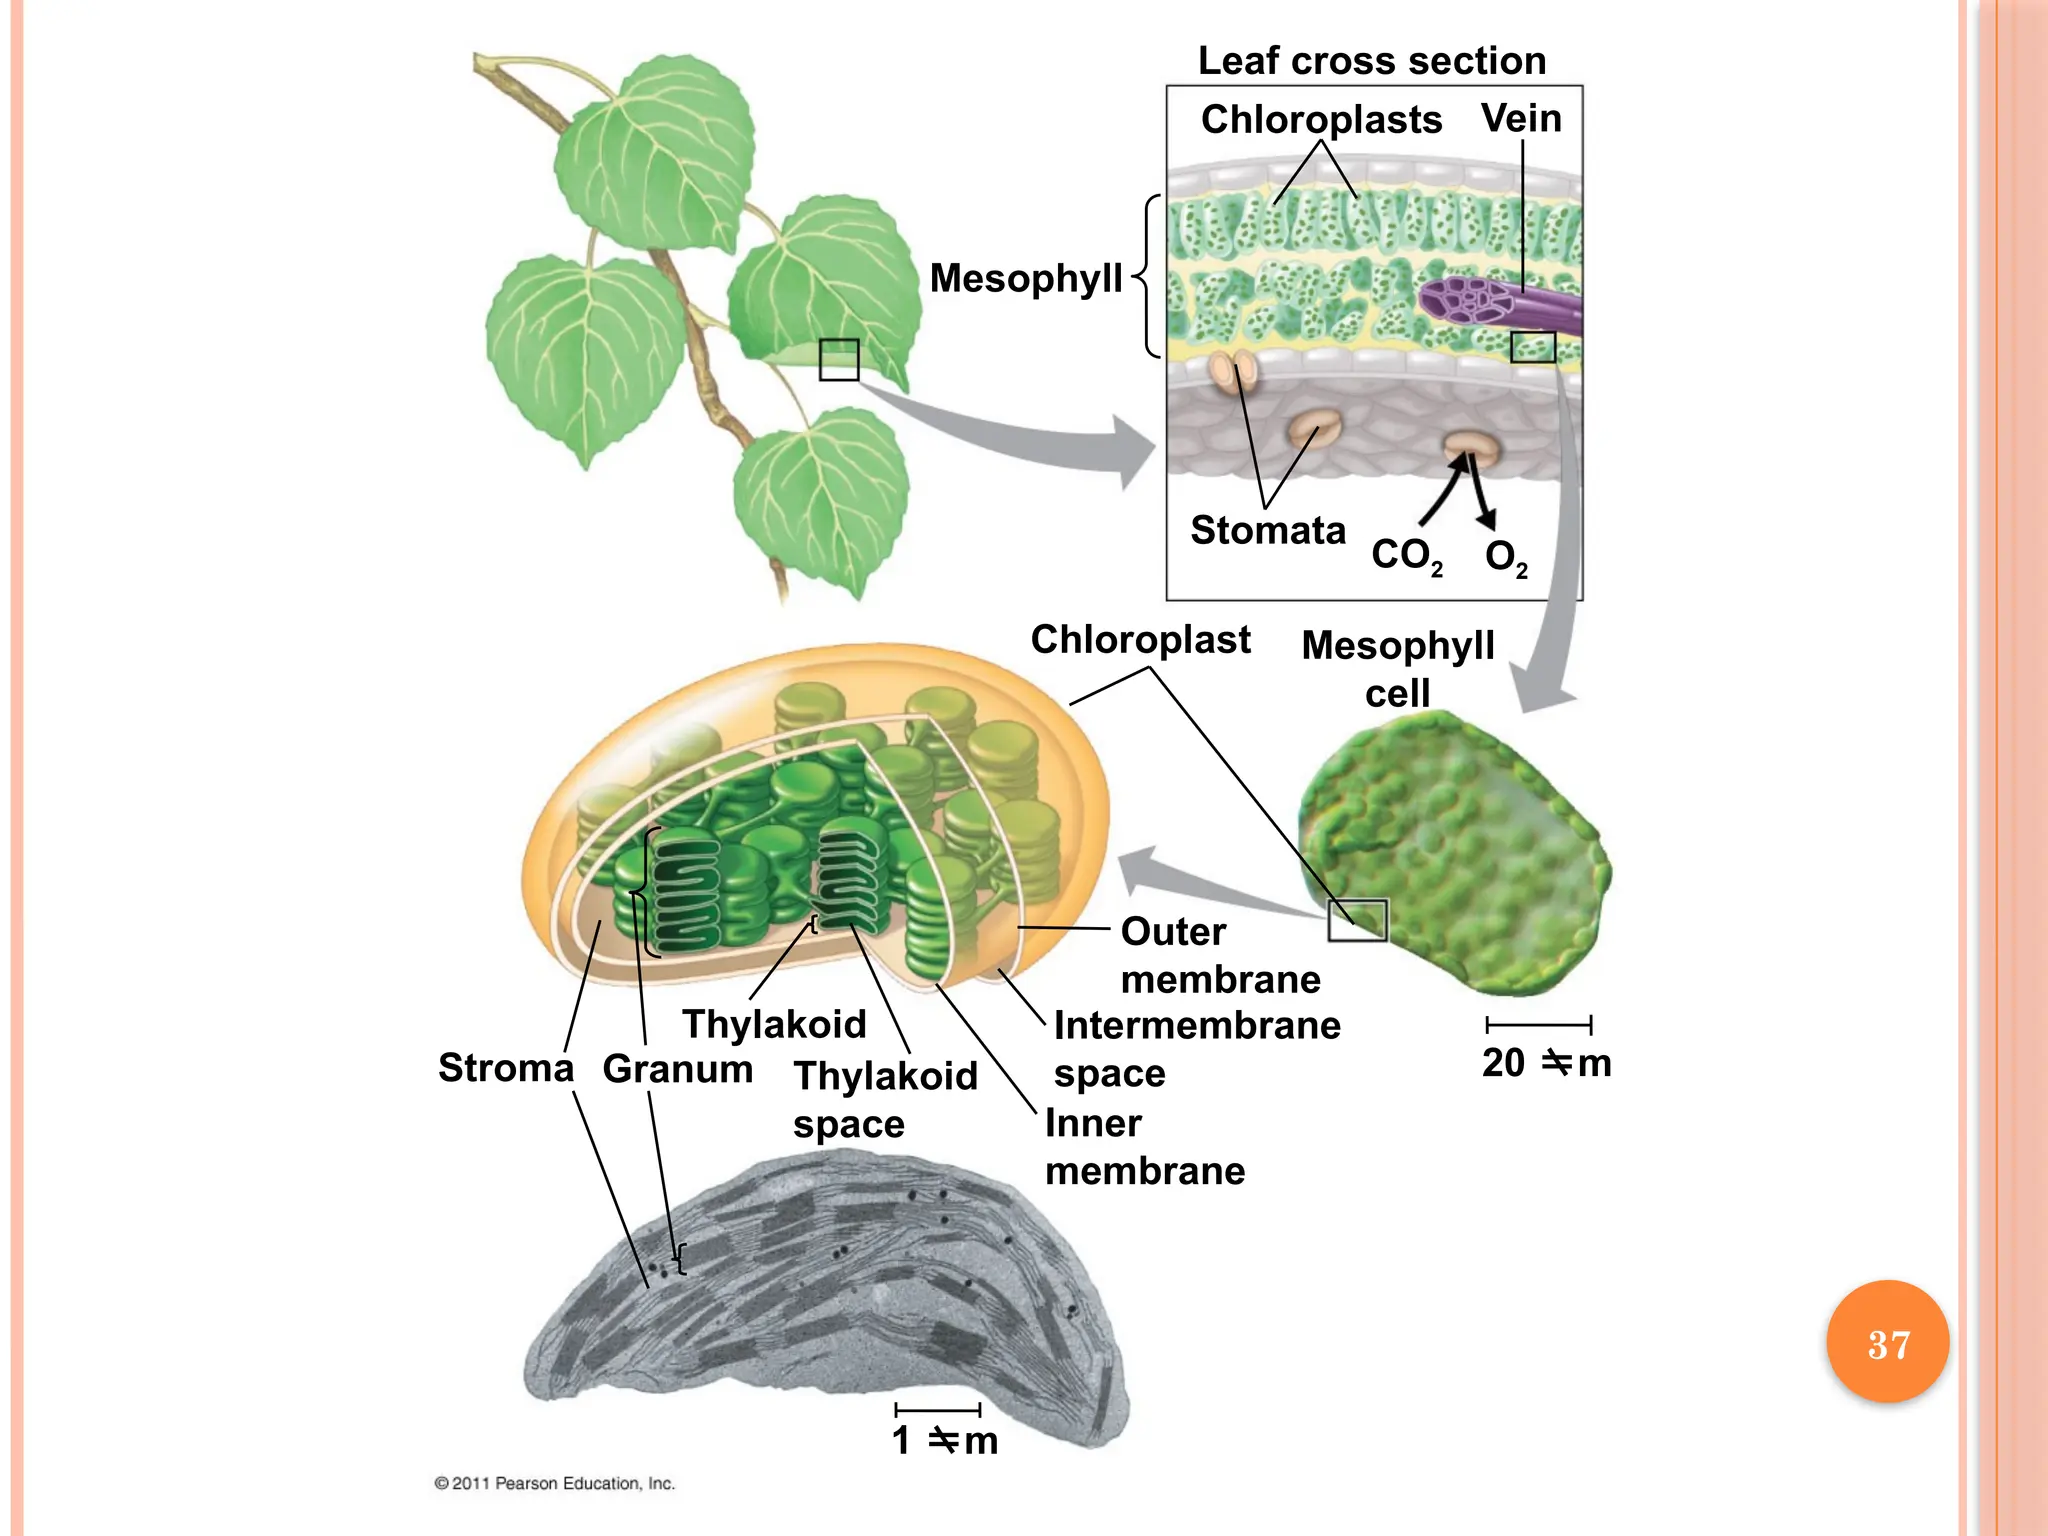
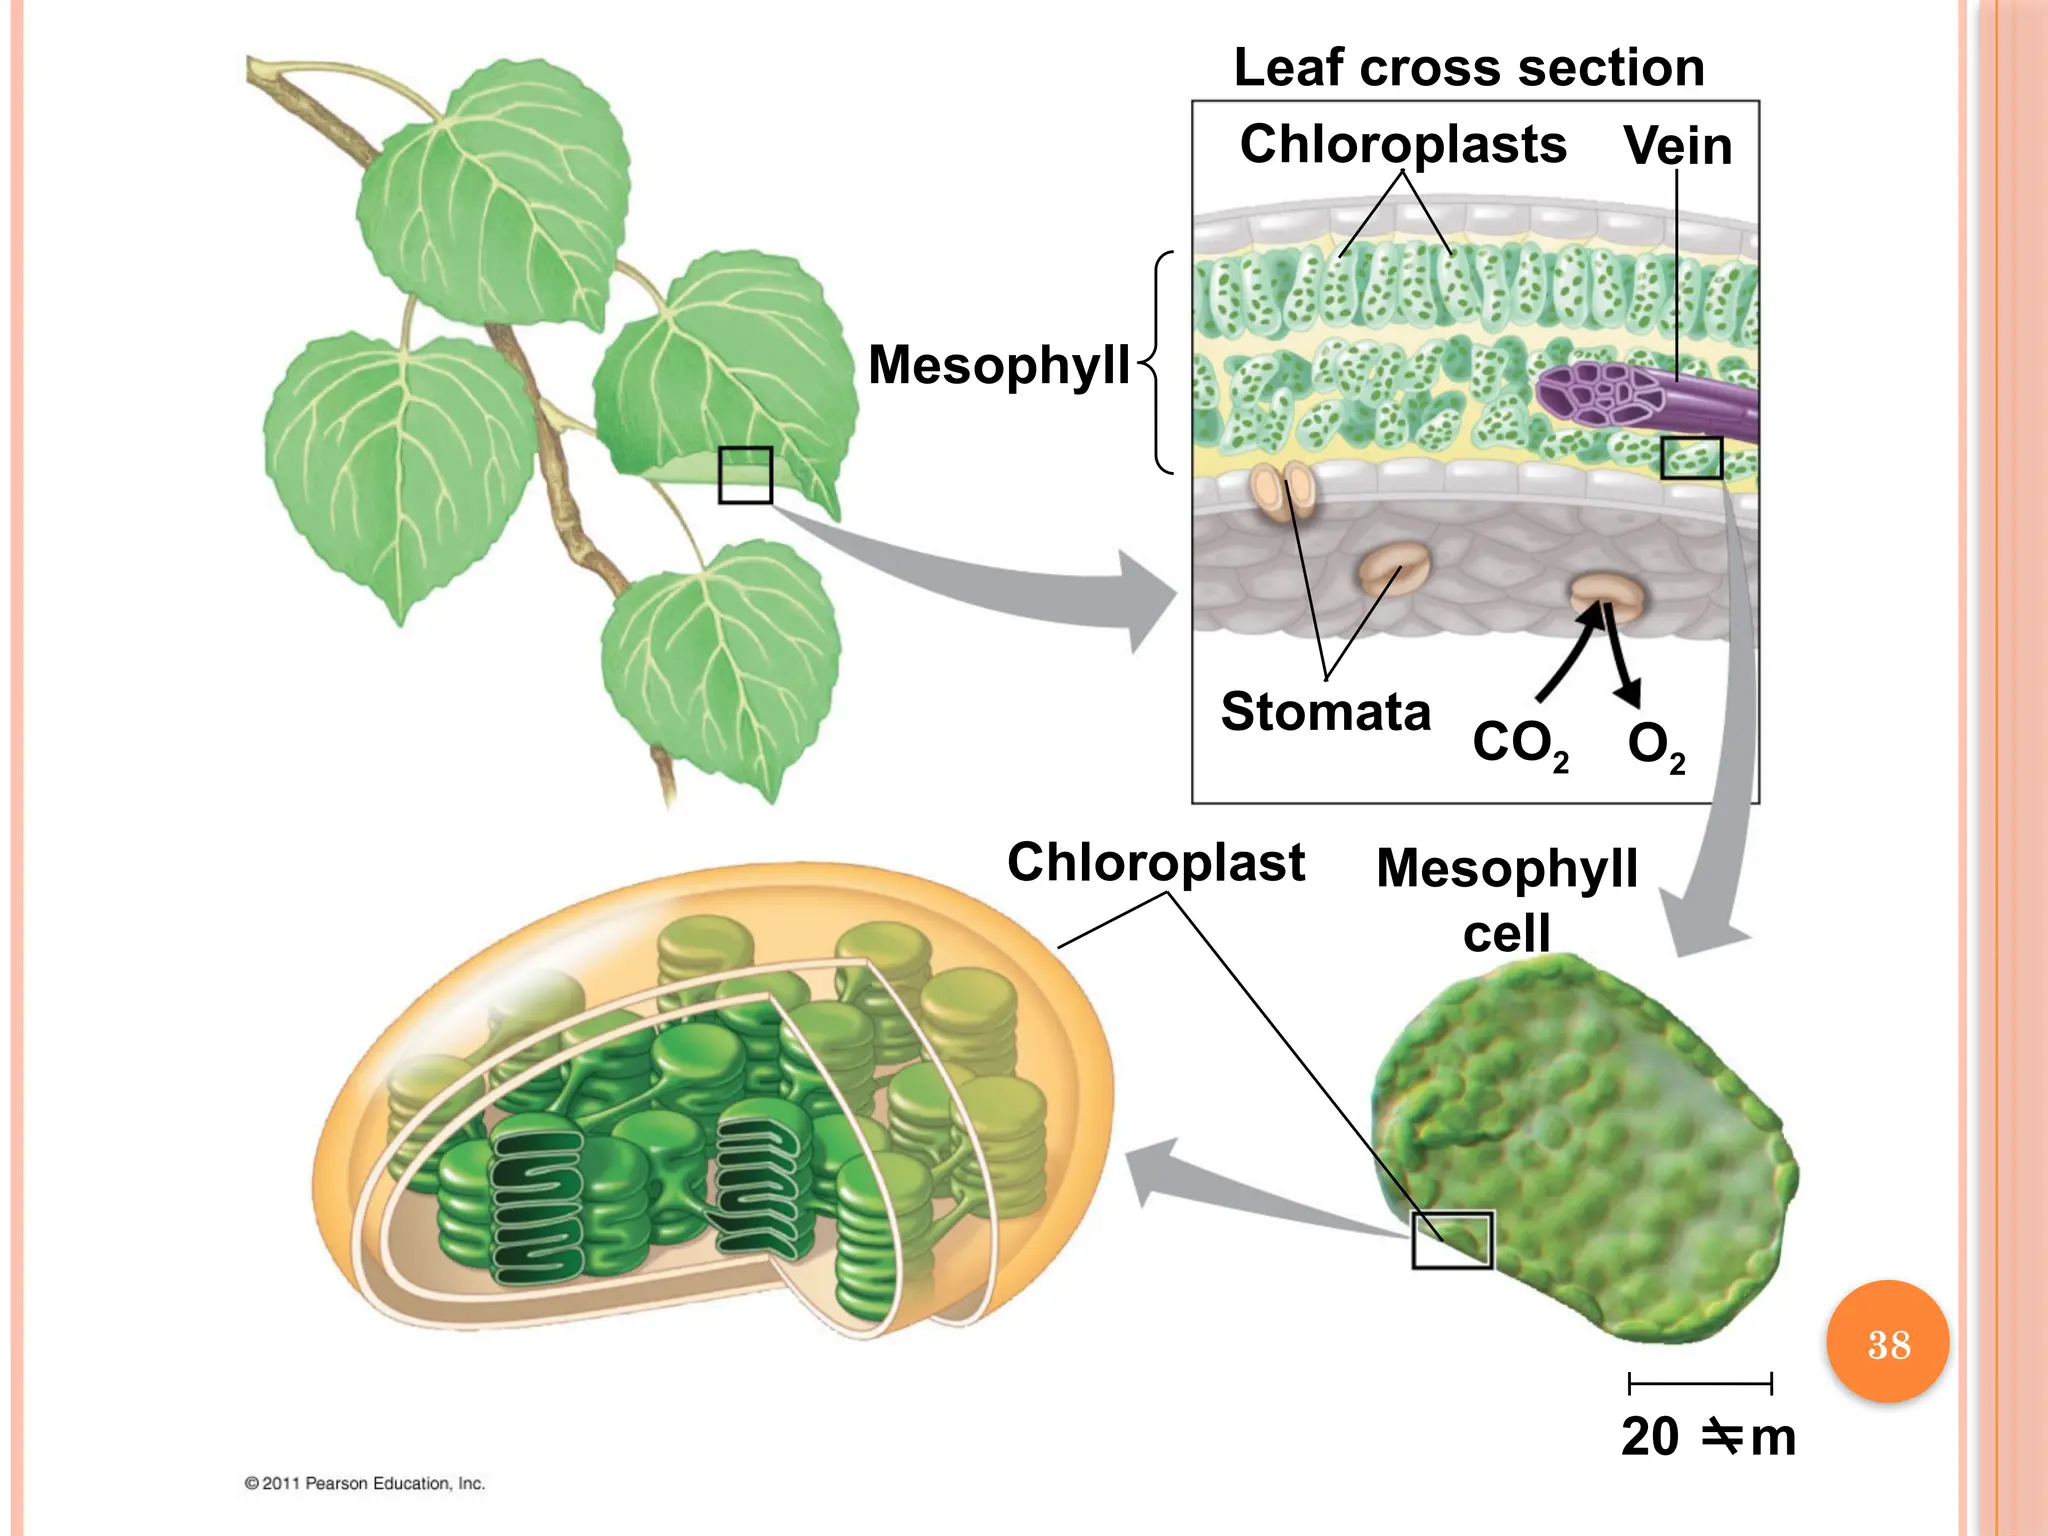
37.
Mesophyll
Leaf cross section
ChloroplastsVein
Stomata
Chloroplast Mesophyll
cell
CO2 O2
20 m
Outer
membrane
Intermembrane
space
Inner
membrane
1 m
Thylakoid
space
Thylakoid
Granum
Stroma
37
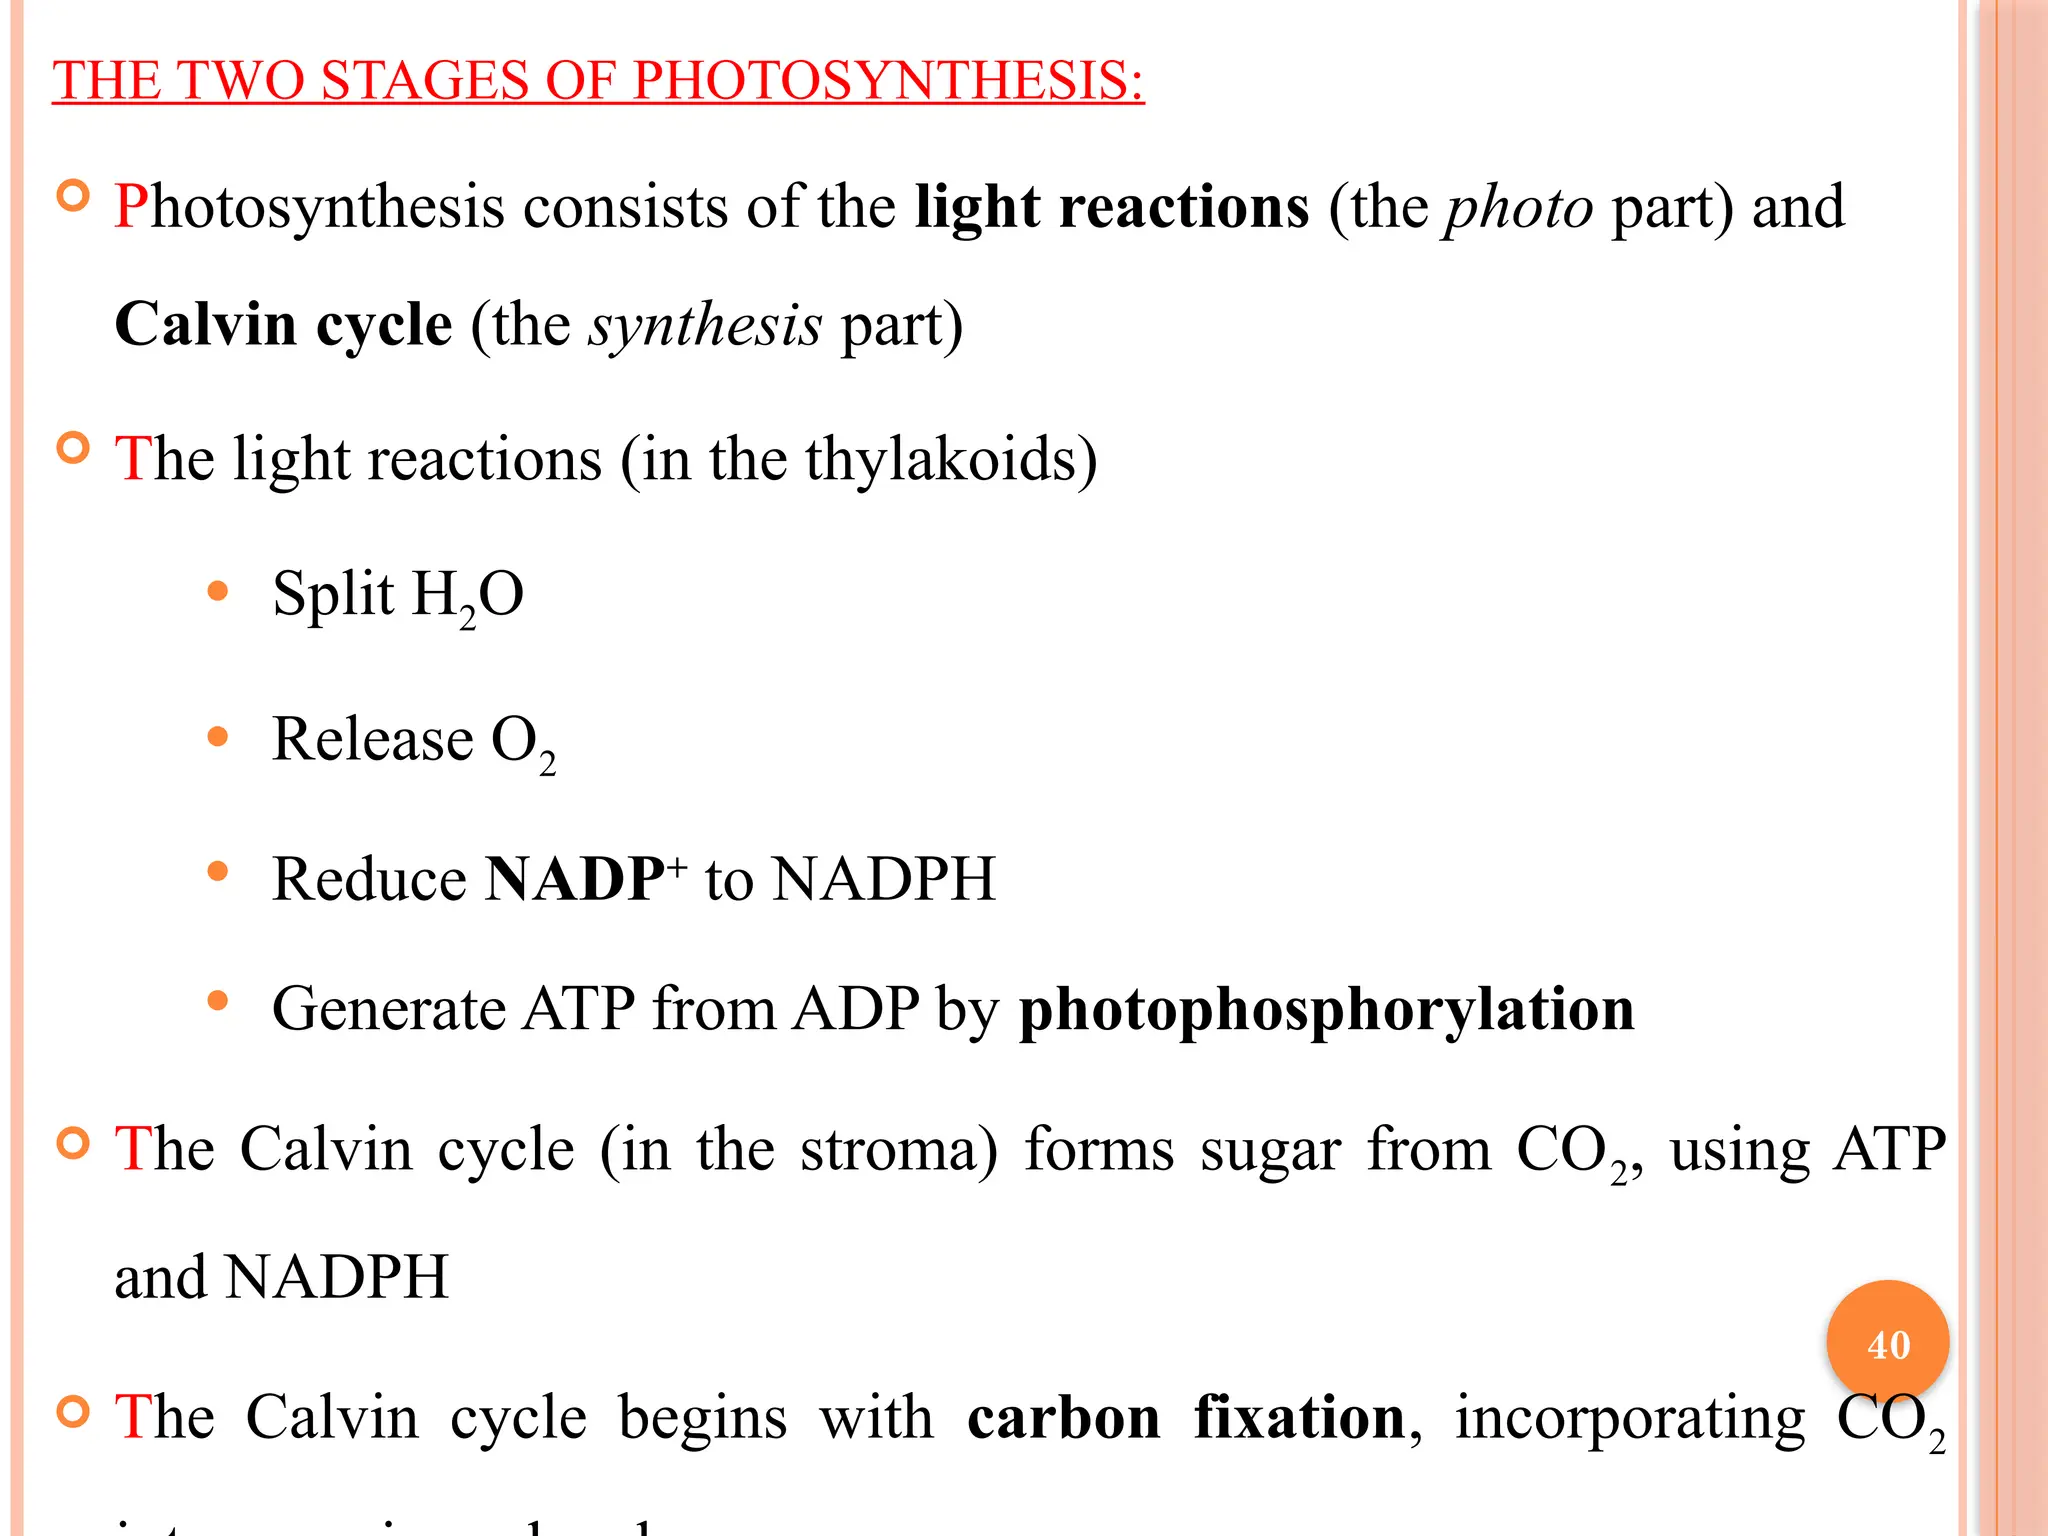
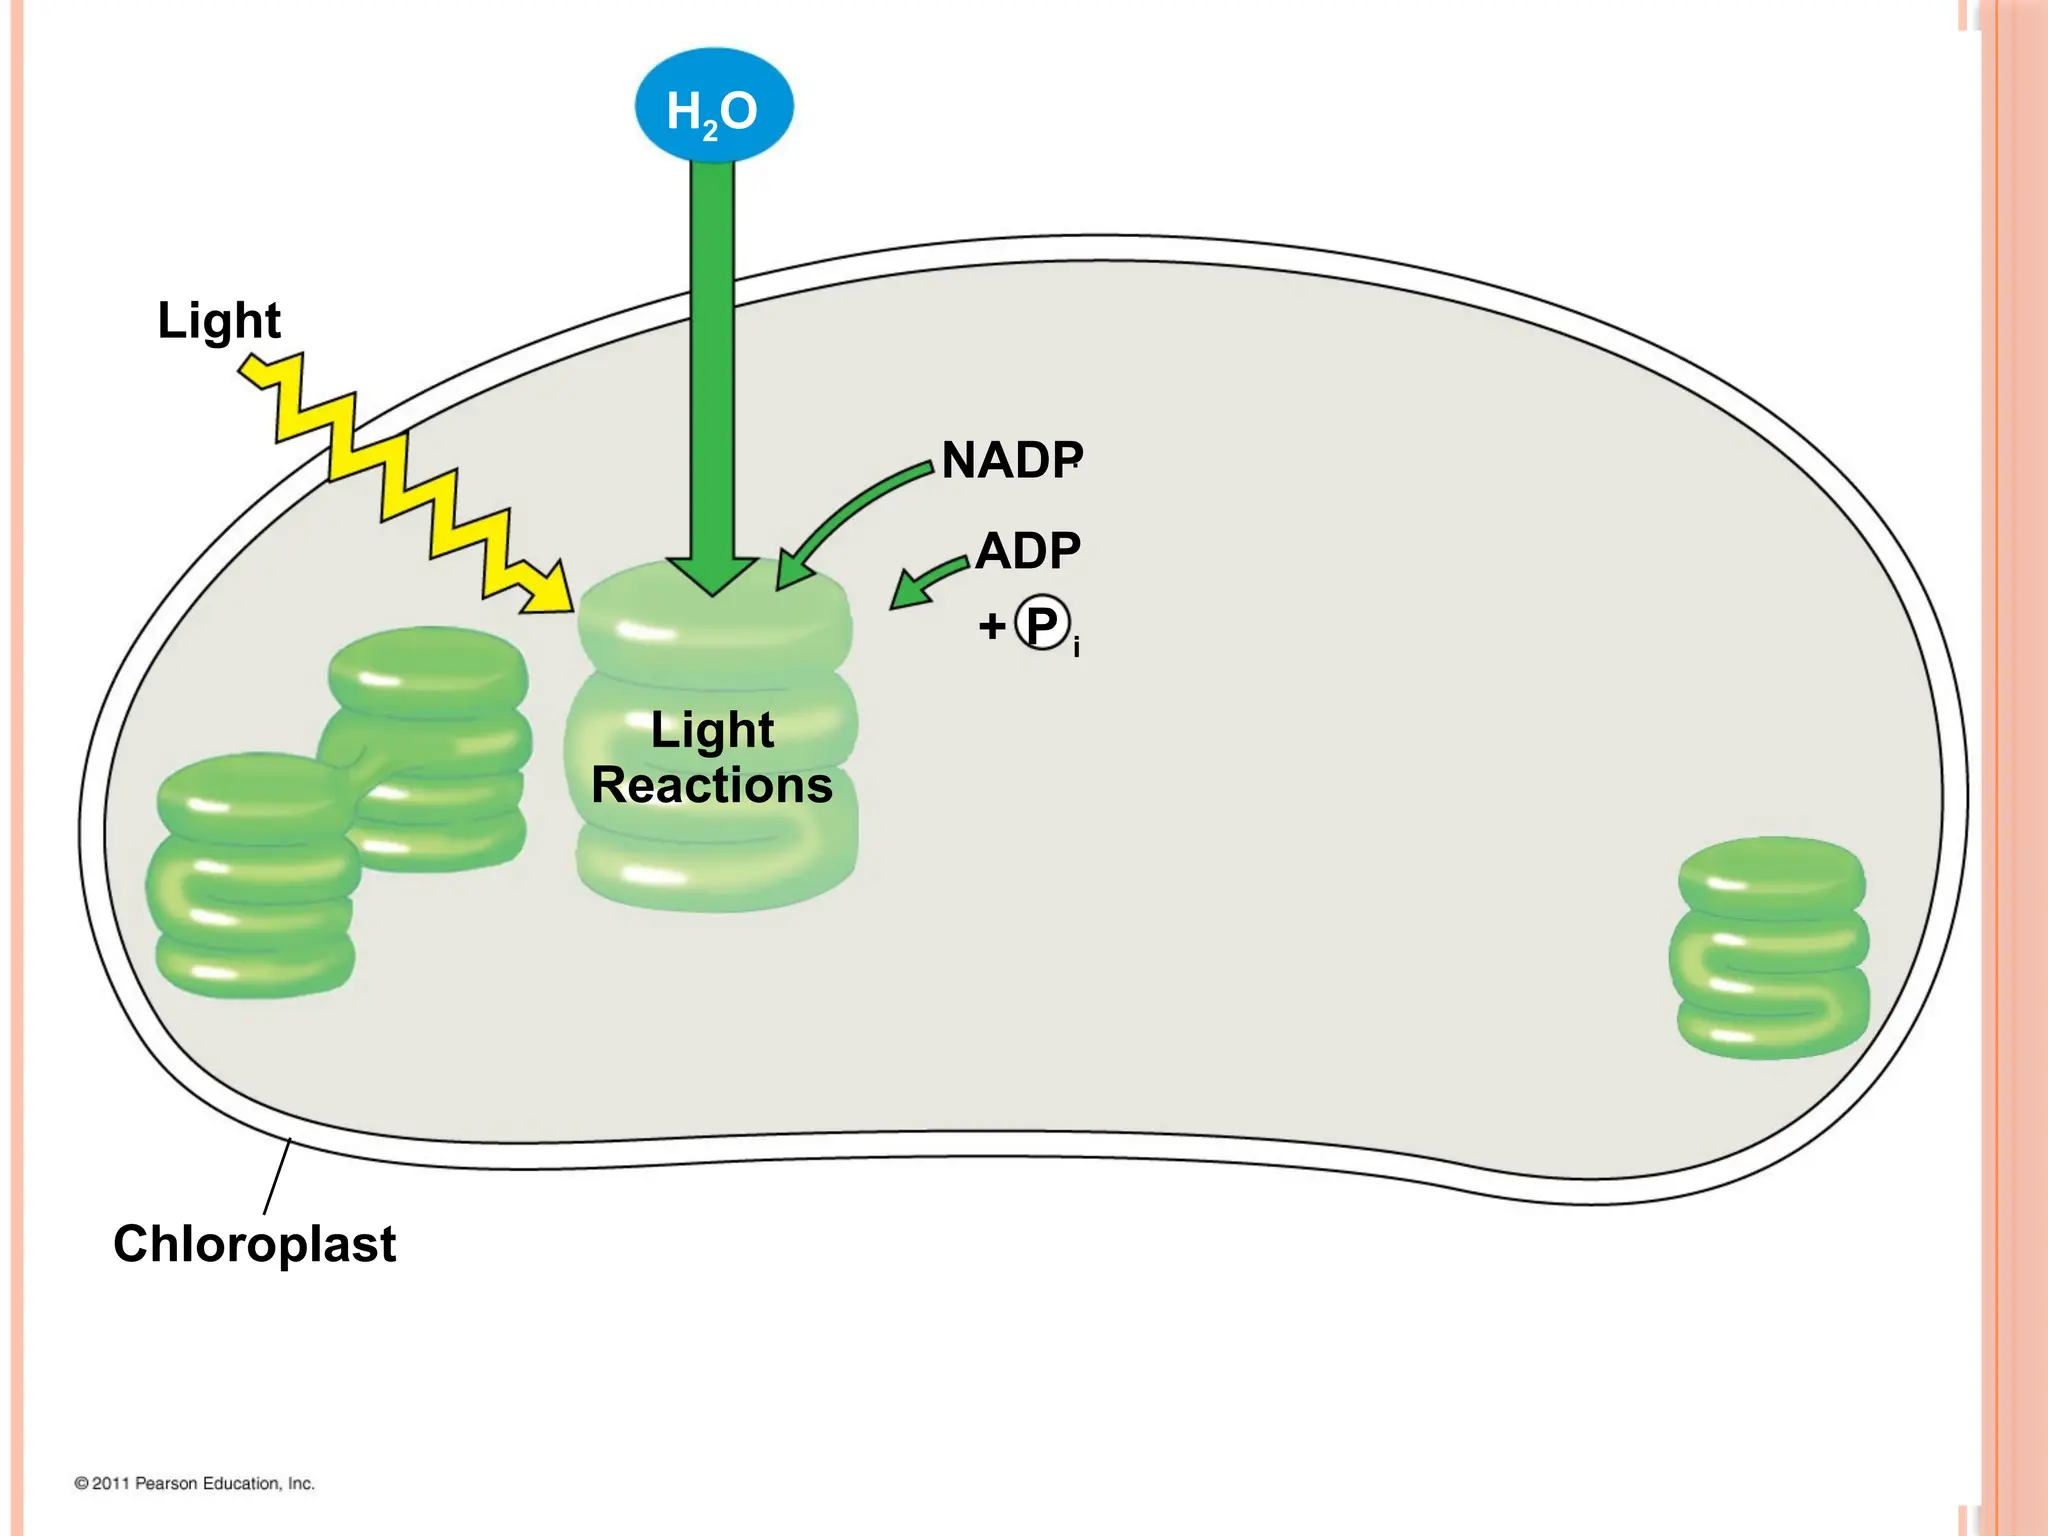
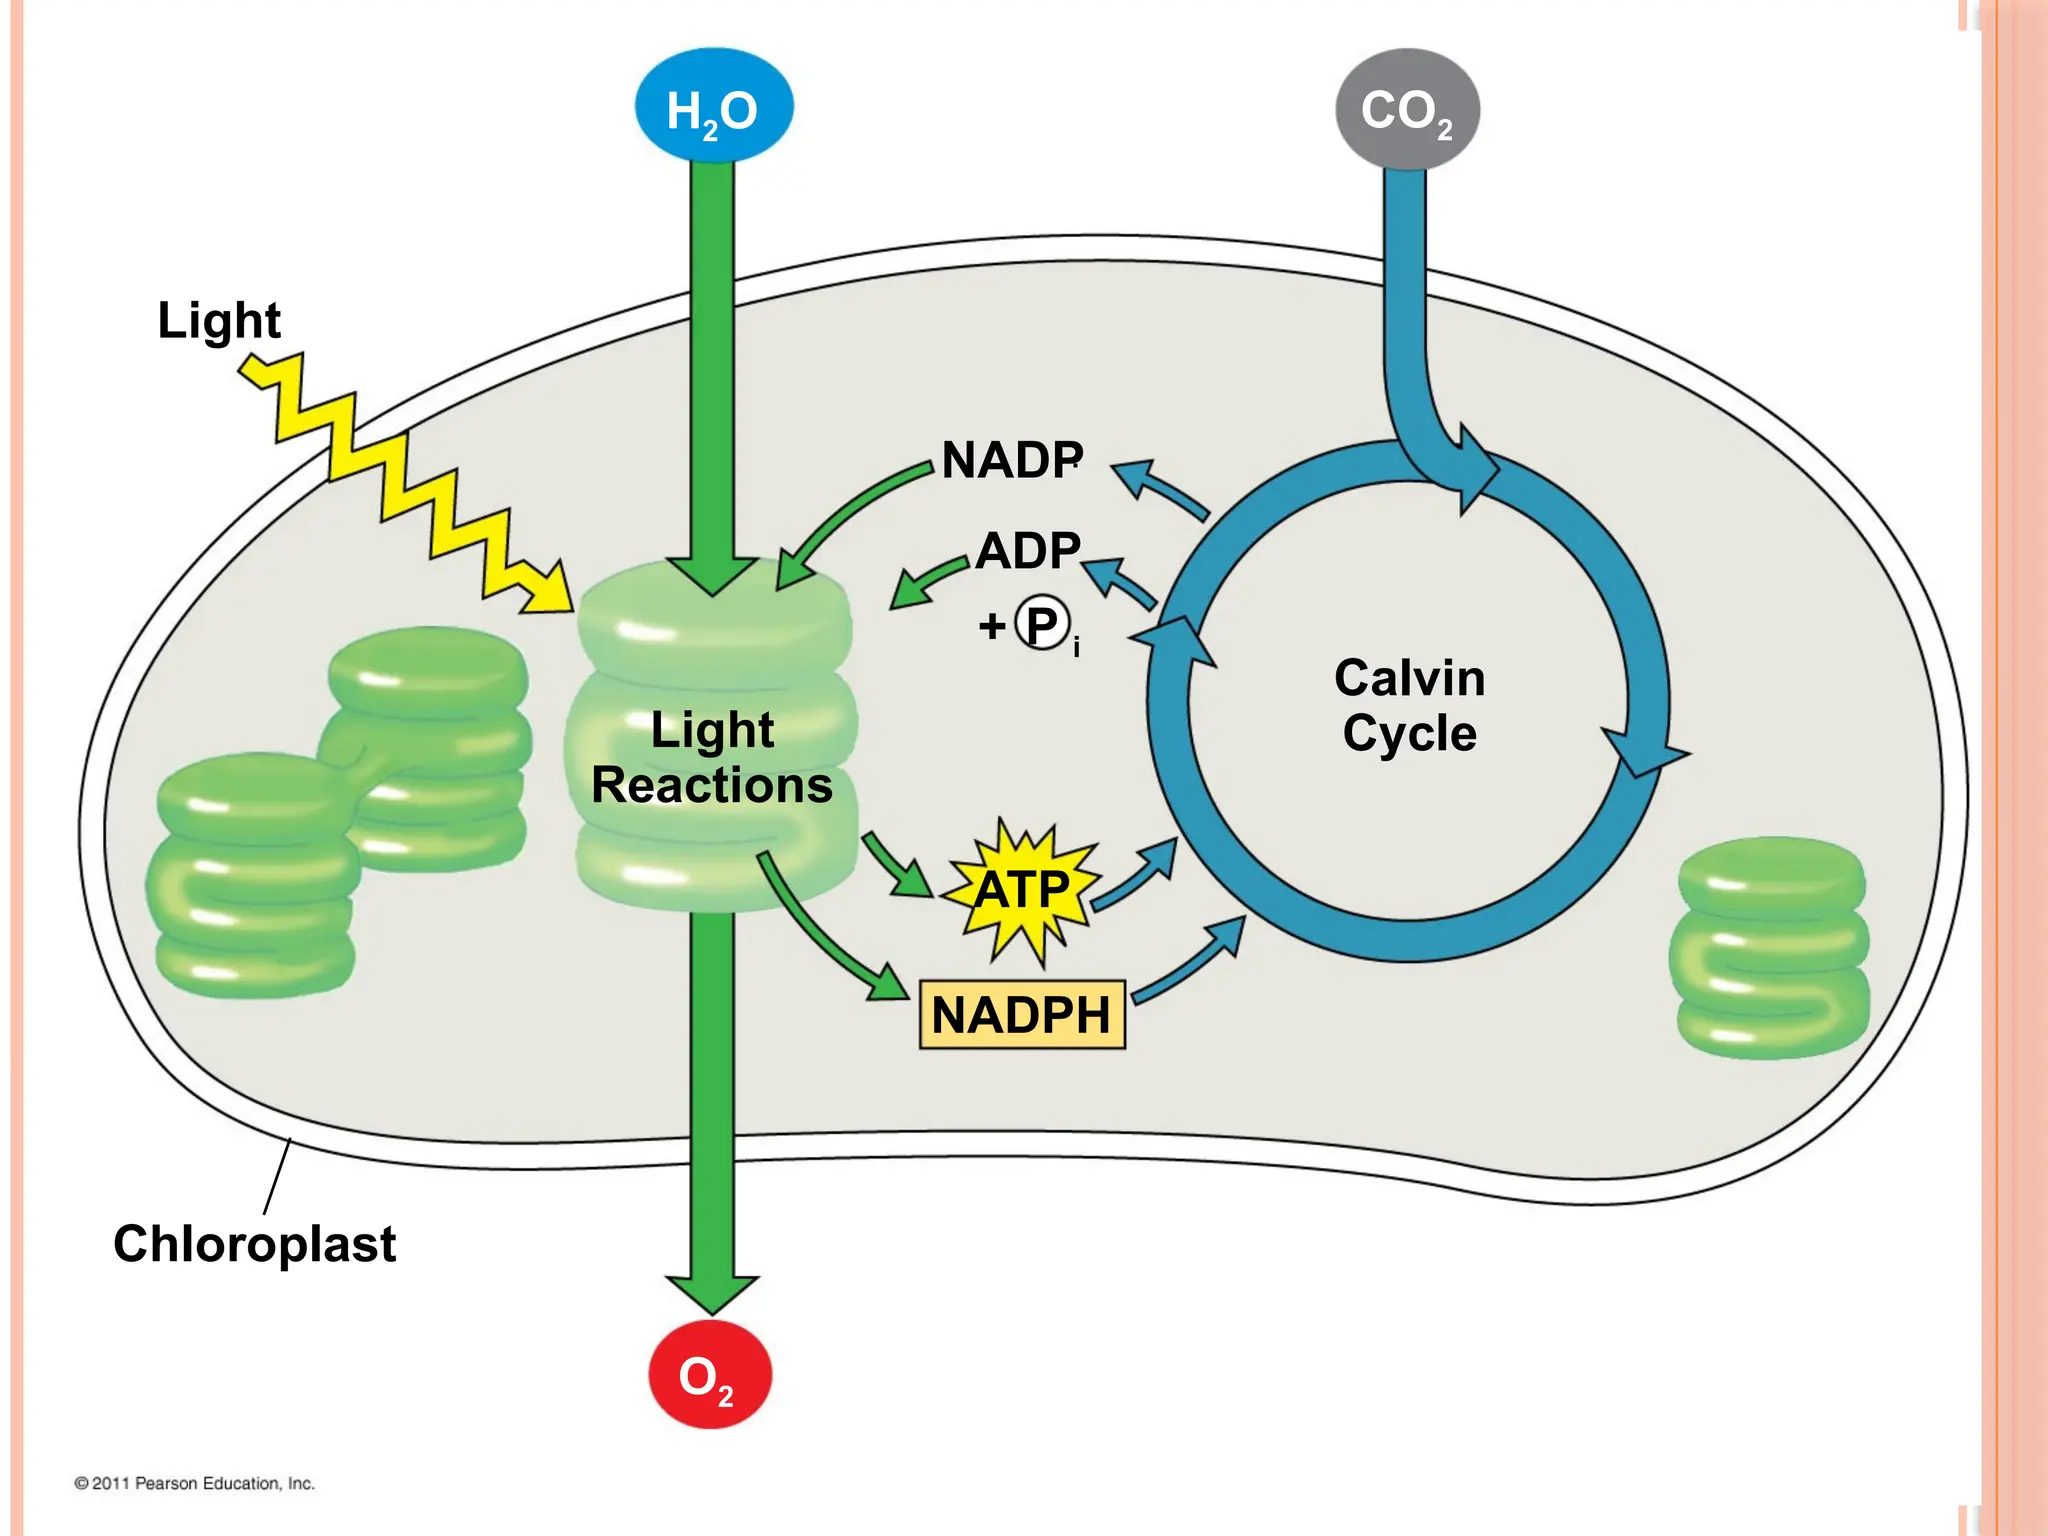
THE TWO STAGESOF PHOTOSYNTHESIS:
Photosynthesis consists of the light reactions (the photo part) and
Calvin cycle (the synthesis part)
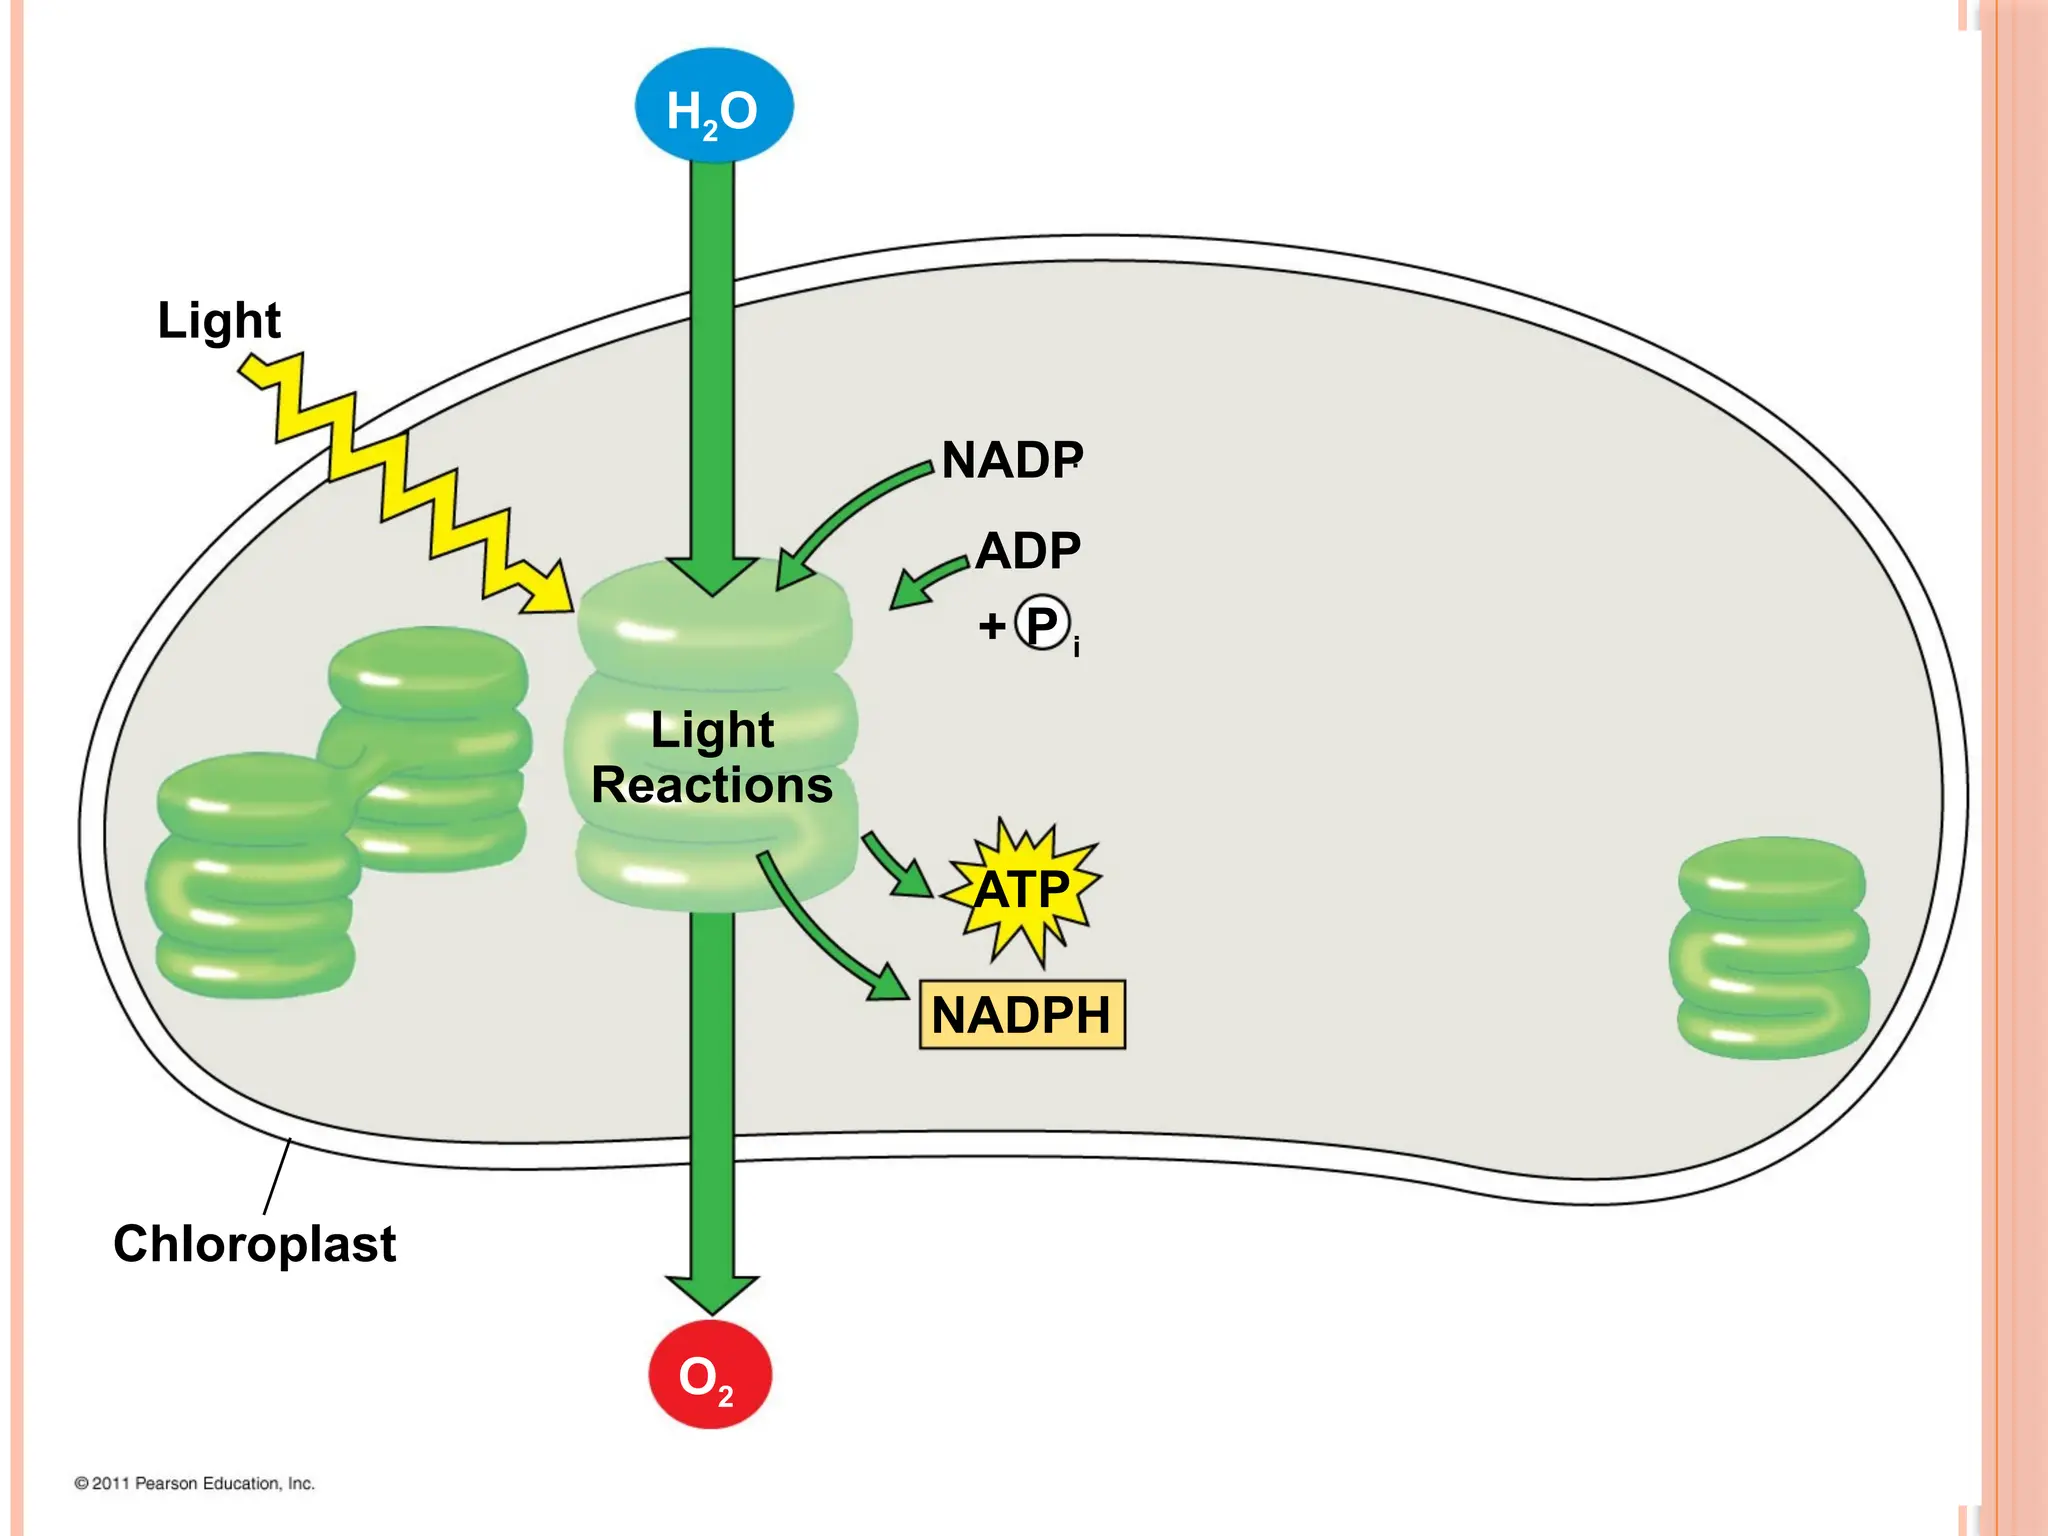
The light reactions (in the thylakoids)
Split H2O
Release O2
Reduce NADP+
to NADPH
Generate ATP from ADP by photophosphorylation
The Calvin cycle (in the stroma) forms sugar from CO2, using ATP
and NADPH
The Calvin cycle begins with carbon fixation, incorporating CO2
40
THE LIGHT REACTIONSCONVERT SOLAR ENERGY TO THE
CHEMICAL ENERGY OF ATP AND NADPH
Chloroplasts are solar-powered chemical factories
Their thylakoids transform light energy into the chemical
energy of ATP and NADPH
There are two types of photosystems in the thylakoid membrane
Photosystem II (PS II) functions first (the numbers reflect order
of discovery) and is best at absorbing a wavelength of 680 nm
The reaction-center chlorophyll a of PS II is called P680
Photosystem I (PS I) is best at absorbing a wavelength of 700
nm
The reaction-center chlorophyll a of PS I is called P700
45
46.
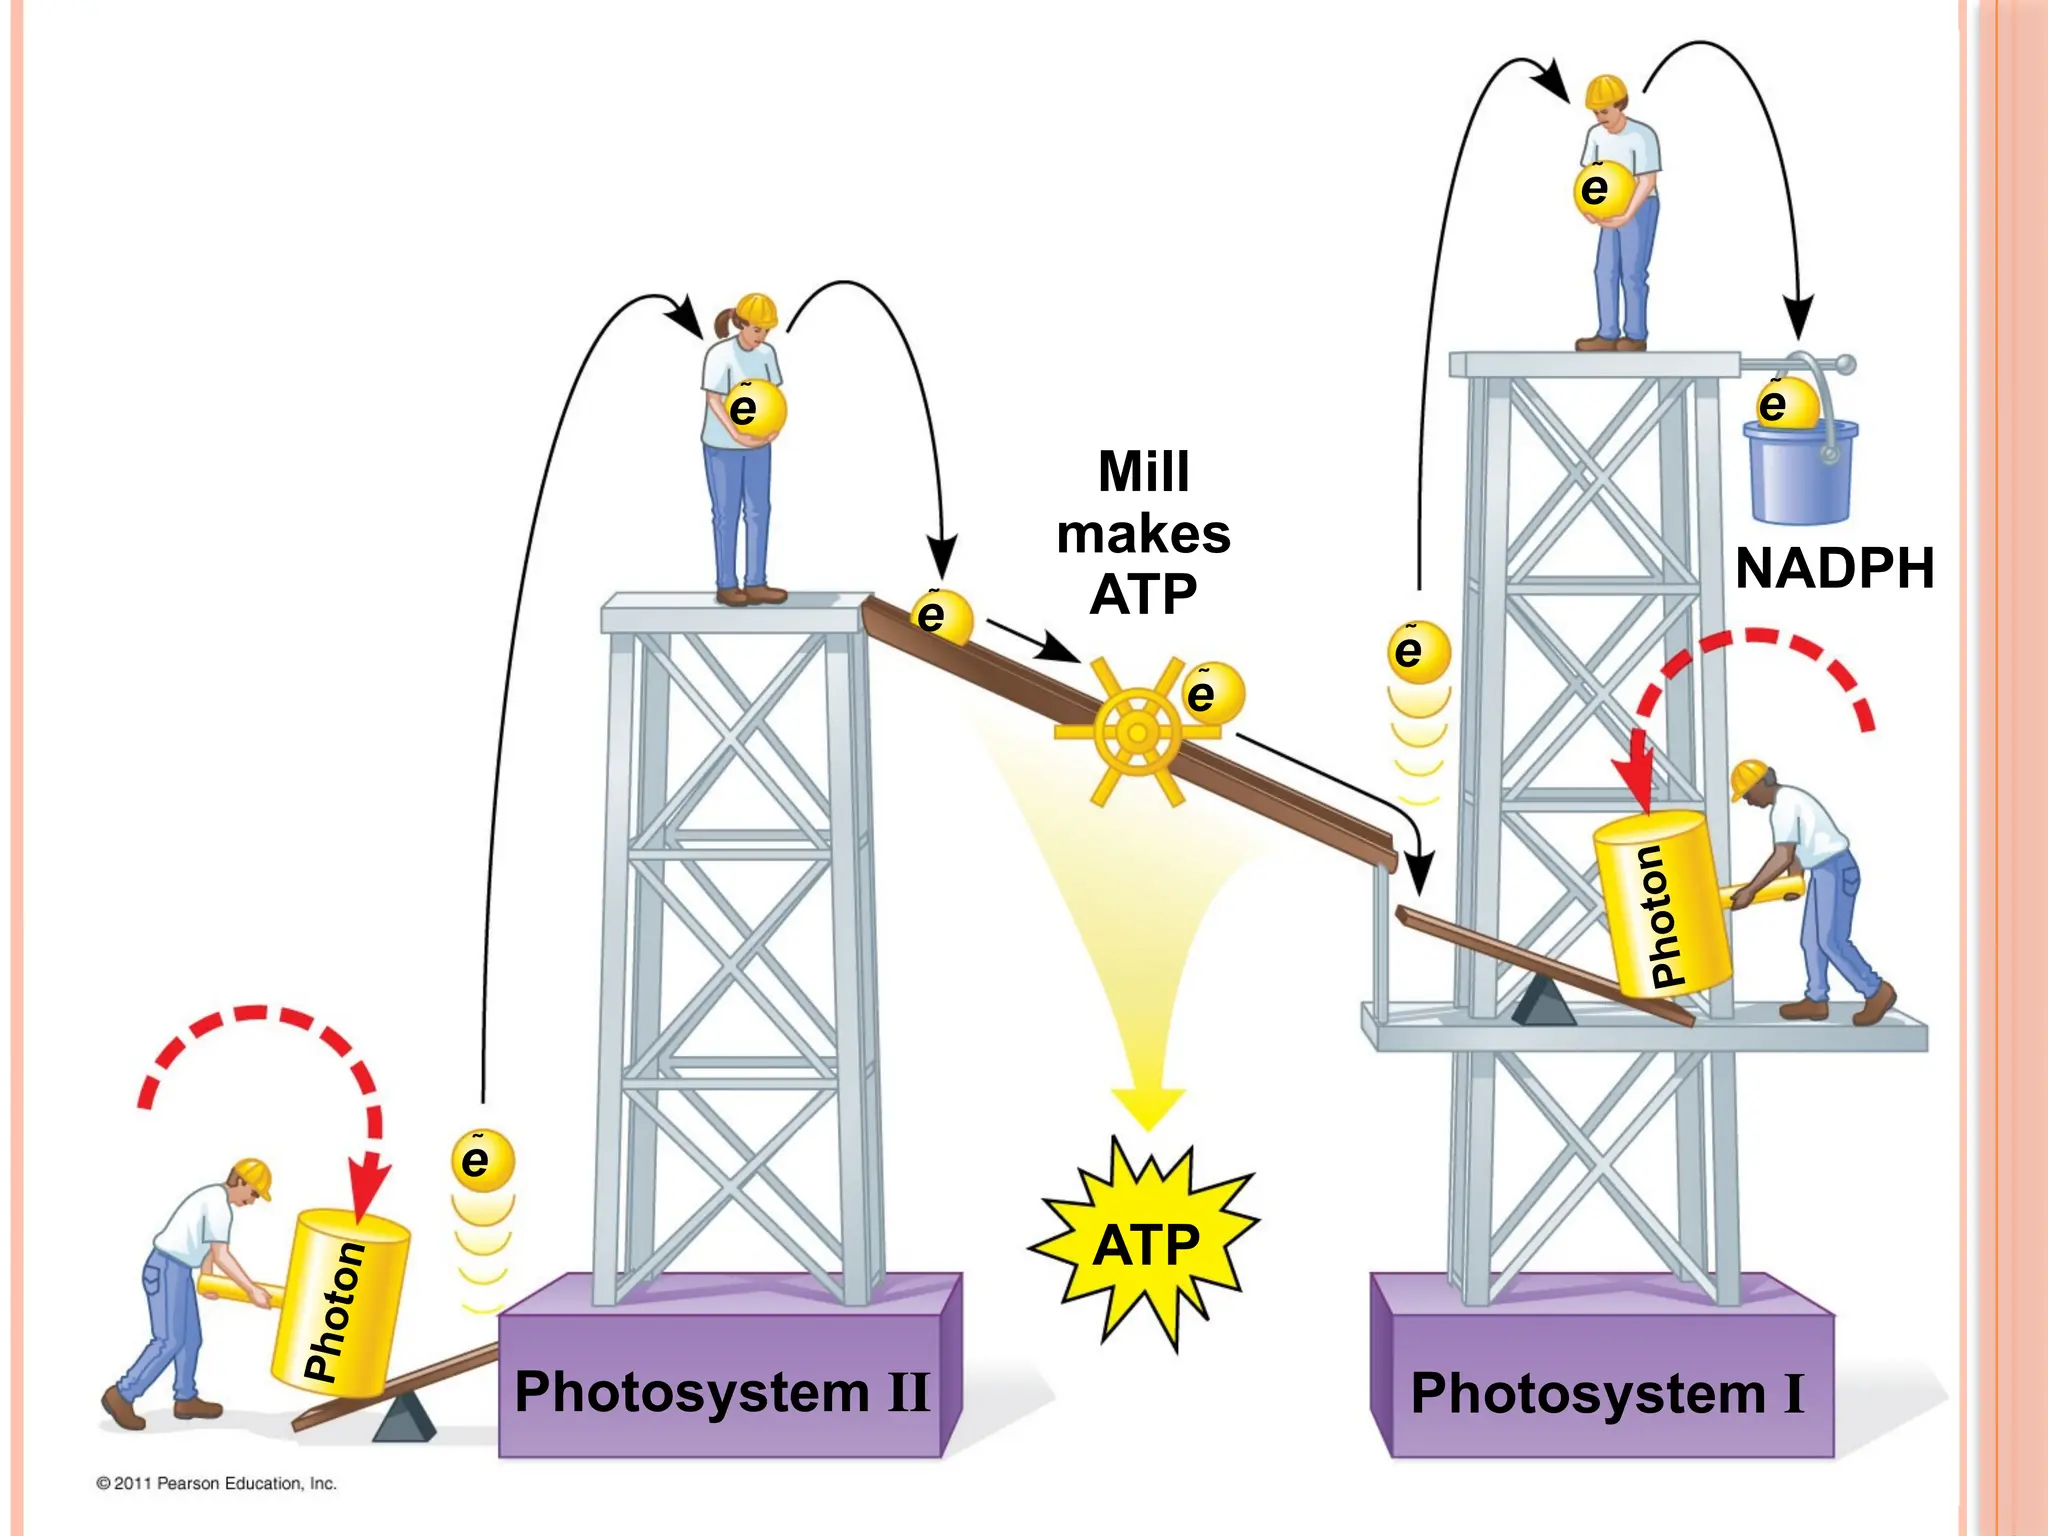
LINEAR ELECTRON FLOW
During the light reactions, there are two possible routes for
electron flow: cyclic and linear
Linear electron flow, the primary pathway, involves both
photosystems and produces ATP and NADPH using light energy
CYCLIC ELECTRON FLOW
Cyclic electron flow uses only photosystem I and produces
ATP, but not NADPH
No oxygen is released. Cyclic electron flow generates surplus
ATP, satisfying the higher demand in the Calvin cycle
46
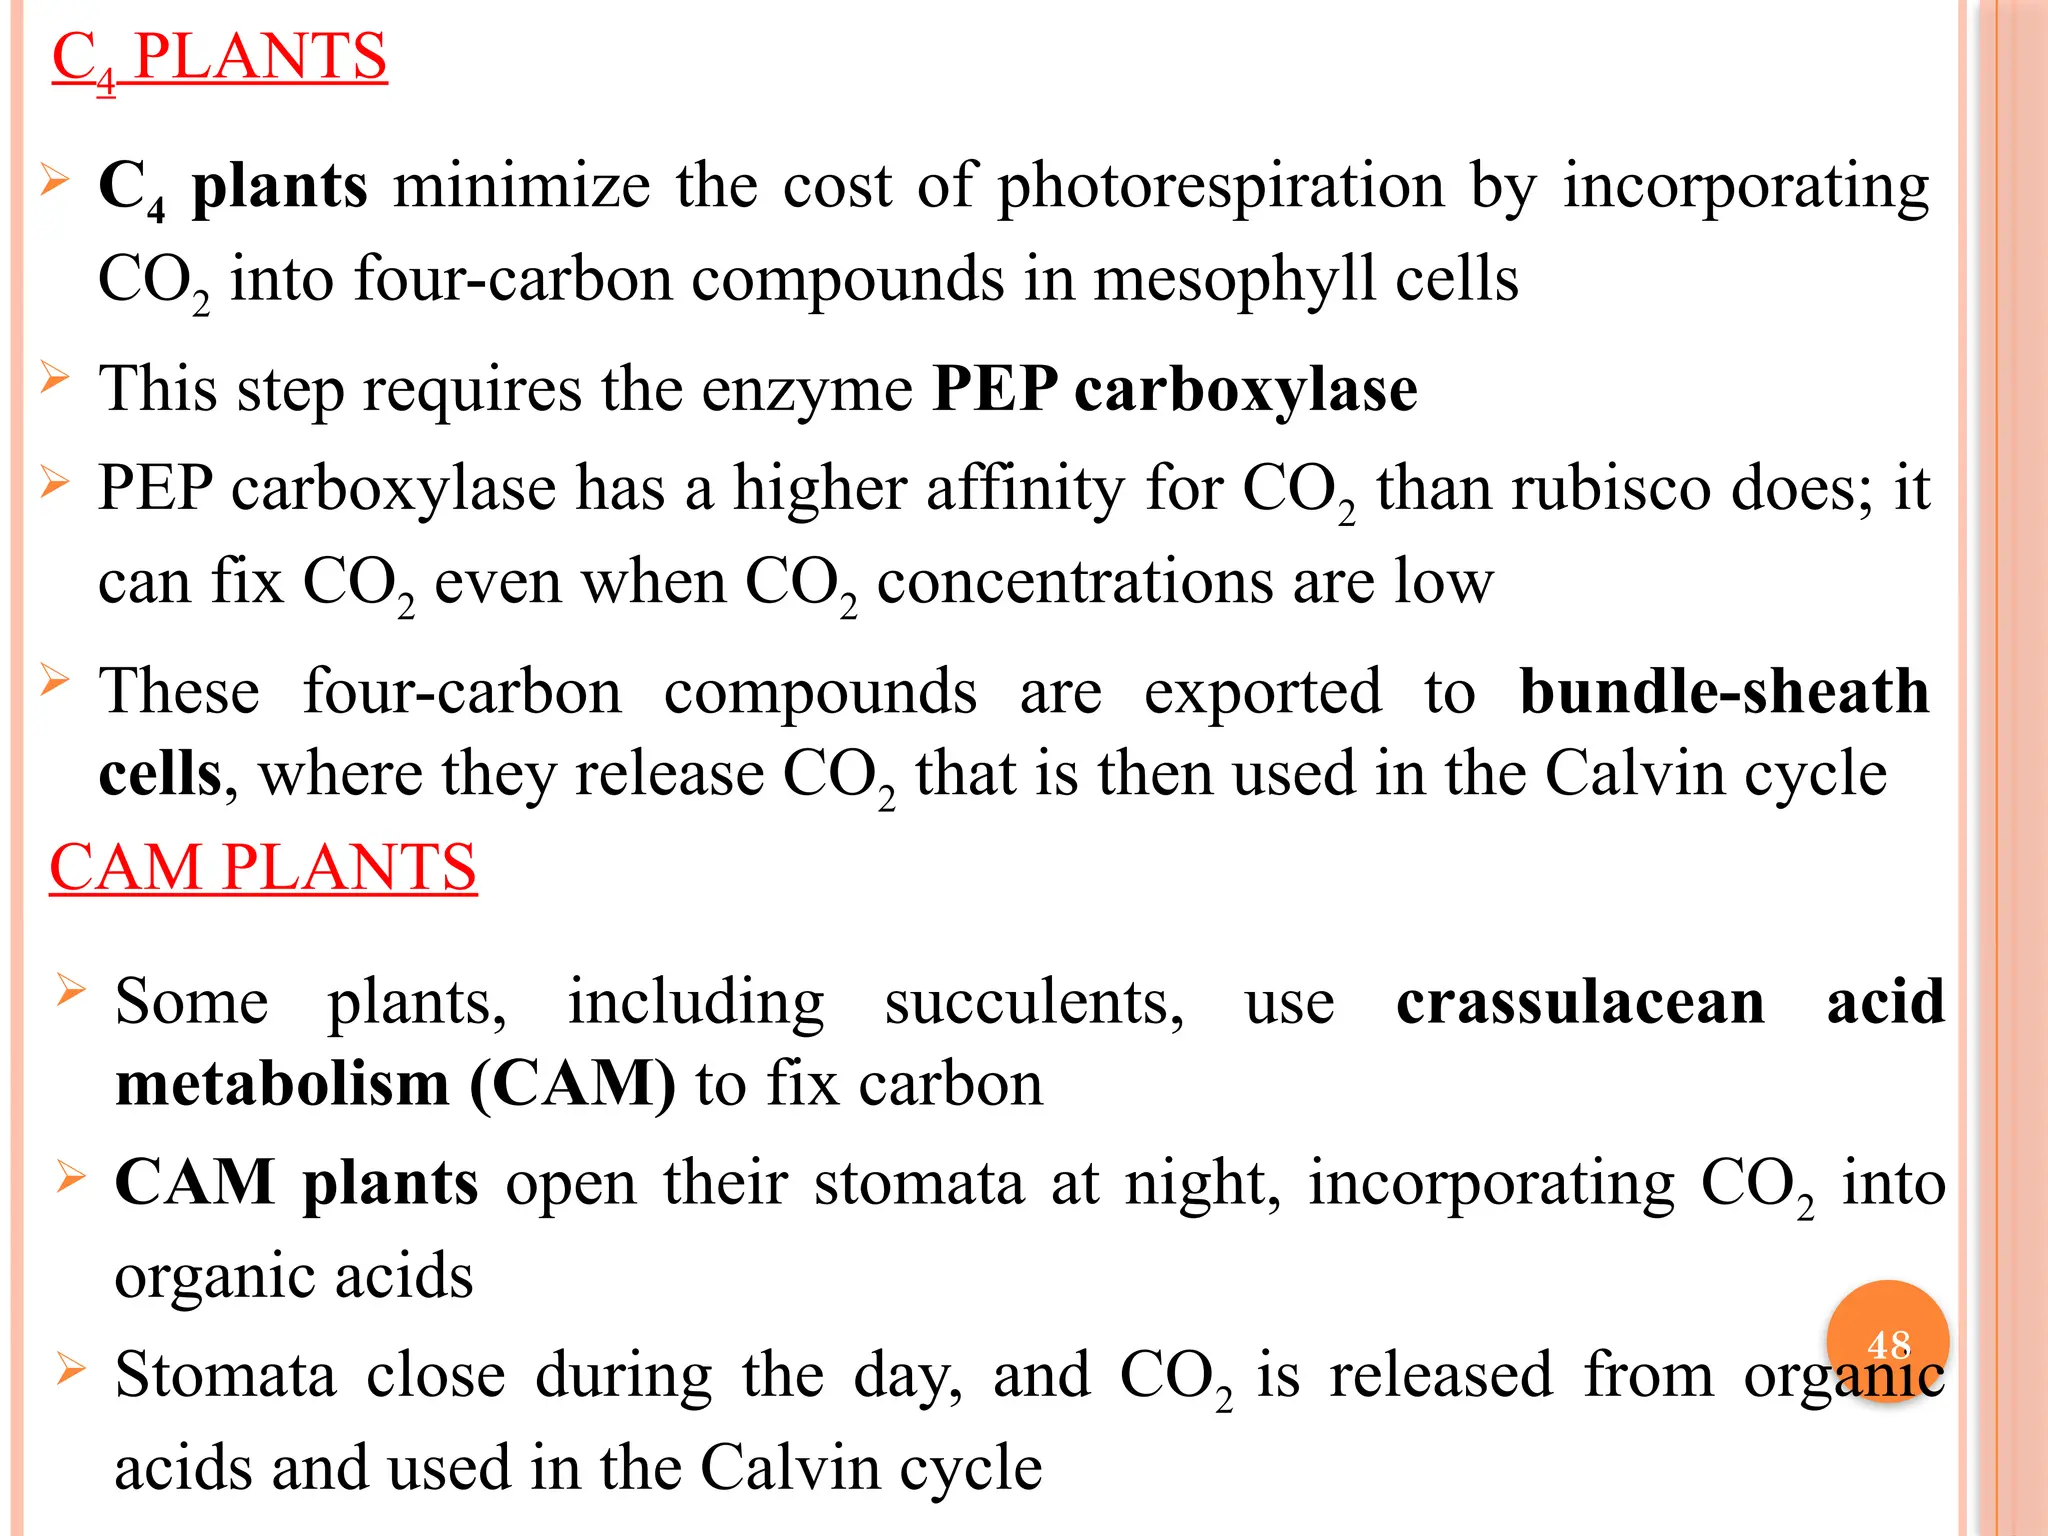
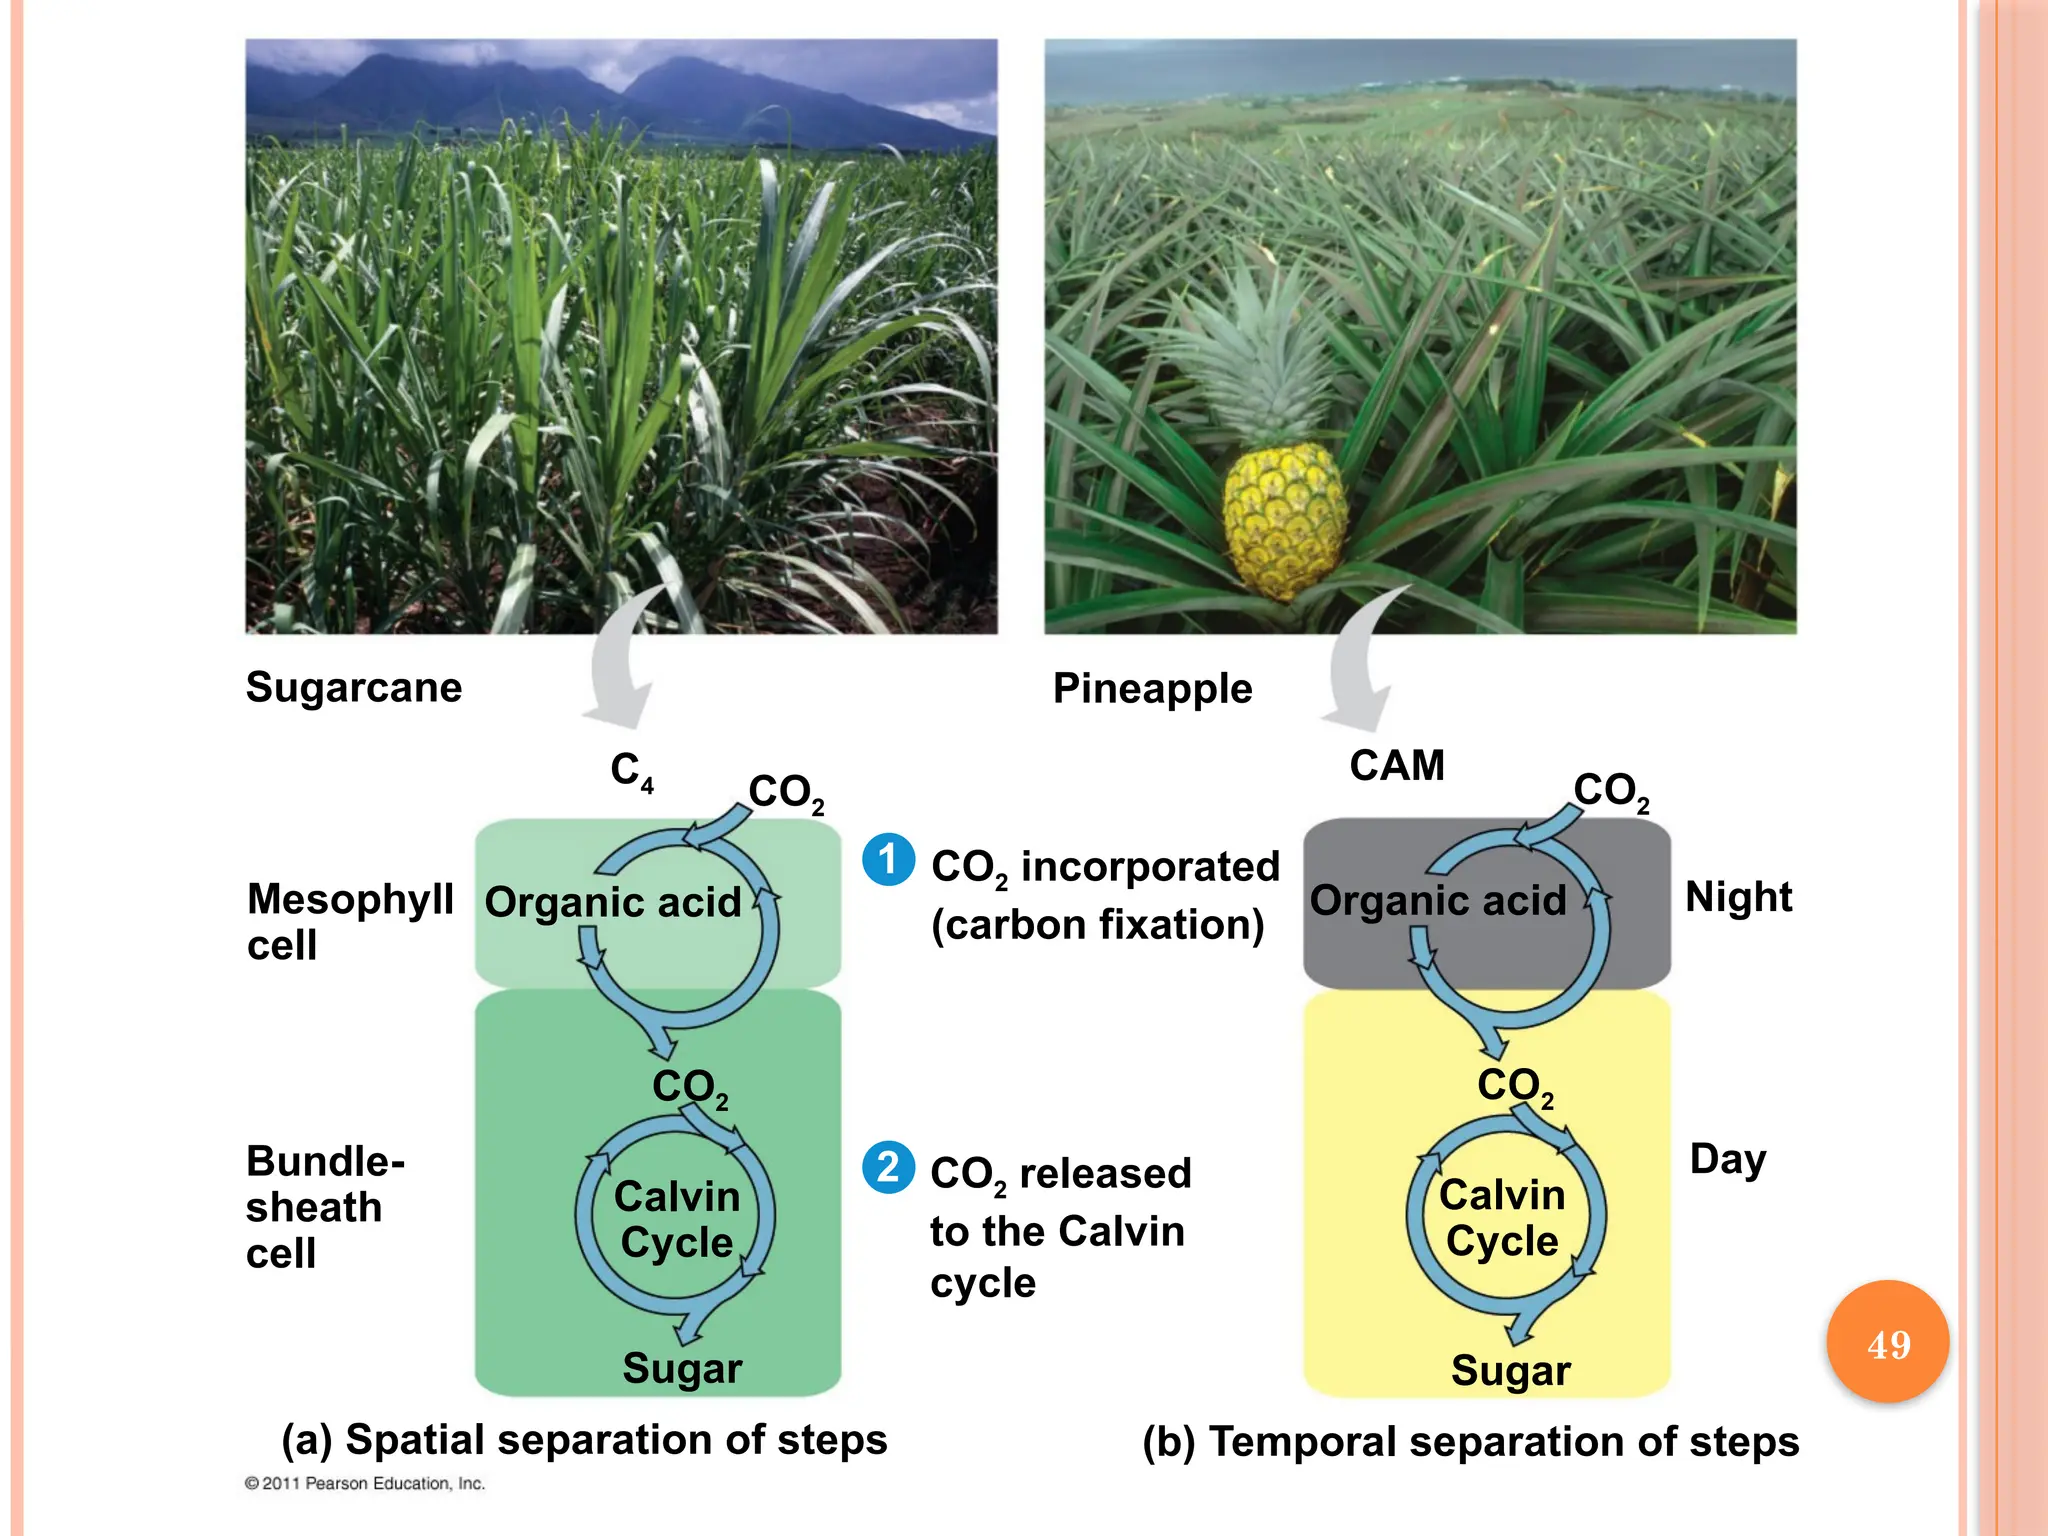
CAM PLANTS
Someplants, including succulents, use crassulacean acid
metabolism (CAM) to fix carbon
CAM plants open their stomata at night, incorporating CO2 into
organic acids
Stomata close during the day, and CO2 is released from organic
acids and used in the Calvin cycle
C4 PLANTS
C4 plants minimize the cost of photorespiration by incorporating
CO2 into four-carbon compounds in mesophyll cells
This step requires the enzyme PEP carboxylase
PEP carboxylase has a higher affinity for CO2 than rubisco does; it
can fix CO2 even when CO2 concentrations are low
These four-carbon compounds are exported to bundle-sheath
cells, where they release CO2 that is then used in the Calvin cycle
48
LEAF COMPONENTS
Itconsists of light-harvesting antennae complexes composed of
carotenoids and chlorophylls a and b connected to Photosystem
(PS) l and ll reaction centers, a cytochrome b6f complex,and ATP
synthase.
The b6f complex transfers electrons from PSII, the water-
oxidizing center to PSI leading to NADP+
reduction.
The proton gradient that develops across thylakoid between an
interior luma and the exterior stroma is employed by ATP synthase
(coupling factor complex, CF0,-CF1,) to produce ATP from ADP.
50
51.
Photosynthetic reductivepentose phosphate cycle ("dark reactions”
involving CO2 assimilation) is found in stromal solution.
Key enzyme, rubisco. catalyzes both oxygenation carboxylation of
ribulose-l,5-bisphosphate (RuP2). Rubisco`s activity as an
oxygenase, initial step in process of photorespiration, increases as
ratio [O2] / [CO2] at enzyme and/or temperature increase.
Also in stroma are enzyme systems that manufacture and repair
chloroplast constituents, reduce nitrite and sulfite, and synthesize
starch.
Q10 of reductive cycle is 2 and low temperature limits C02
reduction unless the capacity is increased through increases in
Cont..
51
52.
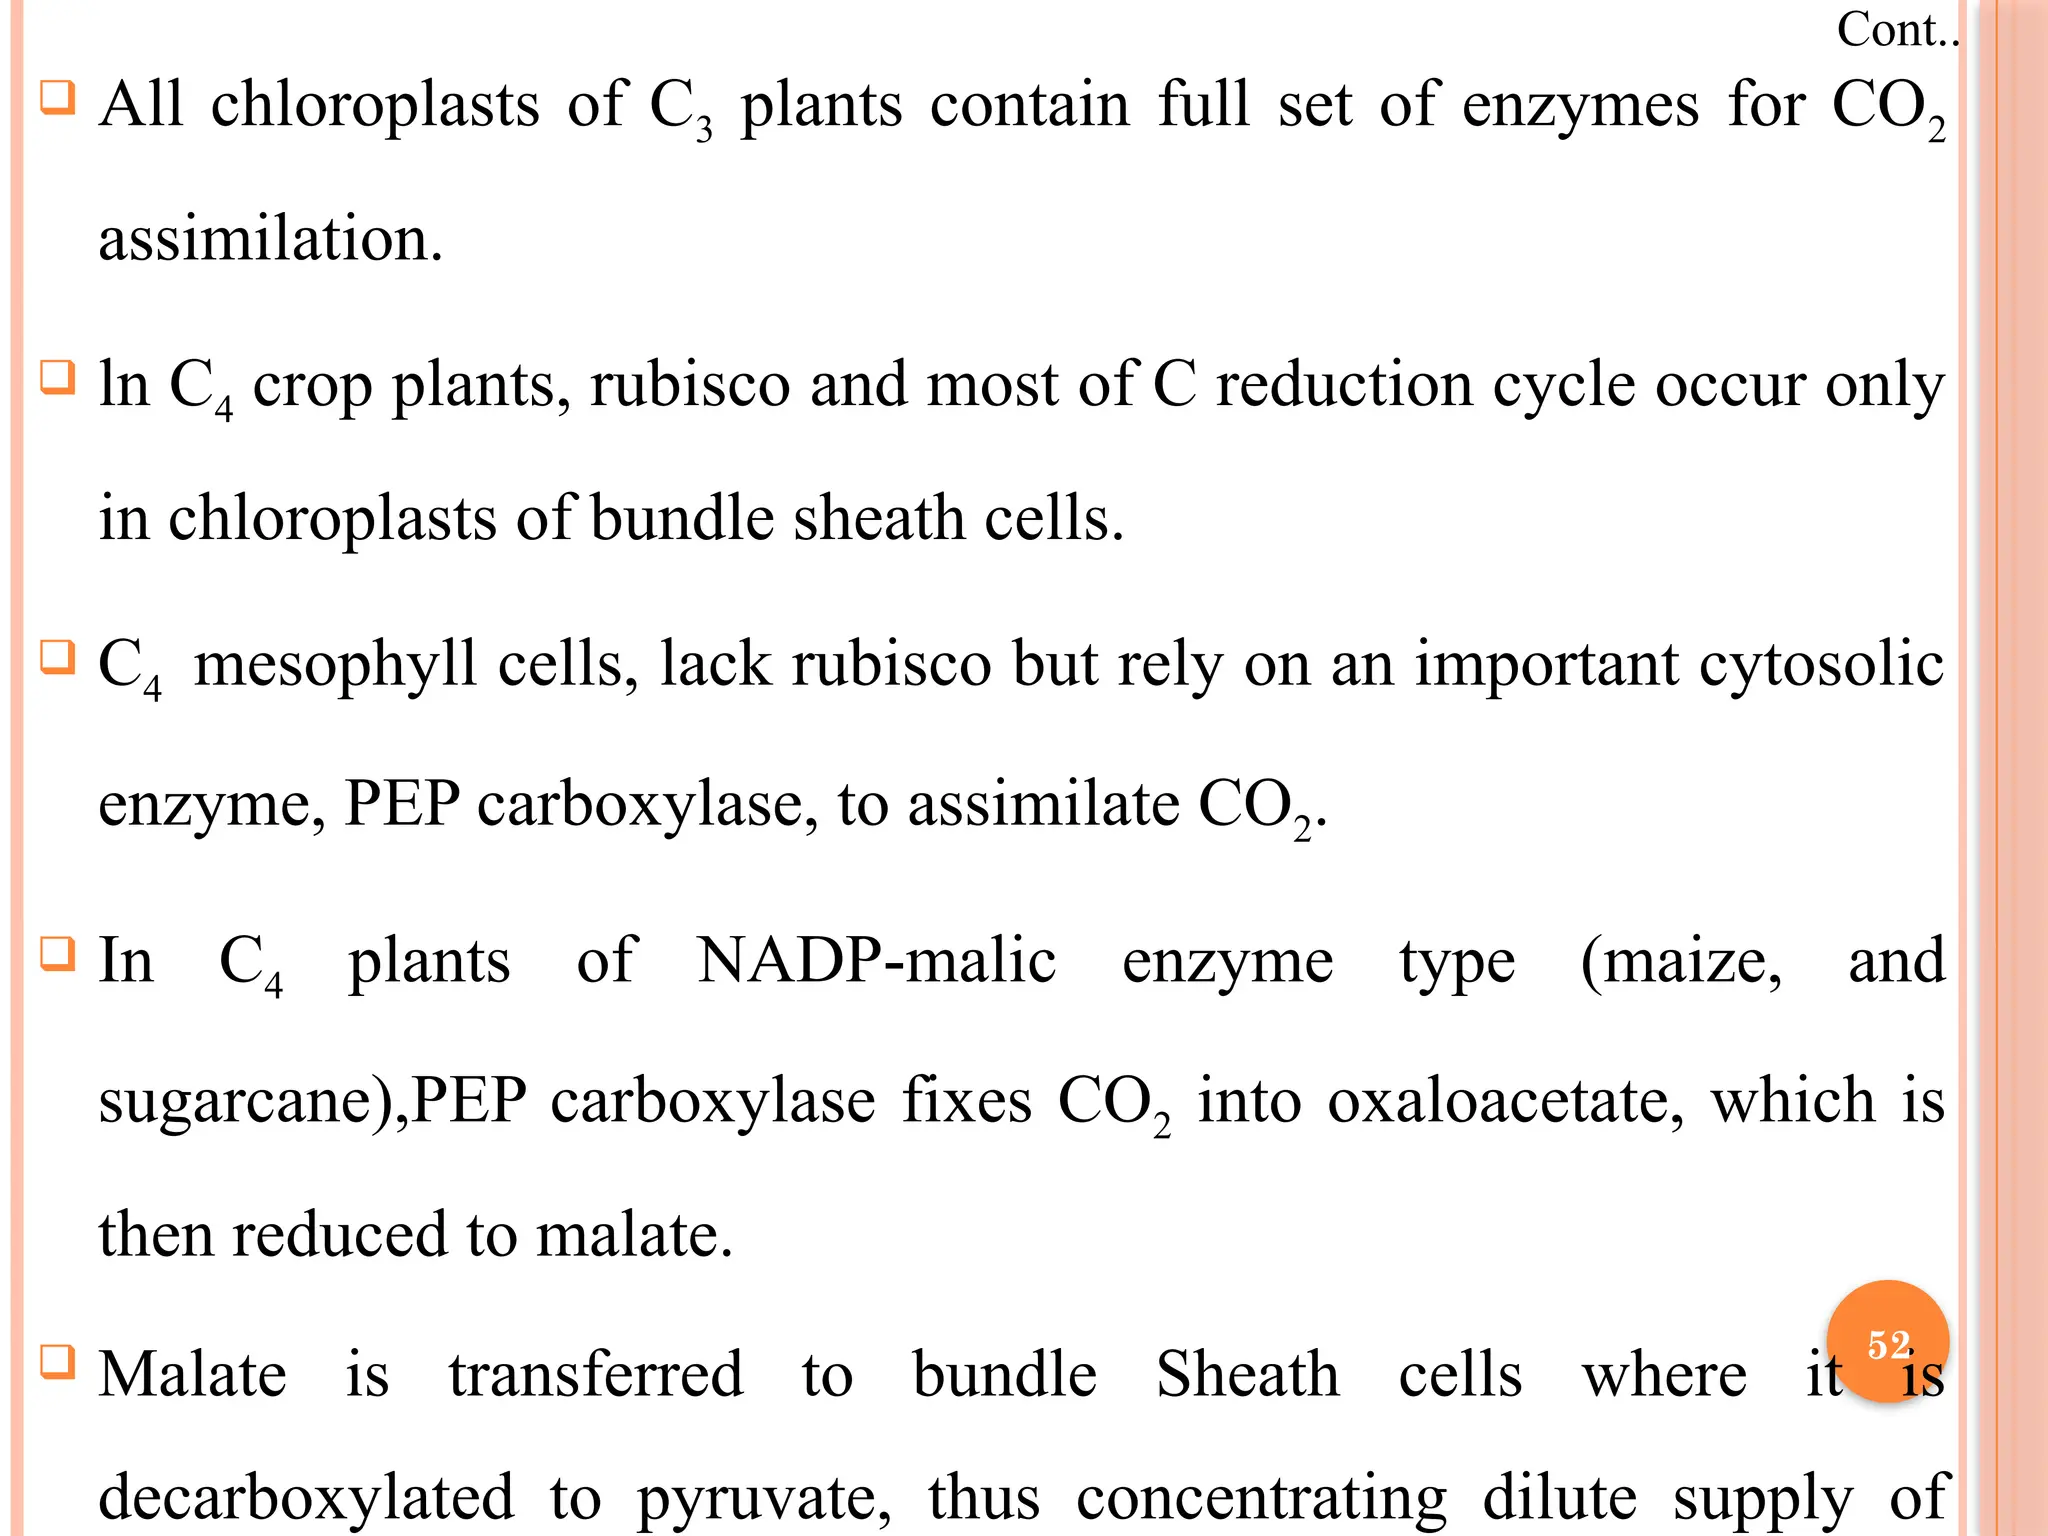
All chloroplastsof C3 plants contain full set of enzymes for CO2
assimilation.
ln C4 crop plants, rubisco and most of C reduction cycle occur only
in chloroplasts of bundle sheath cells.
C4 mesophyll cells, lack rubisco but rely on an important cytosolic
enzyme, PEP carboxylase, to assimilate CO2.
In C4 plants of NADP-malic enzyme type (maize, and
sugarcane),PEP carboxylase fixes CO2 into oxaloacetate, which is
then reduced to malate.
Malate is transferred to bundle Sheath cells where it is
decarboxylated to pyruvate, thus concentrating dilute supply of
Cont..
52
53.
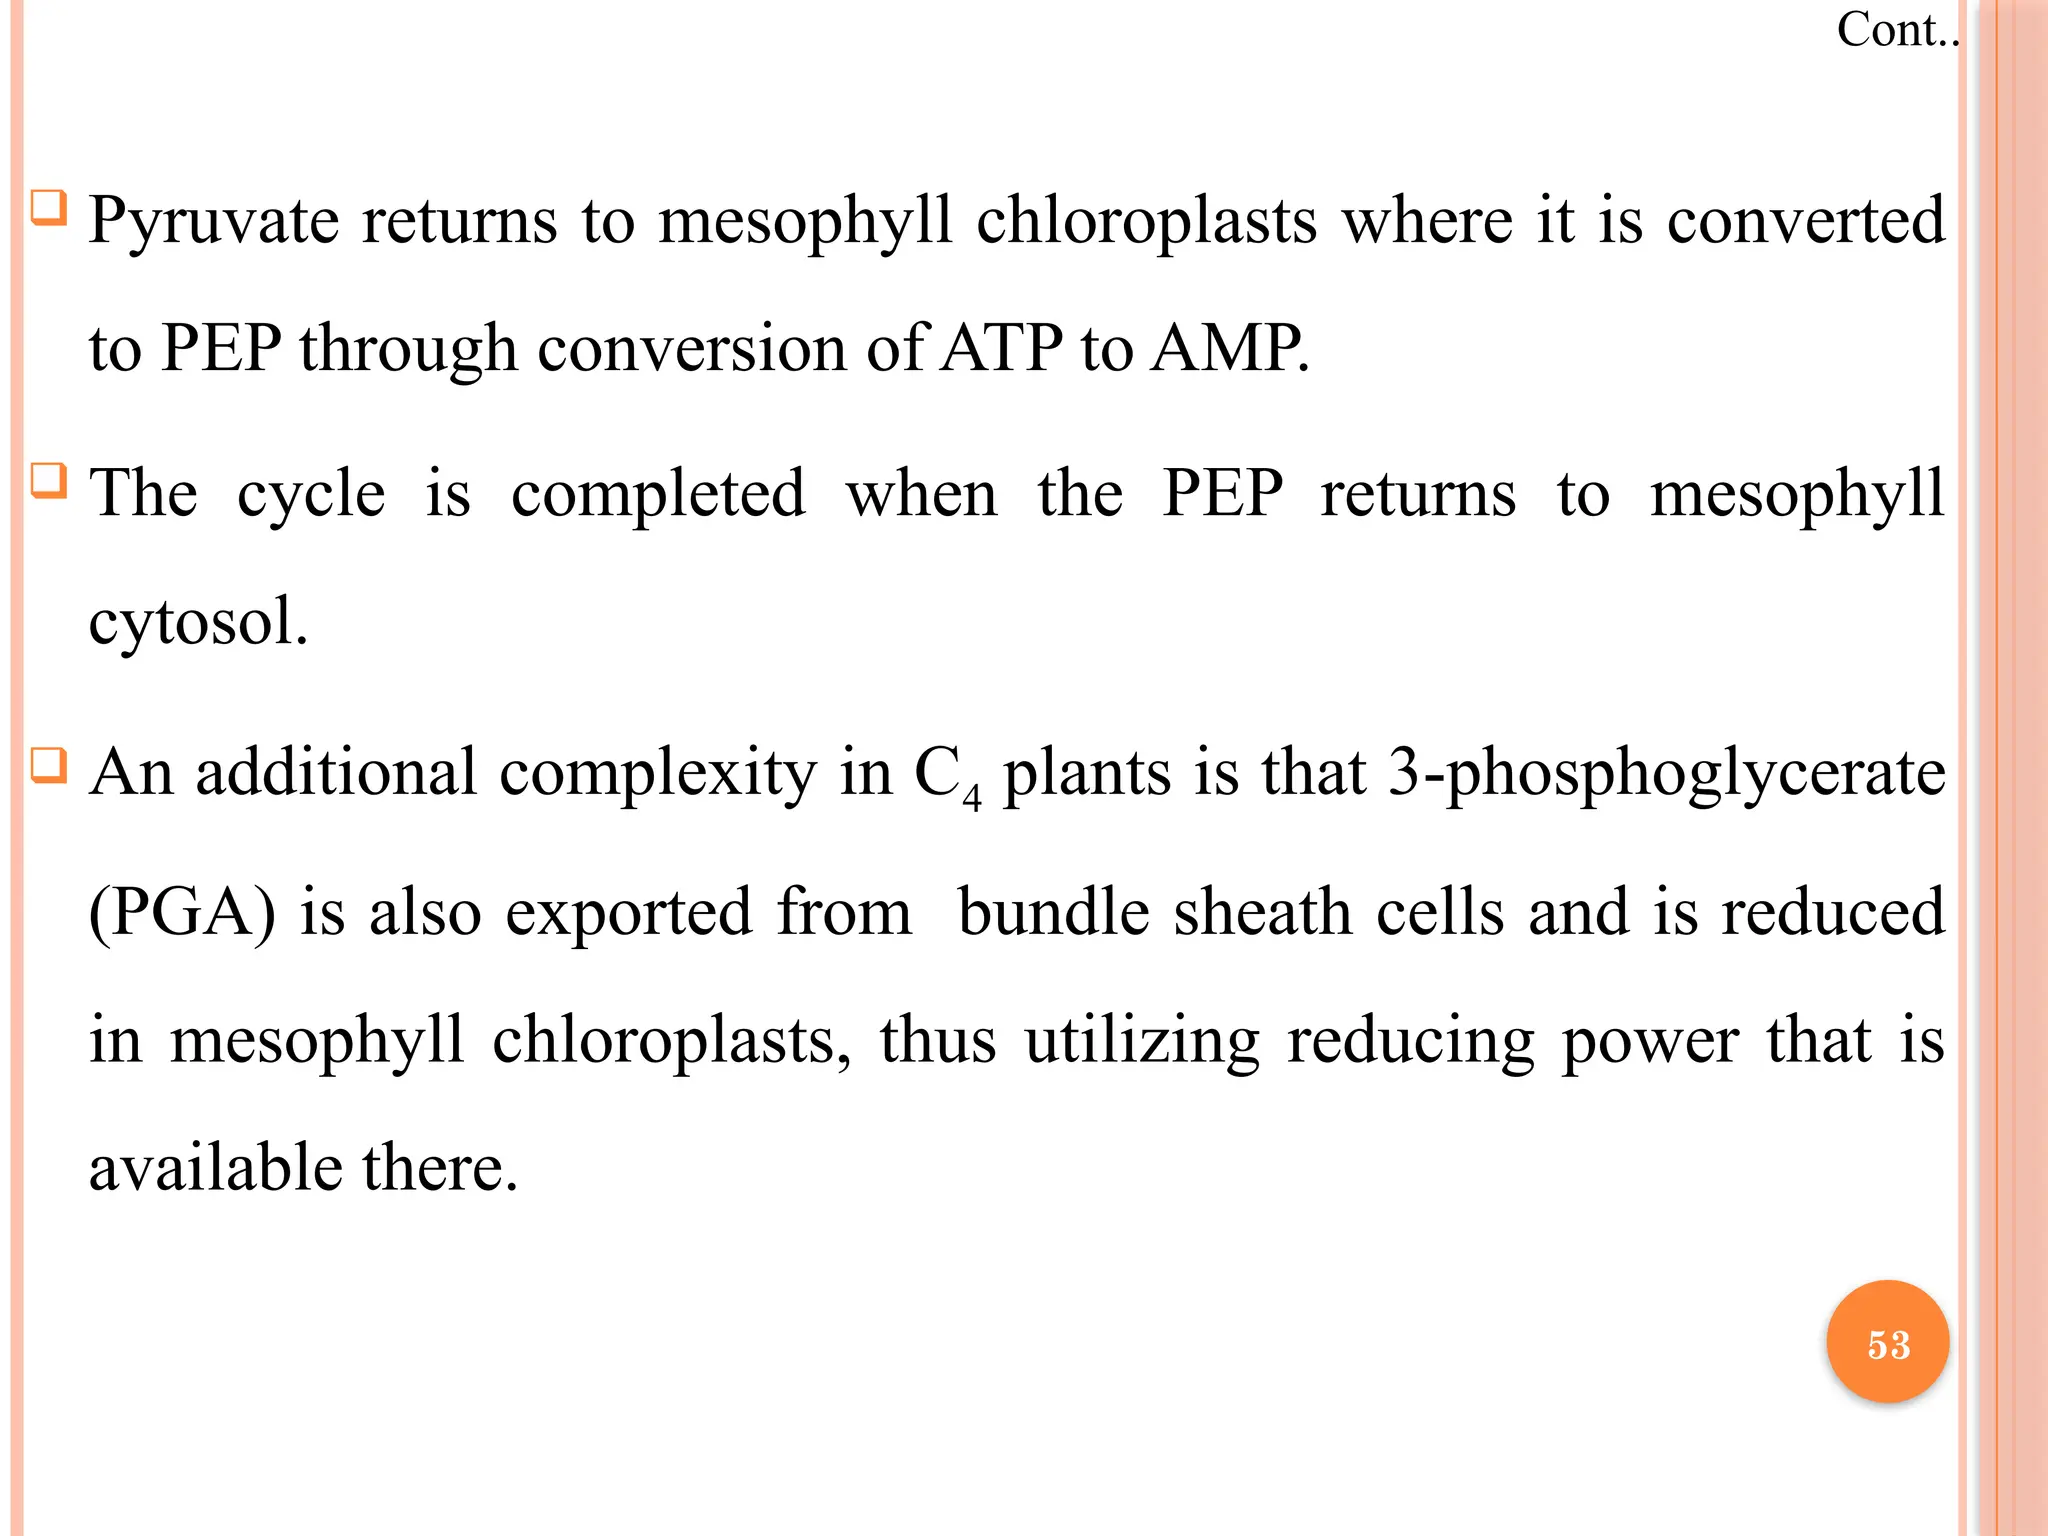
Pyruvate returnsto mesophyll chloroplasts where it is converted
to PEP through conversion of ATP to AMP.
The cycle is completed when the PEP returns to mesophyll
cytosol.
An additional complexity in C4 plants is that 3-phosphoglycerate
(PGA) is also exported from bundle sheath cells and is reduced
in mesophyll chloroplasts, thus utilizing reducing power that is
available there.
Cont..
53
54.
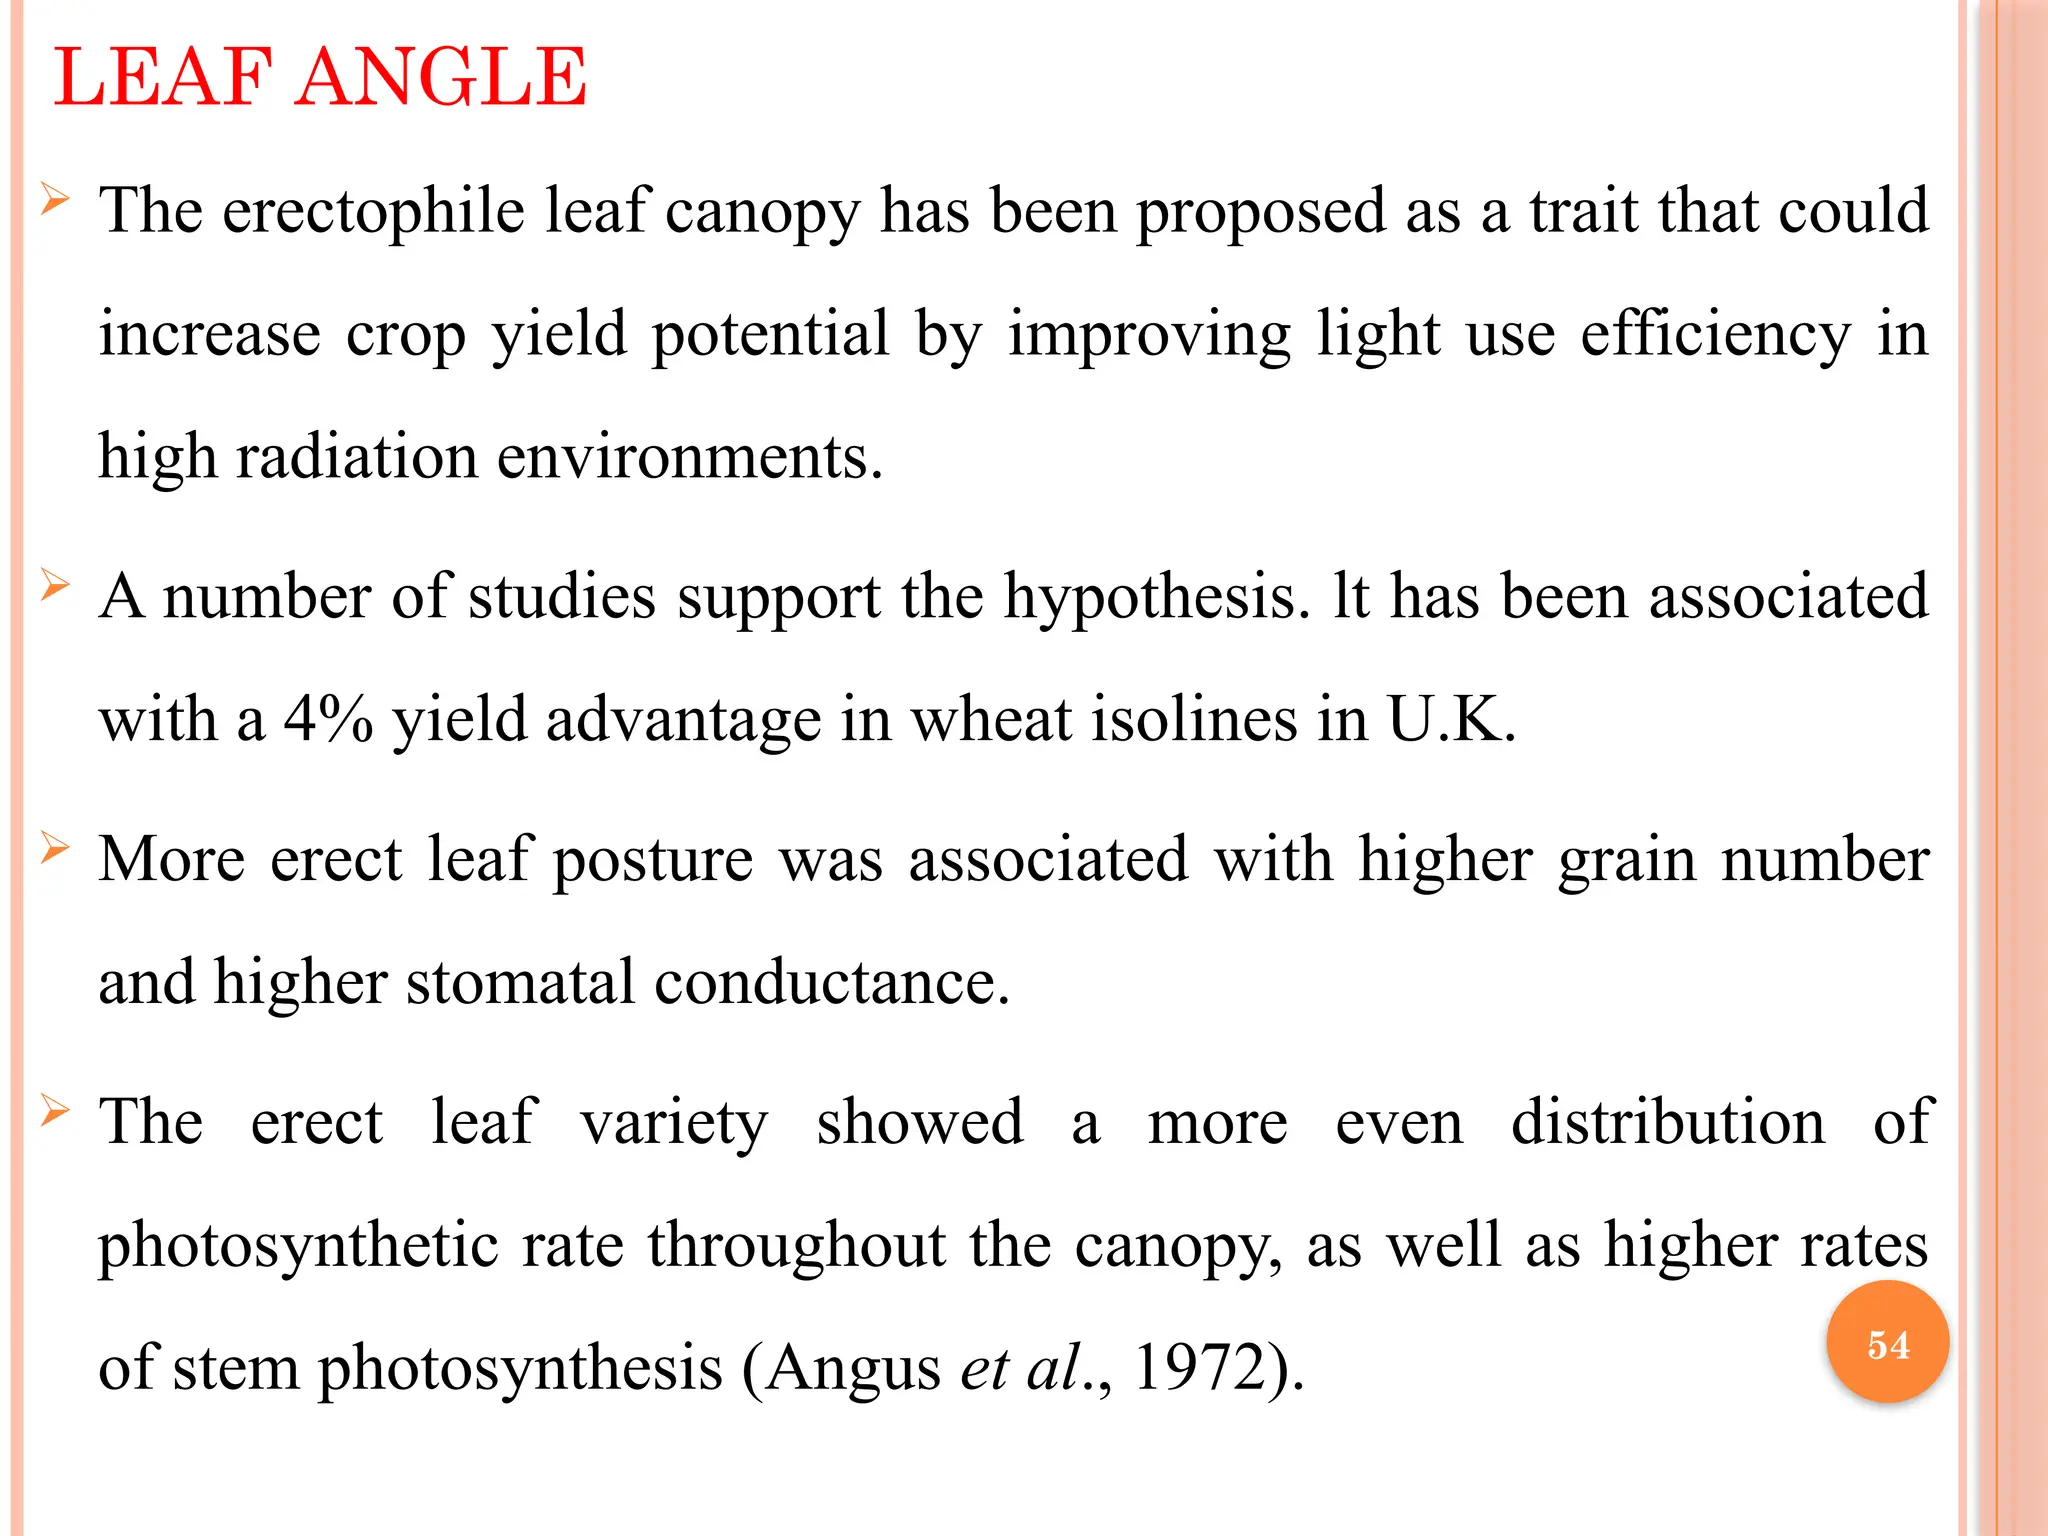
LEAF ANGLE
Theerectophile leaf canopy has been proposed as a trait that could
increase crop yield potential by improving light use efficiency in
high radiation environments.
A number of studies support the hypothesis. lt has been associated
with a 4% yield advantage in wheat isolines in U.K.
More erect leaf posture was associated with higher grain number
and higher stomatal conductance.
The erect leaf variety showed a more even distribution of
photosynthetic rate throughout the canopy, as well as higher rates
of stem photosynthesis (Angus et al., 1972). 54
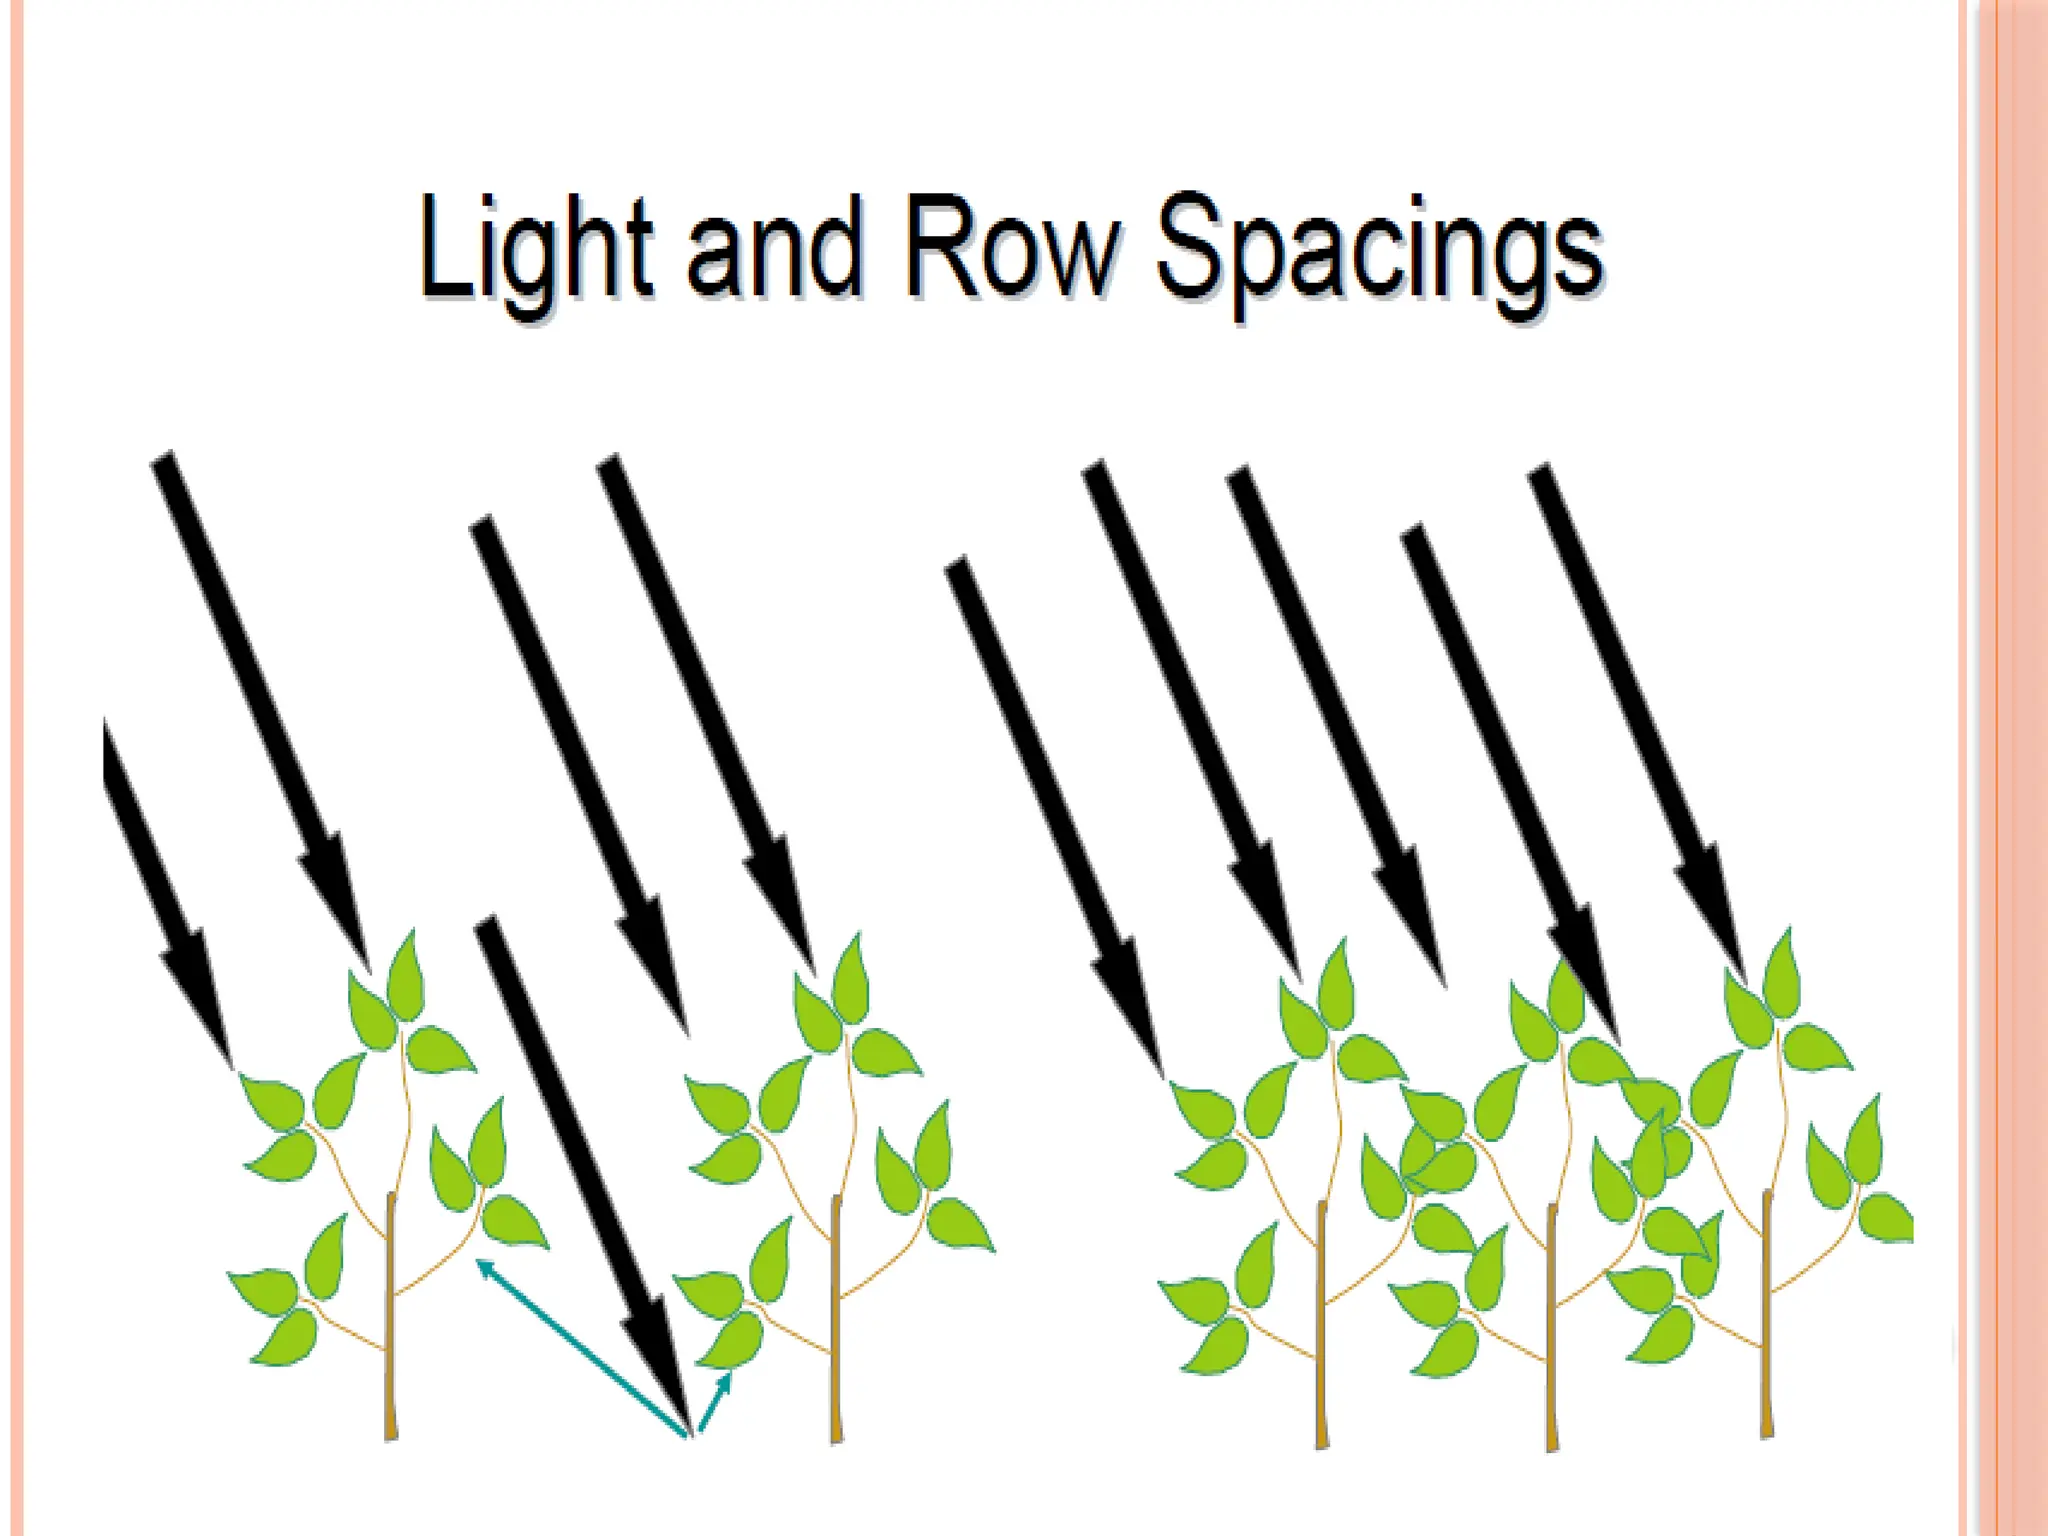
STEM RESERVES ANDGREEN LEAF AREA DURATION
There are a number of additional physiological traits that have
implications for yield potential and are related to increasing
assimilate availability (i.e., source).
One is ability to reach full ground cover as early as possible after
emergence to maximize interception of radiation (Richards, 1996).
Another is remobilization of soluble carbohydrates (stem
reserves)during grain filling. A third is ability to maintain green leaf
area duration ("stay-green") throughout grain filling.
Direct evidence for contribution of these traits to high yield
potential is lacking.
57
58.
Stem reservesapparently make a greater contribution to
performance in relative low-yielding lines where contrasting lines
have been examined (Austin et al., 1980 b).
lt is been suggested that use of stem reserves and stay-green may
be mutually exclusive, since loss of chlorophyll and stem reserve
mobilization seem to be consequences of plant senescence.
A greater understanding of genetics of these traits is called for to
establish potential for breaking such linkage.
As yield potential is raised by improving reproductive sinks, extra
assimilates gained by increasing early ground cover could
contribute to increased stem reserves and be tapped at later
Cont..
58
59.
ACCLIMATION
Crops exposedto fluctuating conditions of light and temperature
and supplies of water and nutrients, and have evolved with a leaf-
level photosynthetic apparatus that is highly flexible in structure
and activity.
Depending upon environment, leaves develop with different
numbers and sizes of cells, different numbers of chloroplasts per
cell and with variations in amounts and proportions of thylakoid
and carbon-reduction-cycle components.
Changes in these factors seems more related to photosynthetic
activity per unit C and N invested in leaf structure than per unit
leaf area.
59
60.
Acclimativie changesdepend on light environment and position in
the canopy and continue on a time scale of days to weeks
throughout the life of a leaf.
Acclimation to light is proportion to mean daily irradiance of leaf
rather than to peak irradiance (Chabot et al., 1979).
This ability is important because new leaves generally emerge at
top of a crop in full sun and later are submerged into shade of
canopy as other leaves develop above them.
C3 leaves in full sun typically have more of their leaf N involved
in electron transport and carbon reduction and less in light
harvesting (and fewer grana stacks) than is case for shade leaves.
Cont..
60
61.
These propertiesalso vary with depth within leaf from its sunlit
surface.
ln Evans‘ (1993) study of alfaalfa canopies, soluble proteins (e.g.
rubisco) declined more with depth in the canopy than did thylakoid
proteins.
In addition chlorophyll a/b decreased with increasing depth in
canopy, reflecting a decline in reaction centers relative to light-
harvesting antennae.
These changes resulted in a decline in chloroplast N/chlorophyll in
a way that maintained photosynthetic capacity per unit N, a key
train for optimal distribution of N within the canopy.
Cont..
61
62.
Leaf adjustmentsto limiting supplies of N are especially important
involving changes in number and size of new leaves as well as in
proportions of thylakoid and carbon-reduction-cycle components
with depth in canopy.
Optimal distribution of N among leaves within a canopy is
important and has received attention in recent years.
Problem also involves canopy architecture, solar track sky
condition, and time remaning in season.
For young crops with small leaf area, increasing leaf area for
greater radiation interception provides more benefits than
increasing photosynthetic capacity of existing leaves (through
greater N content per unit leaf area).
Cont..
62
63.
ROOTS
Work withRht isolines of wheat in Argentina indicated that shorter
lines had a higher investment in root length and dry weight at
anthesis than the tall ones, in the top 30 cm of soil (Miralles et al.,
1997).
The proportion of total respiration resulting from root activity has
apparently declined in more modern Russian spring wheat
(Koshkin and Tararina, 1989).
Biochemical signals, elicited by reduced soil water potential, have
been shown to cause reduced stomatal conductance well in
advance of leaf water deficit (Davies and Zang, 1991). 63
64.
The traitprobably evolved to increase the likelihood of
completing a genotype’s life cycle under unpredictably dry
conditions.
However, researchers need to test hypothesis that the root
signaling may limit productivity in irrigated crops by reducing
stomatal conductance (and therefore the potential for CO2
assimilation ) as roots detect progressively drying soils prior to
scheduled irrigation.
Cont..
64
65.
PHOTORESPIRATION
In mostplants (C3 plants), initial fixation of CO2, via rubisco,
forms a three-carbon compound (3-phosphoglycerate)
In photorespiration, rubisco adds O2 instead of CO2 in the Calvin
cycle, producing a two-carbon compound
Photorespiration consumes O2 and organic fuel and releases CO2
without producing ATP or sugar
In many plants, photorespiration is a problem because on
a hot, dry day it can drain as much as 50% of the carbon
fixed by the Calvin cycle
RESPIRATION AND BIOSYNTHESIS
65
66.
The Respiratory System
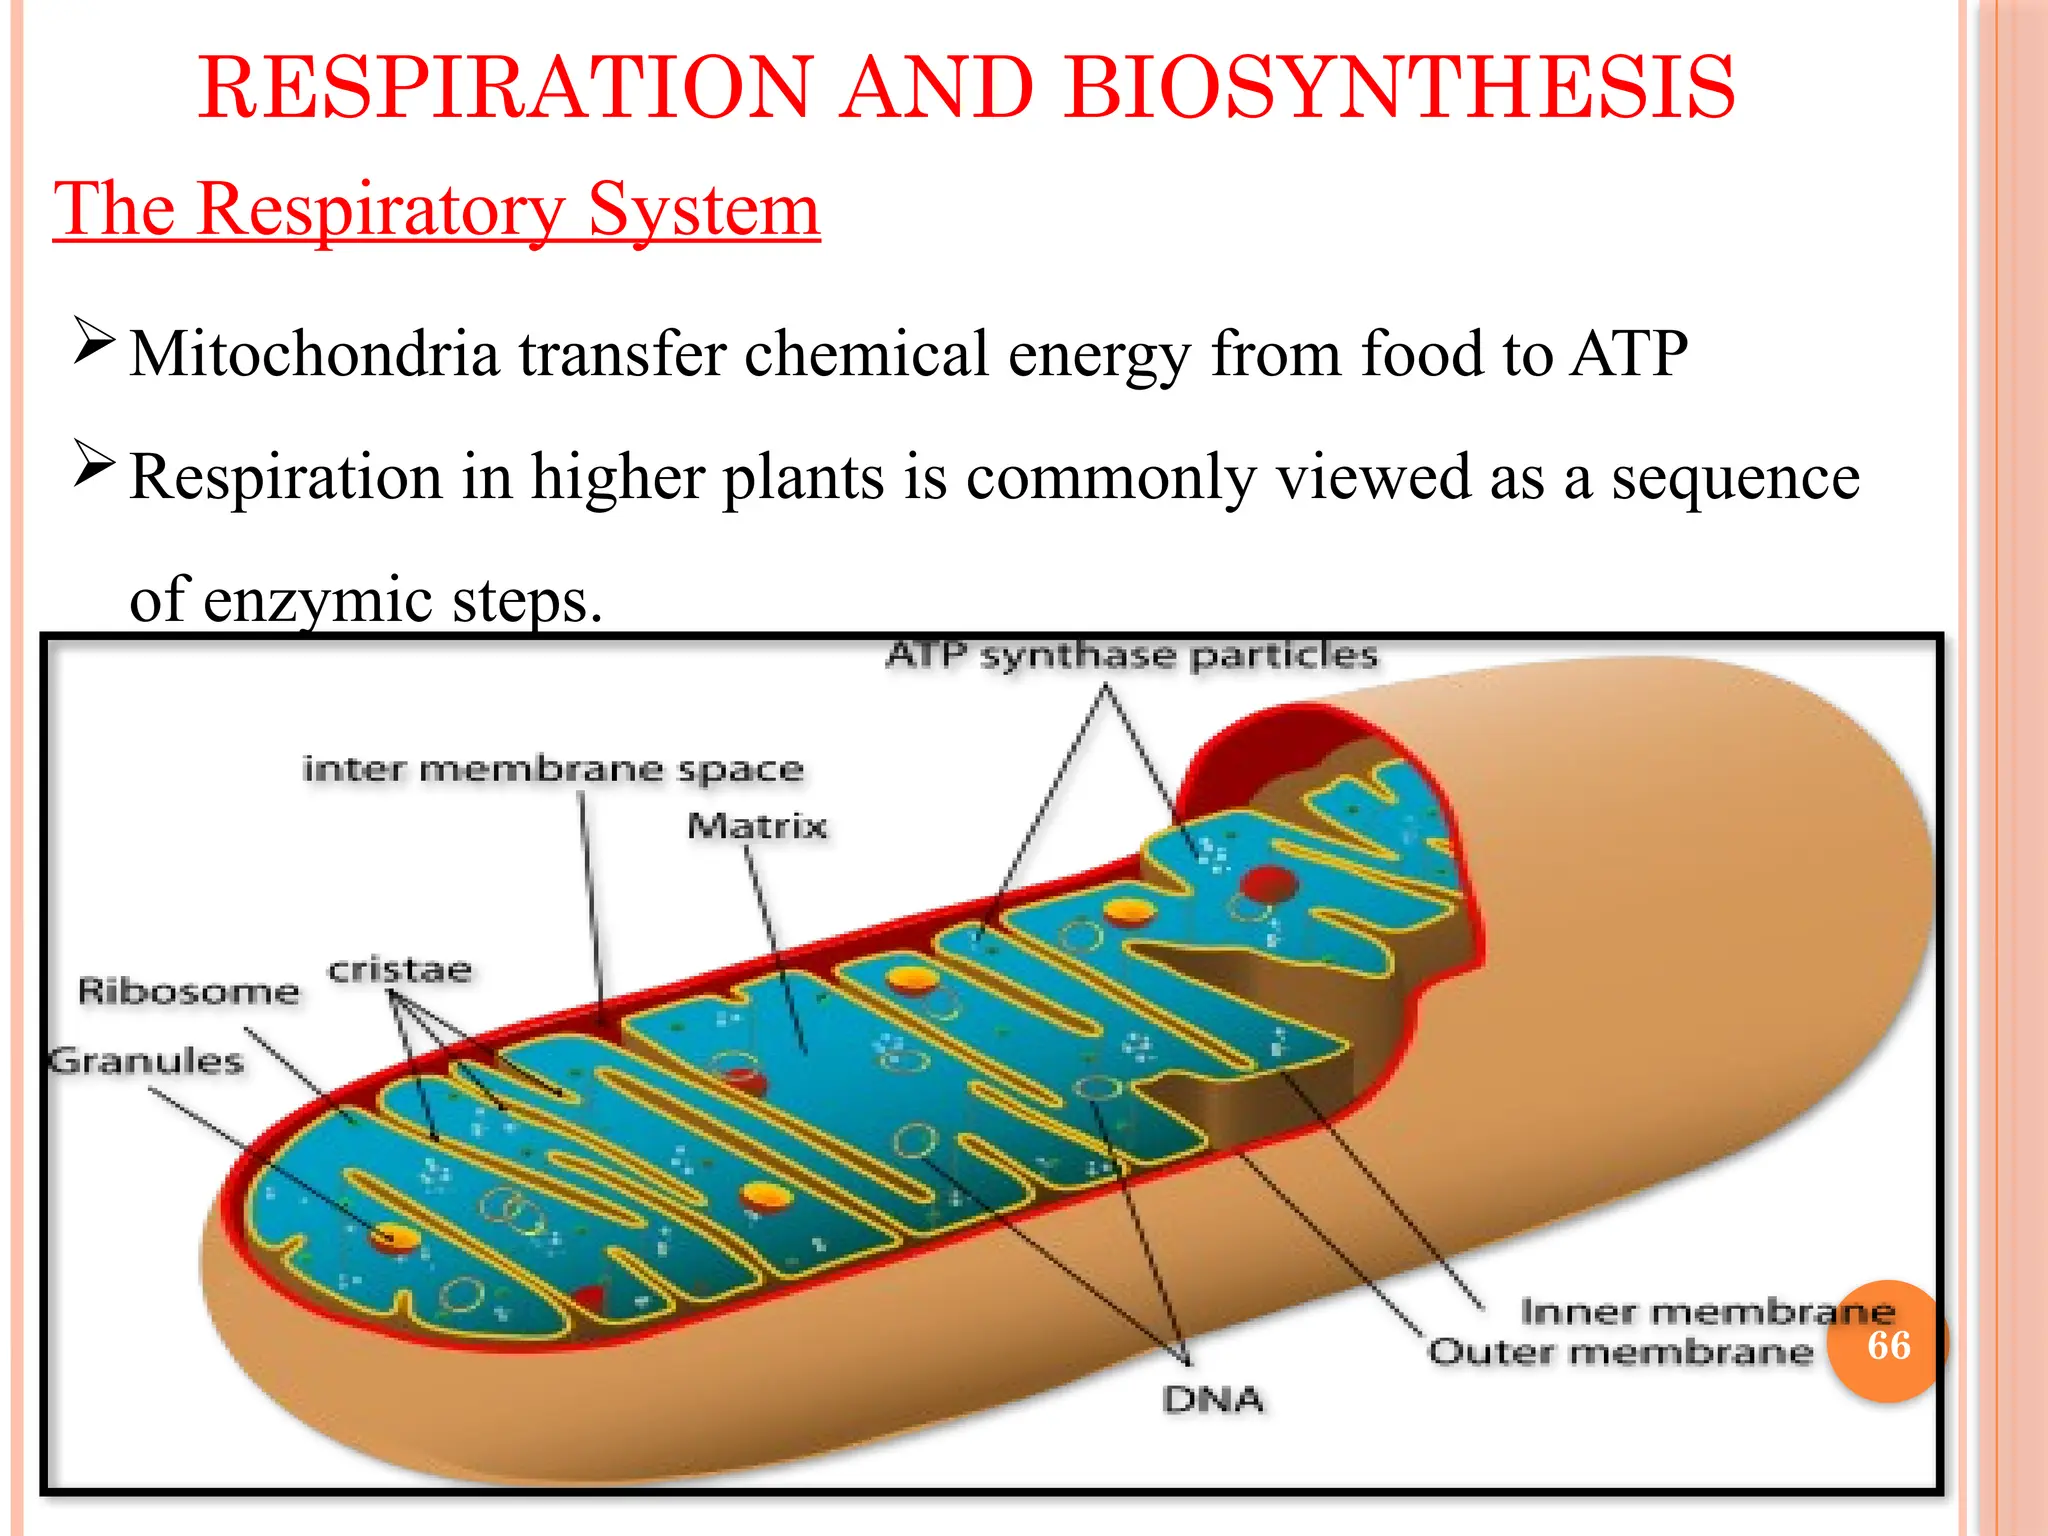
Mitochondriatransfer chemical energy from food to ATP
Respiration in higher plants is commonly viewed as a sequence
of enzymic steps.
RESPIRATION AND BIOSYNTHESIS
66
67.
With hexoseas a generic substrate, flow of carbon can be traced
through glycolytic pathway (found incytosol and plastids) to
tricarboxylic acid (TCA) cycle in matrix solution of mitochondria.
Mitochondria, like chloroplasts, are enclosed by an outer
membrane that encompasses a convoluted inner membrane, inside
which is matrix.
An interesting point is that pyrophosphate (PPi),rather than ATP,
can be used in phosphorylating hexose at the start of glycolytic
scheme and this may be an essential process in some plants in
mitochondrial electron transport chain.
Cont..
67
68.
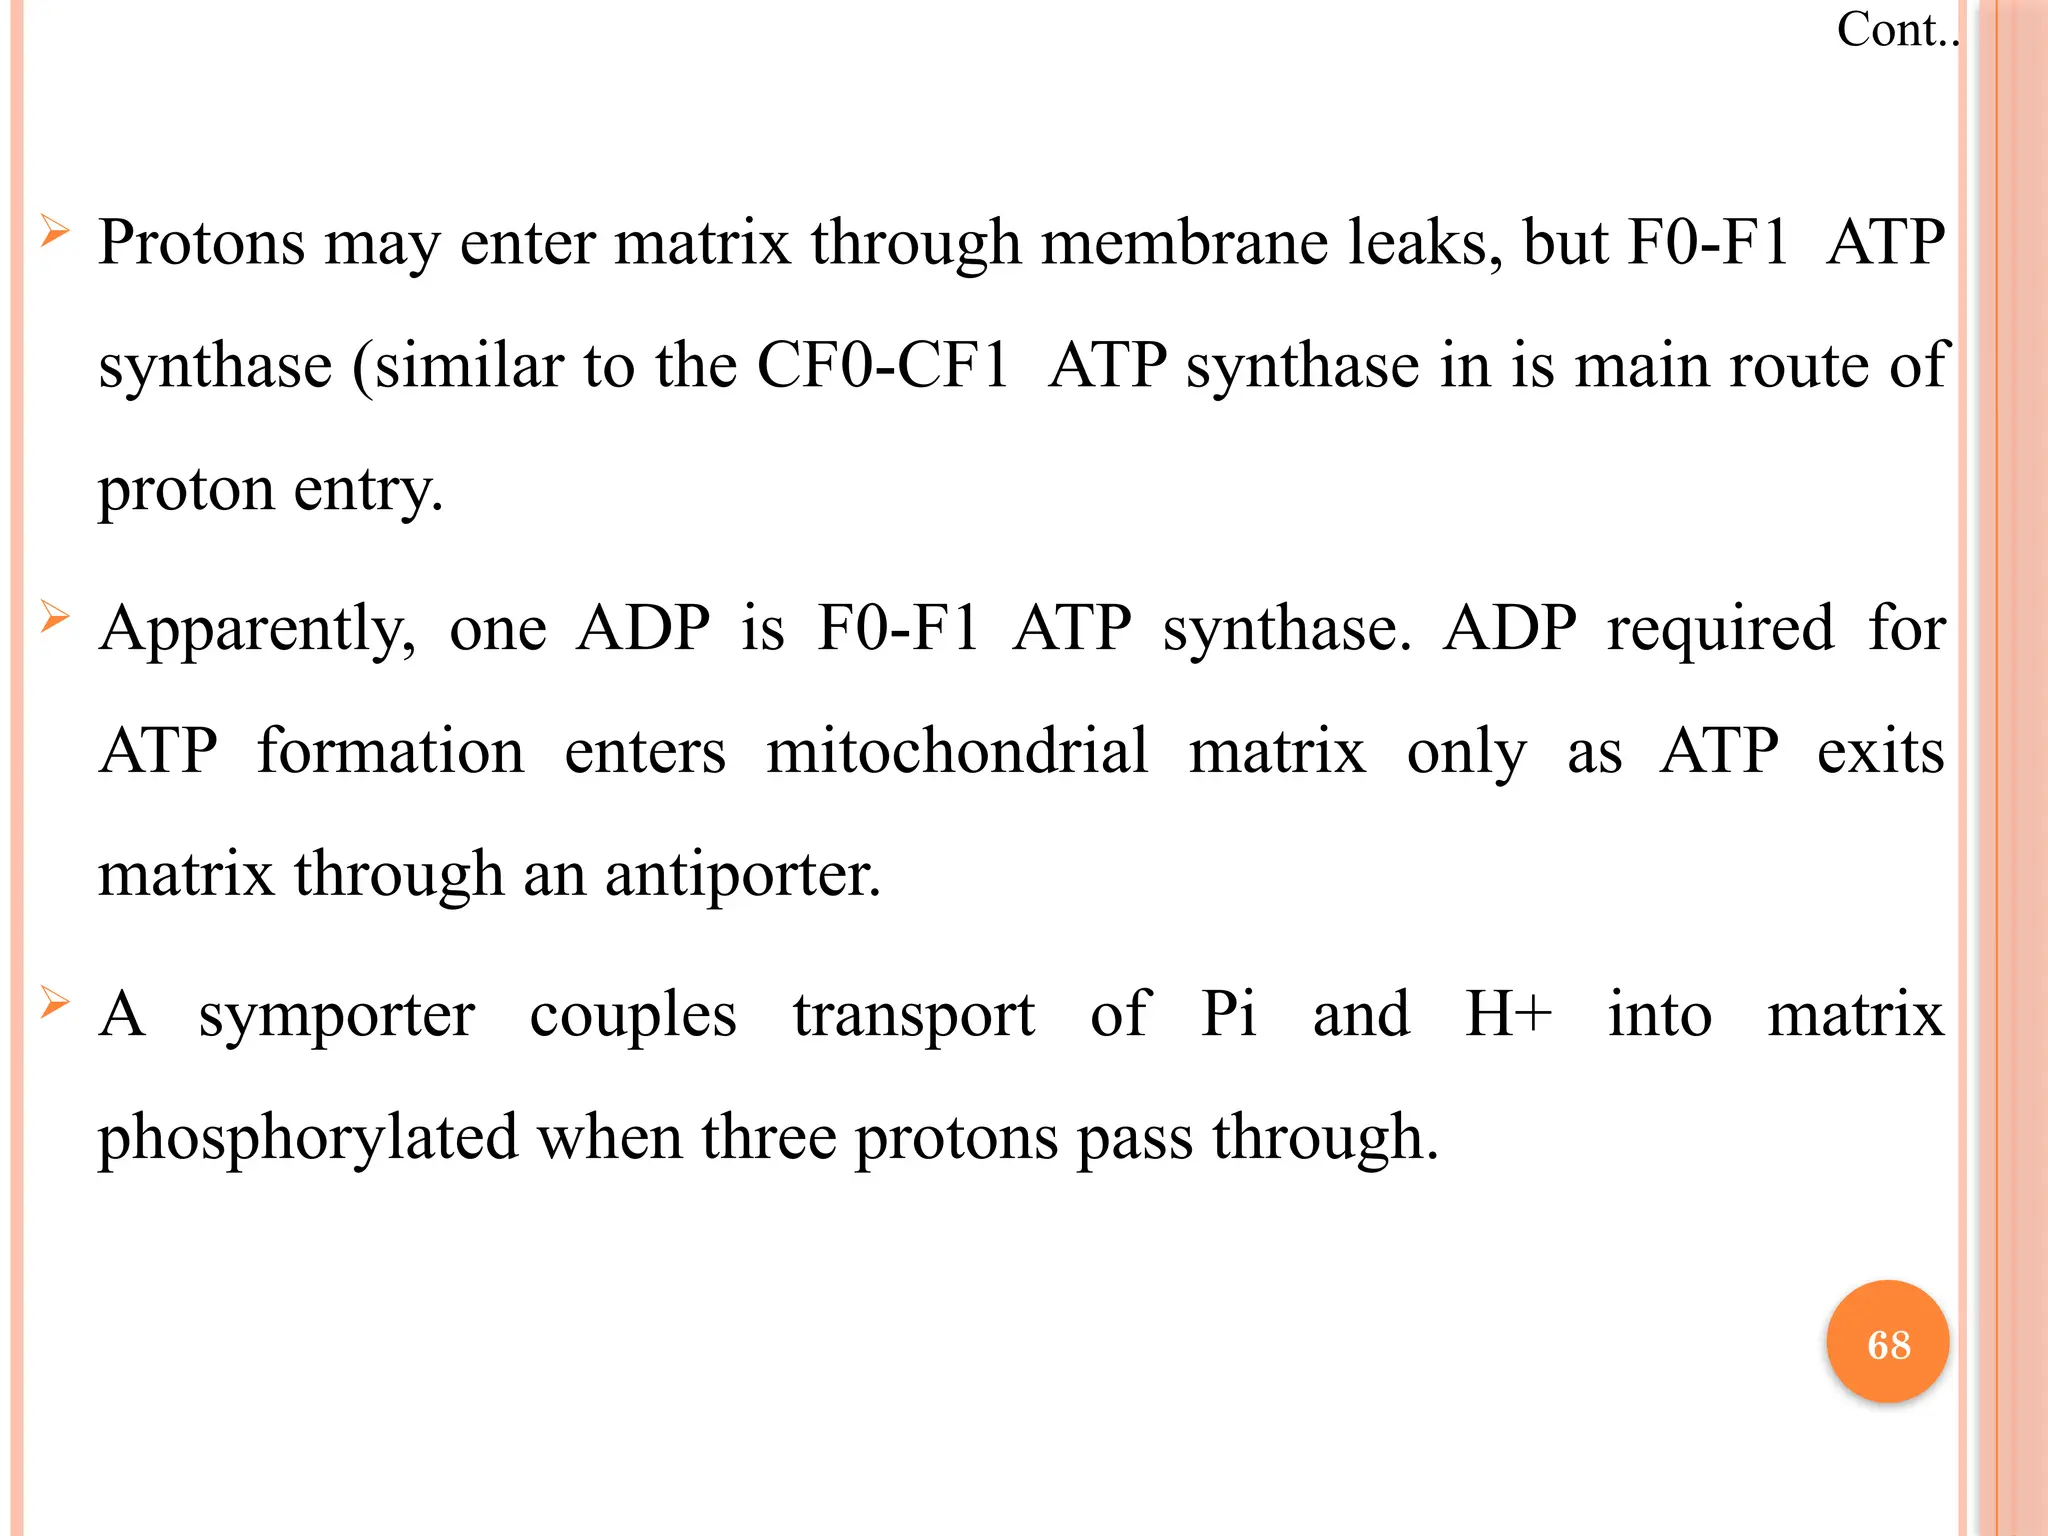
Protons mayenter matrix through membrane leaks, but F0-F1 ATP
synthase (similar to the CF0-CF1 ATP synthase in is main route of
proton entry.
Apparently, one ADP is F0-F1 ATP synthase. ADP required for
ATP formation enters mitochondrial matrix only as ATP exits
matrix through an antiporter.
A symporter couples transport of Pi and H+ into matrix
phosphorylated when three protons pass through.
Cont..
68
69.
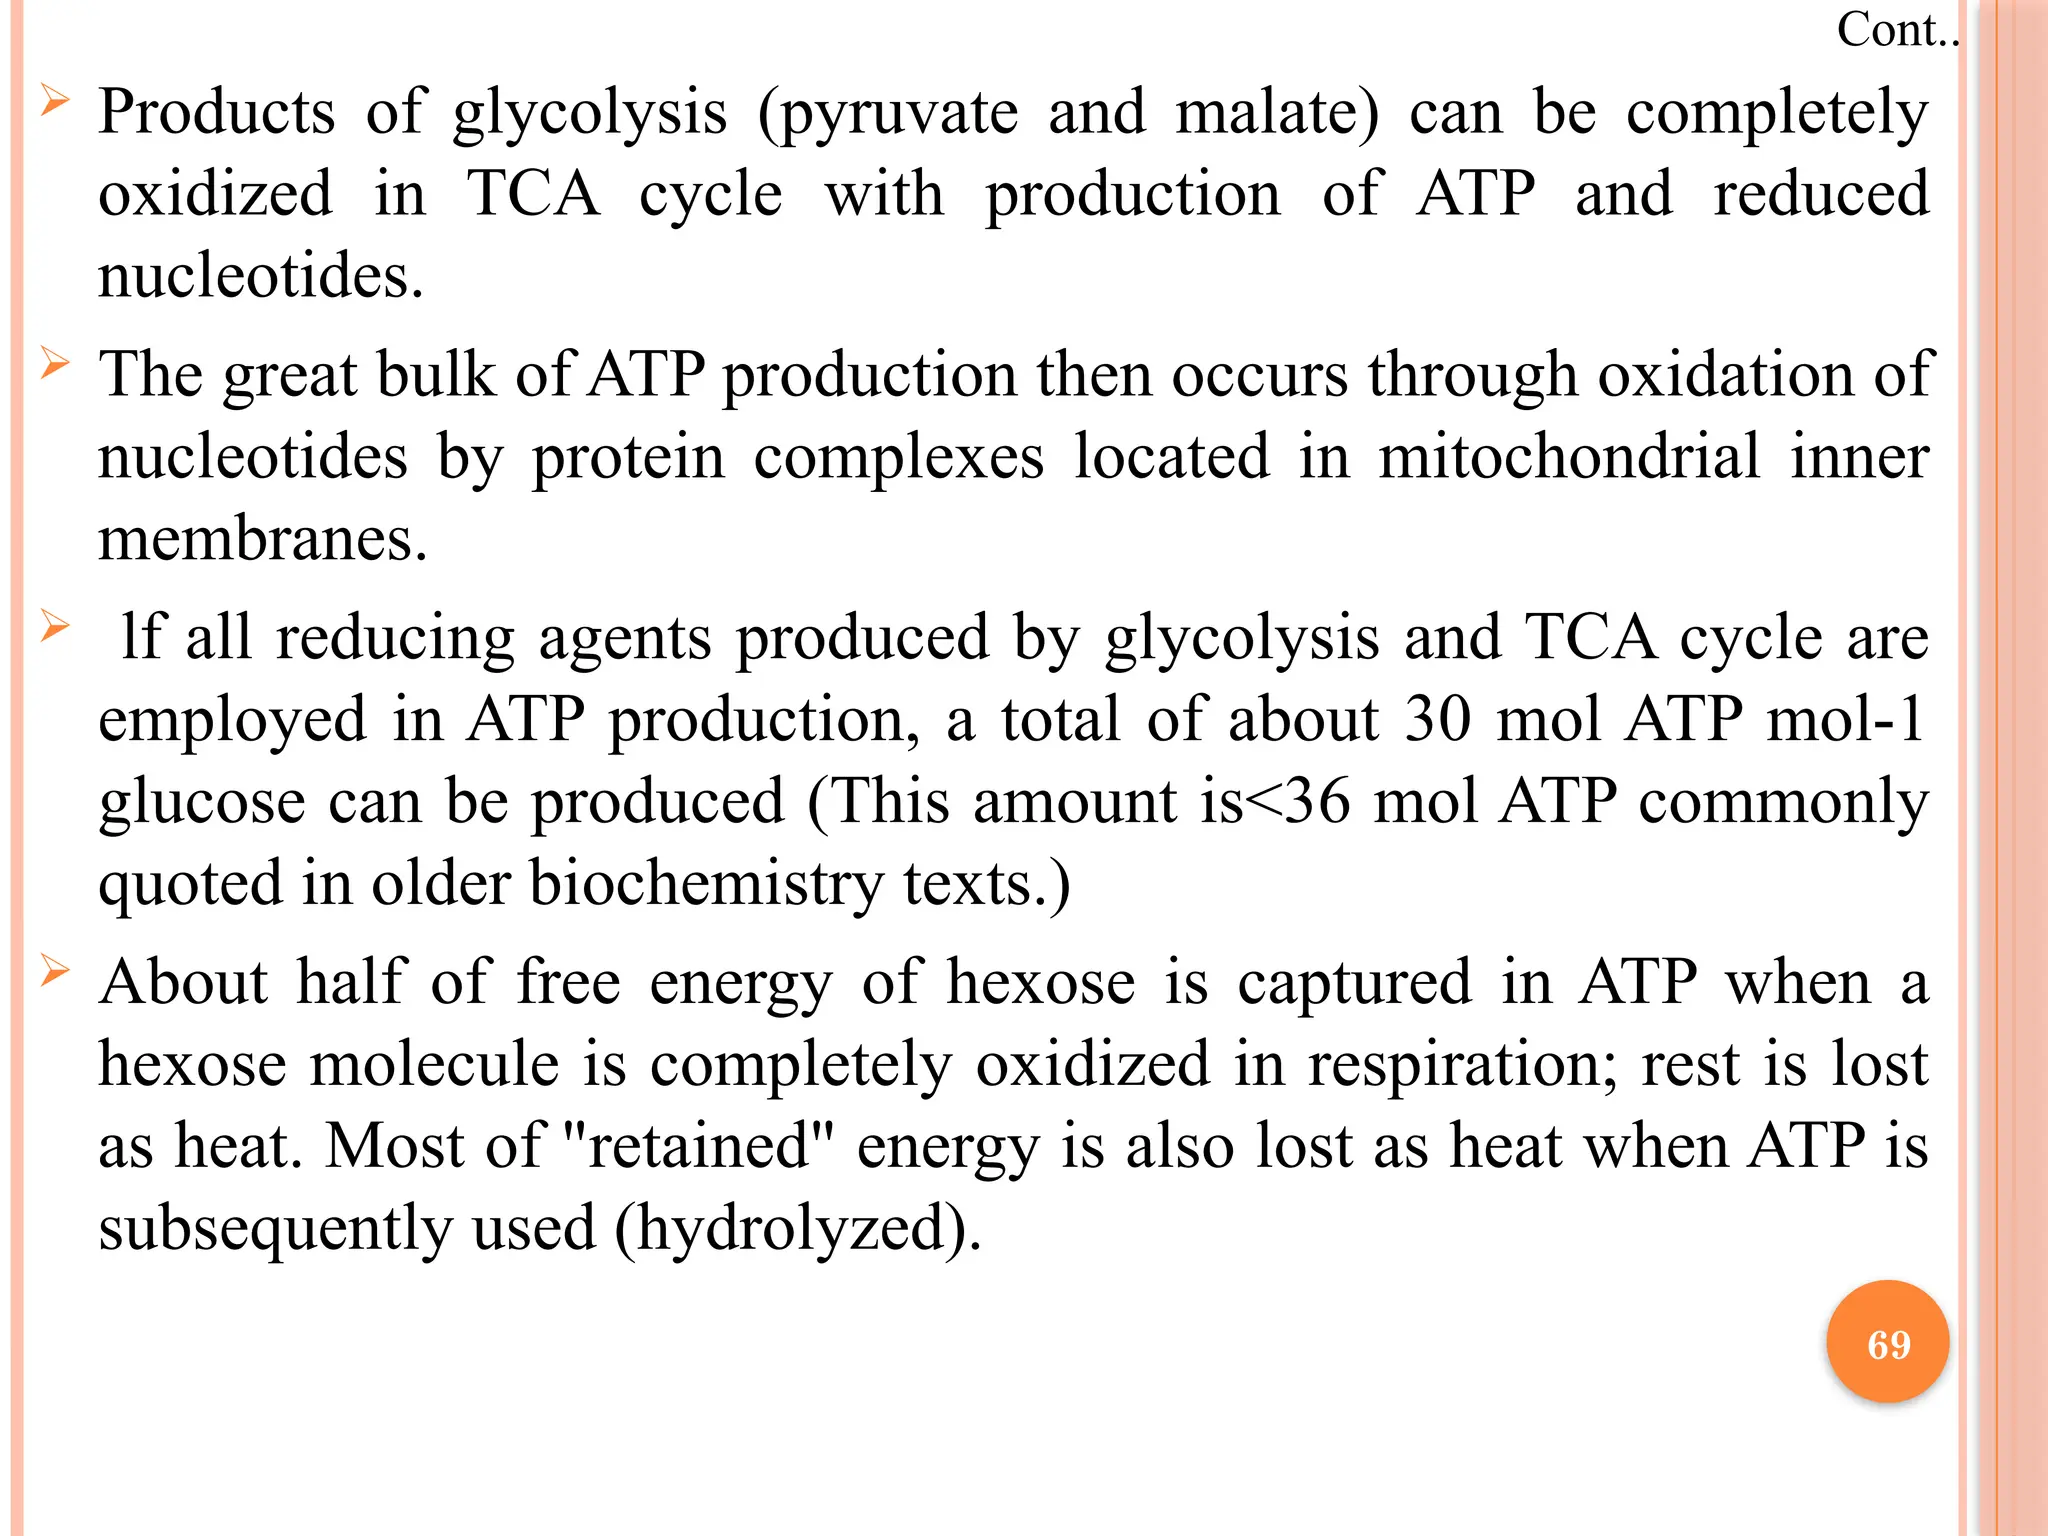
Products ofglycolysis (pyruvate and malate) can be completely
oxidized in TCA cycle with production of ATP and reduced
nucleotides.
The great bulk of ATP production then occurs through oxidation of
nucleotides by protein complexes located in mitochondrial inner
membranes.
lf all reducing agents produced by glycolysis and TCA cycle are
employed in ATP production, a total of about 30 mol ATP mol-1
glucose can be produced (This amount is<36 mol ATP commonly
quoted in older biochemistry texts.)
About half of free energy of hexose is captured in ATP when a
hexose molecule is completely oxidized in respiration; rest is lost
as heat. Most of "retained" energy is also lost as heat when ATP is
subsequently used (hydrolyzed).
Cont..
69
70.
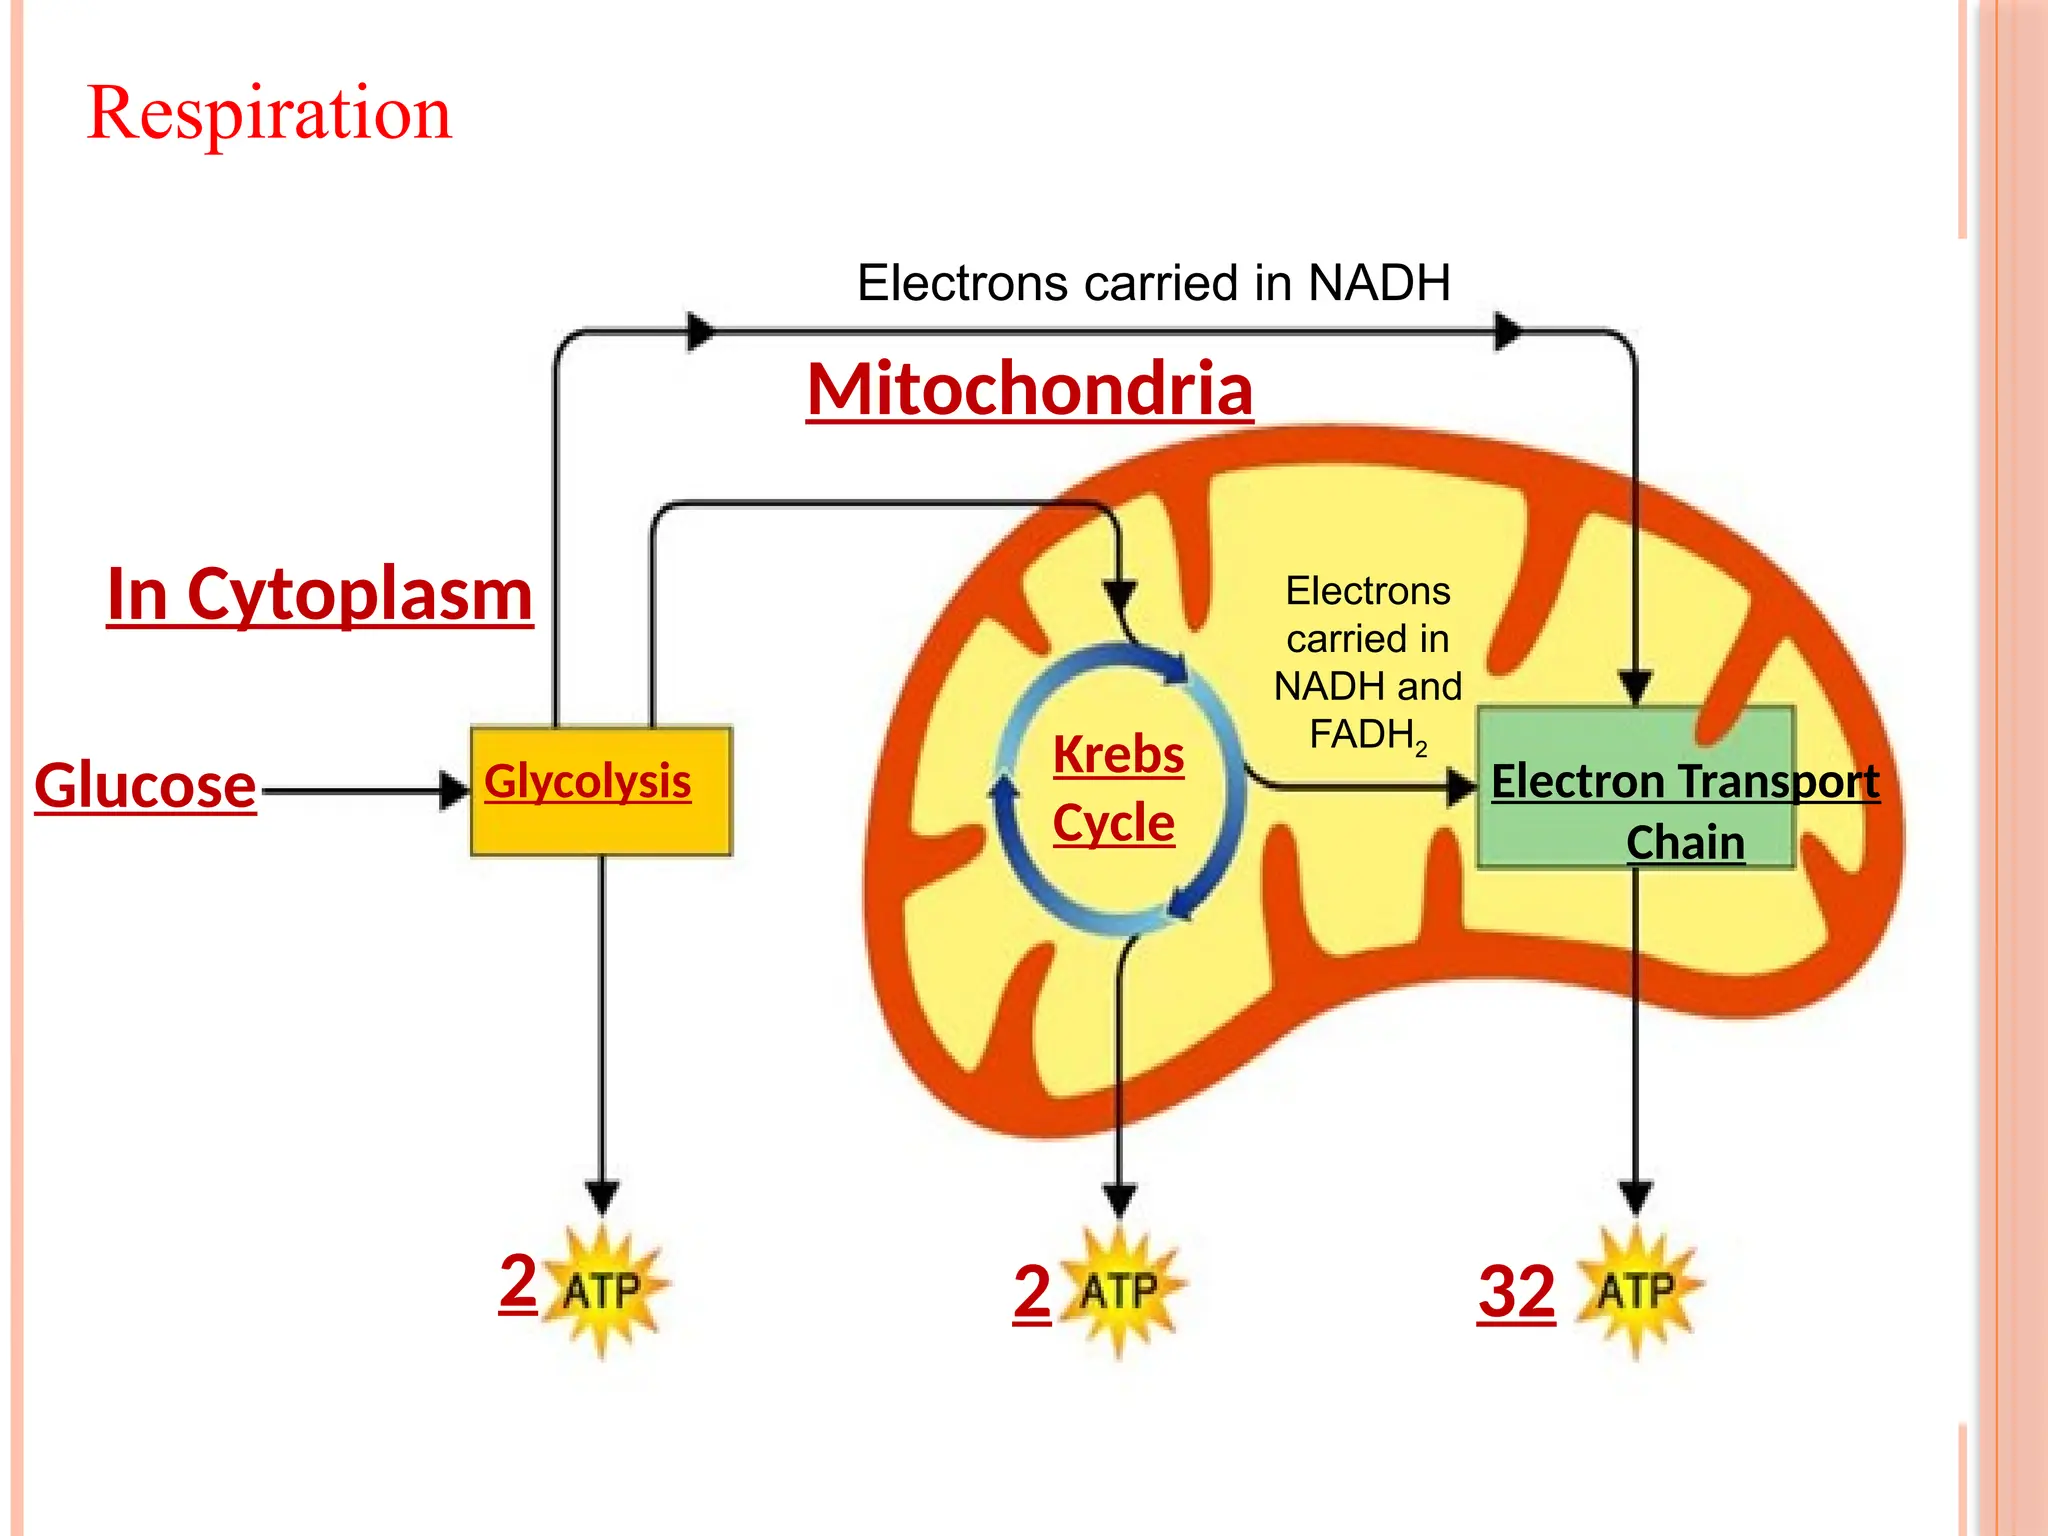
Glucose Glycolysis ElectronTransport
Chain
2
Krebs
Cycle
Mitochondria
In Cytoplasm
2 32
Electrons carried in NADH
Electrons
carried in
NADH and
FADH2
Respiration
70
71.
ALTERNATIVE OXIDASE
Thealternative oxidase found in mitochondria deserves special
comment, Electrons that pass to this oxidase bypass two sites
(complexes Ill and IV) of proton translocation with the result that
less ATP is formed.
There is no evidence that it has significant impact on crop
performance.
71
72.
PROMISING NEW APPROACHESTO
ACCELERATE YIELD GAINS
Breeding programs worldwide have achieved significant genetic
gains in yield potential.
Nonetheless, there is consensus among breeders as well as
physiologists that while the contribution from physiology has been
modest, its contribution to breeding is expected to be larger in the
next 20 years (Jackson et al., l996).
There are perhaps two main reasons for this. One is based on need.
This means that current trends in the improvement of genetic yield
potential are too low to keep pace with future demand.
72
73.
The secondis probably based on justifiable optimism. Several
studies suggest that some new selection technologies have real
potential to complement conventional breeding programs in the
areas of biotechnology (Tanskley and Nelson, 1996) and
physiology (Richards et al., 1996; Fischer et al., 1998;
Reynolds et al., 1998).
At a recent consultation on raising yield potential, successful
breeders suggested a number of strategies for increasing genetic
gains in yield potential.
Cont..
73
74.
While thepivotal role of recombining elite germplasm was
recognized, it was also agreed that significant jumps in yield
potential will almost certainly require introgression of new
genes from diverse sources.
This will permit evaluation of new yield-determining genes in
different background.
Development of improved early-generation selection criteria
was also among the recommendation highlighted by the group.
Cont..
74
75.
USING PHYSIOLOGICAL TOOLSTO COMPLEMENT
EMPIRICAL SELECTION
While morphological traits associated with yield, such as grain
number and HI, can be used in visual selection of breeding lines,
neither trait is reliably expressed in small pots, or at low density
in early generations.
However, there is now good evidences that certain physiological
traits have potential for improving selection efficiency.
An integrated CTD value can be measured almost
instantaneously using an infrared (IR) thermometer on scores of
plants in a small breeding plot, thus reducing error.
75
76.
The traitis affected directly by stomatal conductance, and therefore
indirectly by many physiological processes, including vascular
transport of water as well as C Fixation and other metabolic
activity.
As such, CTD is a good indicator of a genotype’s fitness in a given
environment.
Canopy temperature depression measured during grain filling also
seems to be influenced by the ability of genotype to partition
assimilates to yield.
This is indicated by the fact that CTD frequently shows a better
association with yield and grain number than with above ground
Cont..
76
77.
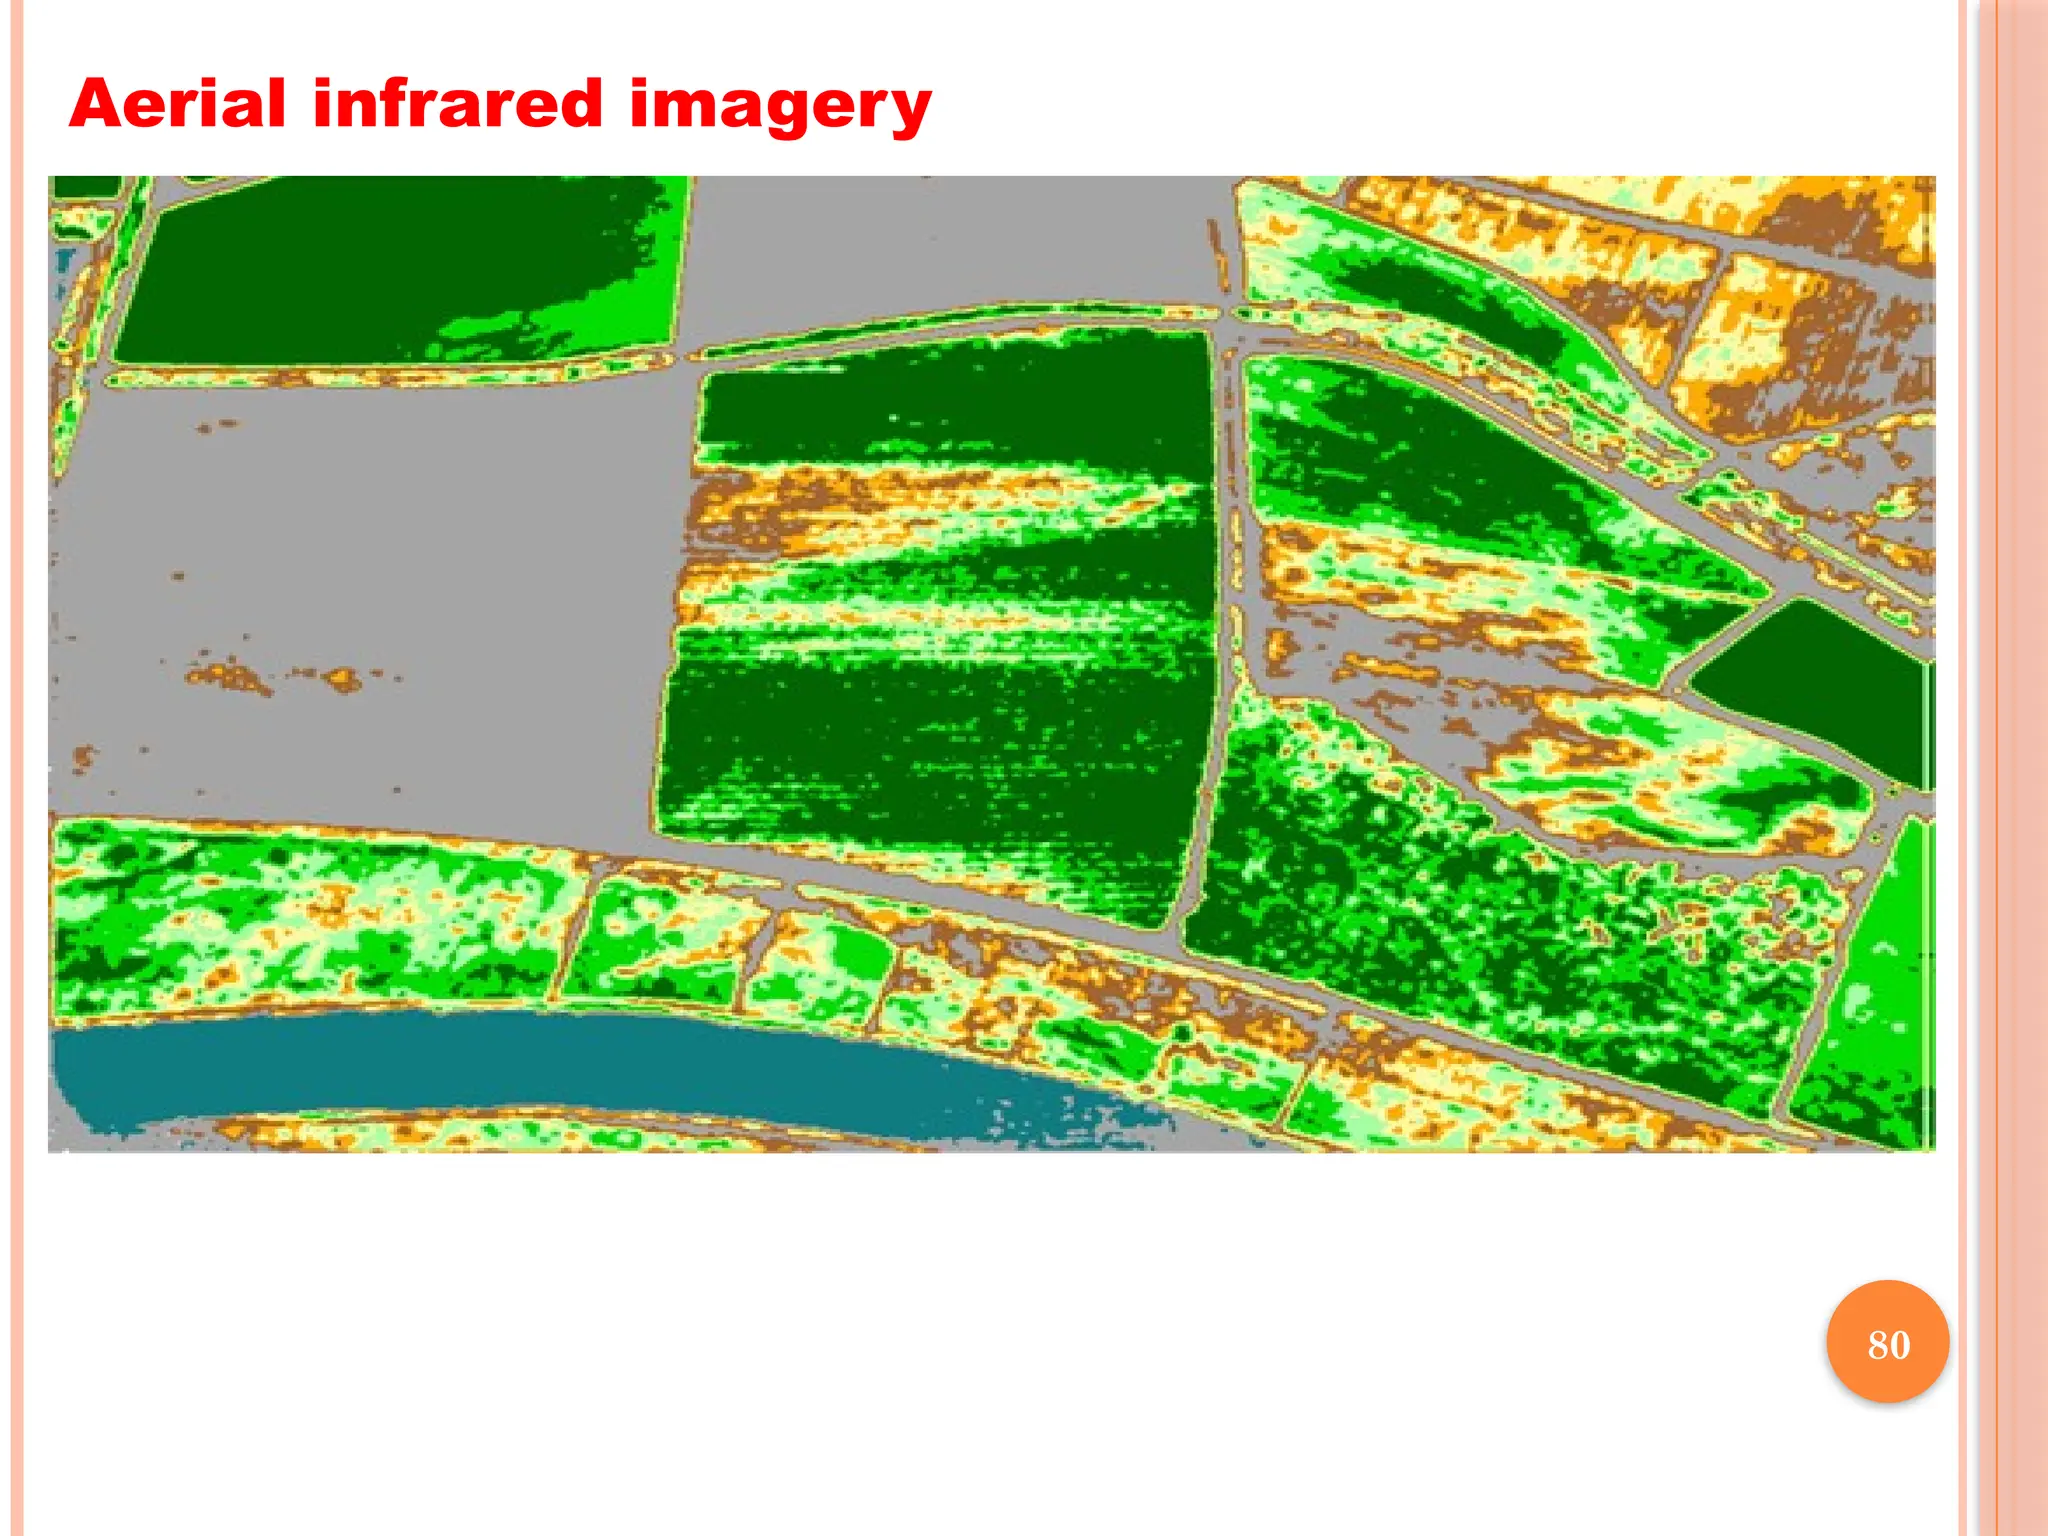
MEASURING CANOPY TEMPERATUREDEPRESSION WITH
AERIAL INFRARED IMAGERY
In terms of selection technologies on horizon, one may be the use
of aerial IR imagery to significantly increase efficiency of
conventional selection for vield.
Work conducted recently in northwestern Mexico showed that
aerial IR images had sufficient resolution to detect CTD
differences on relatively small yield plots (1.6 m wide).
Data were collected using an IR radiation sensor mounted on a
light aircraft that was flown at a height of 800 m above plots.
Information from image was subsequently digitized to provide
individual plot canopy temperatures to with accuracy of 0.1°C.
77
78.
Data ofplot temperatures showed significant correlation with final
grain yield for random derived recombinant inbred lines as well as
advanced breeding lines, and a set of elite varieties.
Data from IR imagery were compared with a spot reading taken a
few days earlier with a handheld IR thermometer under clear and
sunny conditions.
Considering that conditions were suboptimal at time of IR imagery
measurement (intermittent cloud cover introduced signiticant error
into measurements), correlation with yield compared quite
favorably with that of data from handheld IR thermometers.
Cont..
78
79.
For bothmethodologies, correlation with yield was higher with
random derived lines than with advanced lines been screened
for performance.
Results validated potential of aerial IR imagery as means of
screening thousands of breeding plots in a few hours for CTD,
and hence for their genetic yield potential.
Cont..
79
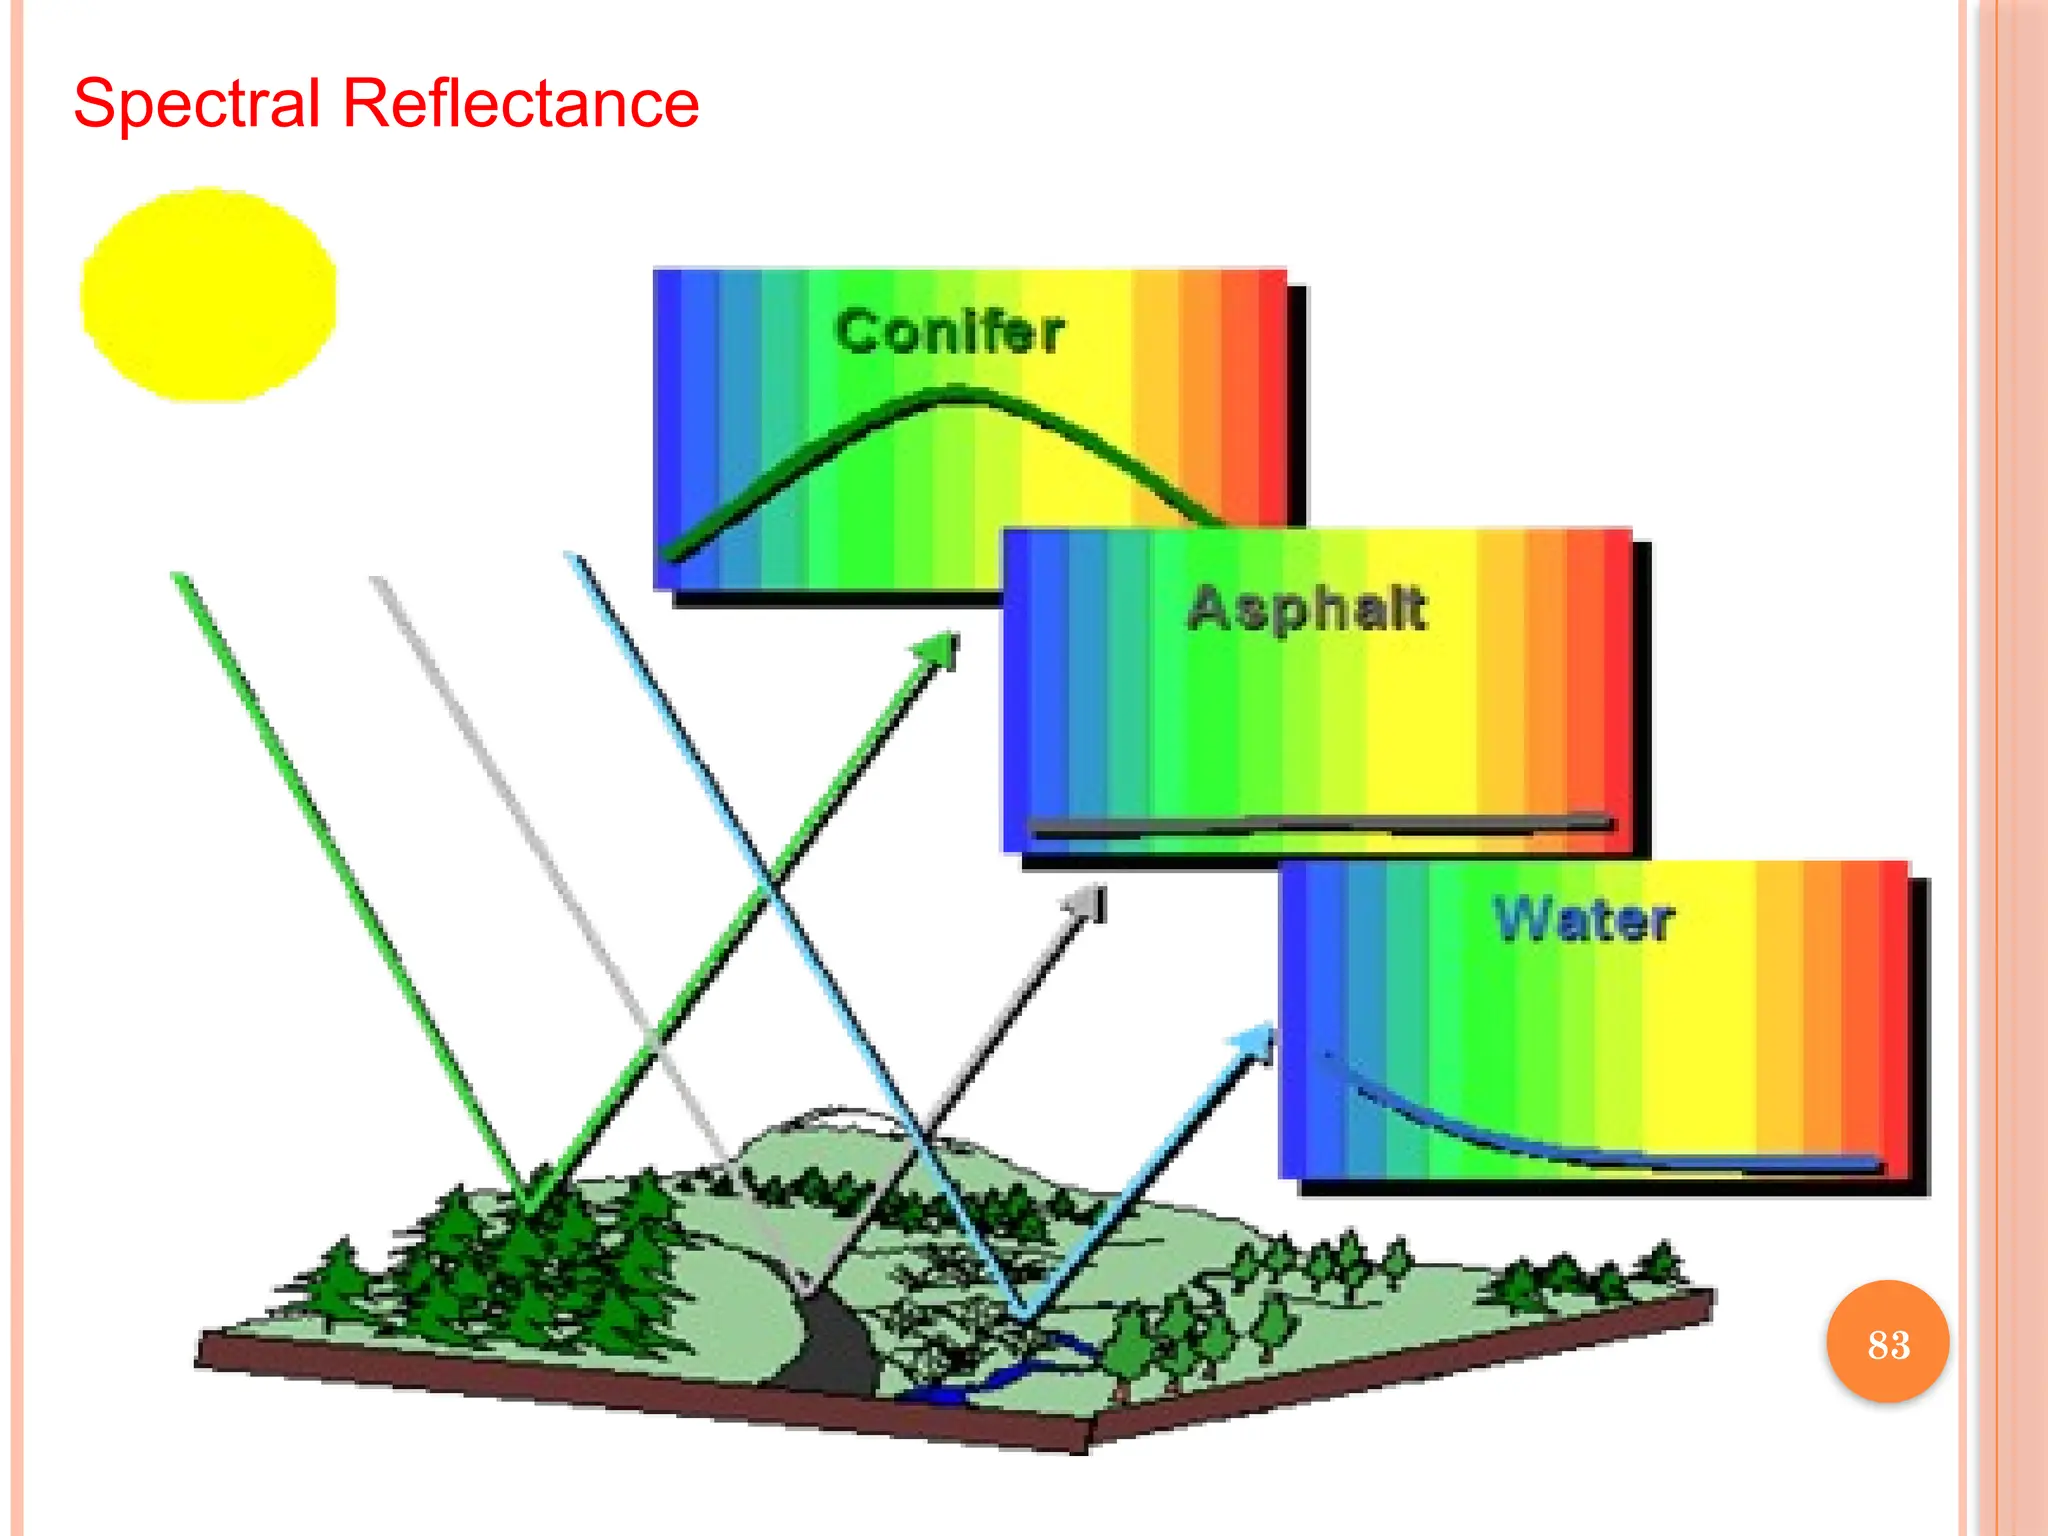
SPECTRAL REFLECTANCE
Anotherpromising technology is spectral reflectance which can be
used to estimate a range of physiological characteristics including
plant water status, leaf area index, chlorophyll content, and
absorbed PAR (Araus, 1996).
The technique is based on the principle that certain crop
characteristics are associated with the absorption of very specific
wavelengths of electromagnetic radiation (e.g., water absorbs
energy at 970 nm).
Solar radiation reflected by the crop is measured, and calibrated
against light reflected from a white surface. 81
82.
Different coefficientscan be calculated from specific bands of
the crop’s absorption spectrum, giving estimate of a number of
crop characteristics.
Spectral reflectance devices record the intensity of reflected
radiation from 400 to 1200 nm, producing a unique SR
signature for a genotype.
Cont..
82


![Light
Light
Reactions
Calvin
Cycle
Chloroplast
[CH2O]
(sugar)
ATP
NADPH
NADP
ADP
+ P i
H2O CO2
O2
44](https://image.slidesharecdn.com/1-250806121529-b93c740f/75/1-_Agro-physiological_basis_of_variation_in_yield_-2014-ppt-44-2048.jpg)
![ Photosynthetic reductive pentose phosphate cycle ("dark reactions”
involving CO2 assimilation) is found in stromal solution.
Key enzyme, rubisco. catalyzes both oxygenation carboxylation of
ribulose-l,5-bisphosphate (RuP2). Rubisco`s activity as an
oxygenase, initial step in process of photorespiration, increases as
ratio [O2] / [CO2] at enzyme and/or temperature increase.
Also in stroma are enzyme systems that manufacture and repair
chloroplast constituents, reduce nitrite and sulfite, and synthesize
starch.
Q10 of reductive cycle is 2 and low temperature limits C02
reduction unless the capacity is increased through increases in
Cont..
51](https://image.slidesharecdn.com/1-250806121529-b93c740f/75/1-_Agro-physiological_basis_of_variation_in_yield_-2014-ppt-51-2048.jpg)