- The analyst revised down 2008 net profit estimates for Thai refinery companies TOP, PTTAR, and IRPC sharply due to expectations of sizable 4Q08 losses from stock losses, inventory markdowns, and weakening demand.
- 2009-10 net profit forecasts were also slashed 11-58% due to projections for sharply lower operating rates from the global economic crisis.
- Fair value estimates for 2009 were reduced 47-65%, leading the analyst to downgrade ratings for TOP and IRPC while maintaining a neutral rating for PTTAR.
- Despite cheap valuations, the analyst views Thai refiners as unattractive currently due to cyclical peaks in margins being passed and new capacity pressuring profitability along
SpiceJet is initiating coverage with a buy recommendation and a target price of Rs84, implying 33% upside. SpiceJet is one of the fastest growing airlines in India with a 12% market share. Passenger traffic is expected to grow at 13% annually over the next few years, outpacing low capacity additions of 5-8% annually. This will result in higher load factors and profitability for airlines like SpiceJet. SpiceJet increased its market share from 8% to 12% in the past year and is expected to increase its passenger volume by 44% in the current year due to its low cost model and expansion plans.
This document provides a summary of Northrop Grumman Corporation's financial performance for the second quarter of 2006. It highlights that the company's focus on performance has increased operating margins and earnings per share. Segment operating margins for 2006 are forecasted to be around 9% and total operating margin in the mid-8% range. Cash from operations for 2006 is estimated at $2.3-2.6 billion. The company also discusses its balanced approach to cash deployment through internal investments, dividends, and share repurchases.
SpiceJet reported a 34.3% year-over-year increase in net sales for the fourth quarter of FY2010, but net sales were 12.8% lower than the previous quarter and slightly below estimates. Net profit was Rs. 27.5 crore compared to a loss in the previous year, but below estimates due to lower revenues and higher advertising costs. The analyst believes SpiceJet is well positioned to benefit from growing passenger demand and has plans to add four more aircraft in FY2011. The stock is recommended as an accumulate with a revised target price of Rs. 65, which would be a 10% upside from current levels.
Bharat Petroleum Corporation Ltd (BPCL), a government‐owned company operating in
the refining and marketing segment. The company has also diversified into the
petrochemical feedstock and exploration and production segments.
Based on a consolidated FY12 P/E multiple of 12, the fair value for the
company works out to Rs 691.
Reliance Industries reported lower-than-expected quarterly results, with profits impacted by lower-than-expected refining margins. Revenue grew 120.7% year-over-year primarily due to higher refining revenues, but margins were lower than estimates. While volume growth was strong, profitability was hurt by refining margins of $7.5/bbl compared to an estimated $8.5/bbl. The analyst maintains a buy rating due to expectations for margin improvement and inorganic growth opportunities.
This document summarizes Braskem's 2Q09 earnings conference call. It discusses Braskem's operating performance in 2Q09, with net revenue increasing 13% over 1Q09 due to sales recovery and price increases. EBITDA was R$566 million, with a 15.3% margin. Net income grew over 1Q09 due to exchange rate appreciation and improved profitability. Braskem has a comfortable cash position, with net debt covering over 2 years of debt amortization. Going forward, Braskem's focus is on strengthening client relationships, financial health, productivity, and selective acquisitions in North America.
MPL Result Update 4qfy2010-030510-finalAngel Broking
Madhucon Projects reported disappointing results for the fourth quarter of fiscal year 2010 that were below expectations. While revenue grew robustly due to higher subcontracting in the power segment, operating margins hit a historical low of 6.4% due to the heavy subcontracting. The analyst maintains a "Buy" rating but lowers the target price to Rs. 190 per share based on revised estimates factoring in lower margins and a higher holding company discount applied to the valuation of Madhucon Infra subsidiary. Near-term revenue visibility comes from existing power segment orders but margins are expected to remain under pressure from ongoing subcontracting.
Gafisa reported strong financial results for 3Q10, with launches totaling R$1.24 billion, up 140% year-over-year. Pre-sales increased 27% to R$1.02 billion. Net income before minorities was R$132.9 million, up 50% from 3Q09. Gafisa delivered 16 projects representing R$300 million in PSV during the quarter. The company has a large national land bank of R$16.6 billion that will support continued growth.
1) The analyst remains overweight on China oil & gas companies despite potential weakness in 2H11 oil demand, expecting long-term growth from increasing energy demand. However, short-term headwinds are rising with a possible nationwide resource tax.
2) CNOOC Ltd remains the top pick but the target price is cut to reflect potential tax impacts. Sinopec is raised to a buy due to lower tax impact and better refining. PetroChina is cut to a hold as it may suffer most from the potential 2012 tax.
3) The potential resource tax change raises overhang for Chinese energy firms as it may standardize taxation based on value and volume across regions sooner than expected.
This document is an Oklahoma state tax form for claiming an income tax credit for new jobs or capital investment. It provides instructions for calculating credits for additional full-time employees or for investment in qualified property. The taxpayer must maintain employment levels or investment for 4 subsequent years to continue claiming the credit in those years. The credit is doubled if the facility is located in an enterprise zone. Certain other incentives preclude claiming this credit for the same activity.
Terry Crews, Chief Financial Officer of Bank of America, presented at the 38th Annual Investment Conference on September 16, 2008. The presentation discussed Monsanto's growth opportunity in agricultural productivity through increased demand for yield and innovation to meet that demand. Monsanto aims to double its gross profit from 2007 to 2012 through expanding its seed footprint and introducing valuable biotech traits. Corn seeds and traits were highlighted as demonstrating strong financial growth and momentum through increased market share and trait penetration.
Goodrich Corporation's annual report summarizes the company's financial performance in 2007. Key highlights include:
- Sales increased 12% to $6.4 billion due to strong growth across commercial aerospace, aftermarket, and defense/space segments.
- Segment operating margins improved from 13.5% to 16.1% while net cash from operations more than doubled to $594 million.
- The company expects continued robust growth in 2008 driven by increasing demand in all market channels.
For 4QFY2010, Motherson Sumi Systems reported revenues of Rs. 2,028 crore, up 140.5% over the previous year, exceeding expectations. Net profit increased 84.5% to Rs. 141.9 crore due to favorable currency movements and lower raw material costs. The company saw improved margins both year-over-year and quarter-over-quarter due to higher operating efficiencies. On a standalone basis, revenue grew 69.9% while net profit increased 242.3% for the quarter.
Monsanto reported strong financial results for the fourth quarter and full fiscal year 2008. Net sales increased 35% in the fourth quarter and 36% for the full fiscal year. Diluted EPS on an ongoing basis improved 83% in the fourth quarter and 84% for the full fiscal year. Seeds and traits segments all saw gross profit increases. Over 70% of $2.8 billion in operating cash was used for acquisitions, technology collaborations, and capital investments to support growth. Monsanto expects another year of double-digit earnings growth in 2009, driven by continued strength in seeds and traits.
Aurobindo Pharma has transformed from a low-margin API player to a high-margin formulation player. The company is expected to see net sales and recurring profits grow at a CAGR of 15.6% and 29.1% through FY2012 due to supply agreements with Pfizer and AstraZeneca, growth in the US market, and their ARV formulation business. The report initiates coverage on Aurobindo Pharma with a buy recommendation and a target price of Rs. 1,330, representing growth potential of 18.7%
Sadbhav Engineering reported quarterly revenues and profits that were below expectations. Higher depreciation and tax expenses related to the reversal of past tax benefits weighed on profits. The company has a large order backlog that provides visibility, but rich valuations lead the analyst to maintain a Neutral rating on the stock.
Elecon Engineering is a leading provider of material handling equipment and gear solutions in India. It has a 26% market share in the domestic gear market, making it the leader. The company is well positioned to benefit from an estimated Rs32,500 crore of opportunities in the material handling equipment industry over the next few years, driven by growth in core sectors like power, steel, and coal. Elecon's order book and revenues are expected to grow at a CAGR of 40% and 13.5%, respectively, during FY2010-12, supported by a recovery in industrial activity and capital expenditures. The company's strong position in the stable gear market also helps support its profitability.
- Net sales for Q1 2006 were $1.405 billion, up 31% from $1.072 billion in Q1 2005. Gross profit was $634 million, up 29% from $491 million. Net income was $59 million compared to a net loss of $40 million in Q1 2005.
- Guidance for FY2006 targets earnings per share on an ongoing basis in the range of $2.35-$2.50 toward the upper end. Free cash flow is expected to be $825-$900 million.
- Success with variable-based pricing for Bollgard cotton traits showed increased penetration in marginal to modest infestation zones, driving overall increased value capture per acre over
1) The document is a utility property tax information update form from the New Hampshire Department of Revenue Administration.
2) It requests information about the utility such as ownership, contact details, anticipated changes, rate agreements, asset details, production and revenue details, and expenses.
3) The form must be completed and submitted by May 1, 2009 to update the Department on the utility's property tax information for the 2008 tax year.
SpiceJet reported strong financial results for the 1st quarter of FY2011, with net sales growing 34.9% year-over-year to Rs708cr, above expectations. Operating margins expanded significantly to 8.3% due to higher passenger loads. Net profit increased 109.6% to Rs55cr, also above estimates, driven by improved operating efficiency. The analyst maintains an 'Accumulate' rating on SpiceJet, expecting sales and profits to grow rapidly in the coming years as the company expands its fleet and benefits from strong industry demand fundamentals.
This presentation provides an overview and summary of CSX Corporation's financial performance and targets. CSX has created significant shareholder value as shown by strong stock performance that has outpaced industry benchmarks. The company is targeting double-digit earnings growth through 2010 by further improving its operating ratio to the mid-70s range and increasing operating income and earnings per share at a compound annual growth rate of 10-12% and 15-17%, respectively. CSX will balance capital investments focused on growth with returning cash to shareholders through dividends and share buybacks.
Indraprastha Gas Ltd.- Company Update-June 22, 2010Angel Broking
The document discusses Indraprastha Gas (IGL), an Indian city gas distribution company. It makes the following key points:
1) IGL recently increased CNG prices by Rs.5.6/kg, more than offsetting expected margin declines from higher gas costs. This reduces risks to IGL's margins.
2) With gas prices frozen until 2014, IGL may not need major price hikes, further reducing margin risks.
3) Strong volume growth from new CNG vehicles and domestic PNG connections will drive earnings growth of 17.5% annually for IGL over 2010-2012.
4) Lower risks and higher earnings lead the analyst to increase their target price for
This document provides a phone number for more information on identity or icons. The phone number 405-821-5662 is listed without any additional context around what type of information or service it relates to. In just one sentence, the document calls or requests that the listed phone number be contacted for further details.
Este documento describe cómo la naturaleza puede enseñarnos a conectarnos con nuestro ser y estar presentes en el ahora. Al observar plantas, animales y el paisaje de forma consciente, podemos aprender de su quietud y unidad con el todo. La naturaleza nos muestra cómo descansar en el ser sin división interna ni preocupación por la imagen mental. Practicando la atención plena a nuestro cuerpo y respiración, podemos reconectarnos con la inteligencia que anima todo lo natural.
MartinRoss Design is a graphic design firm that provides branding, marketing, and visual communication services. They have extensive experience working with both large corporations and small businesses. Their services include logo and identity design, print materials like brochures and annual reports, websites, signage, and packaging design. Client testimonials praise MartinRoss Design for their strategic thinking, listening skills, quality work, and enjoyable working relationships.
Océ was founded in 1871 and has since pioneered many printing technologies over its 130+ year history. It offers a full range of printers, copiers, scanners and software that are known for reliability and productivity. Océ focuses on sustainability, customer service, and innovation to provide optimized document solutions for businesses.
This document discusses how attorneys can use social media to boost referrals. It notes that 56% of attorneys are already using social networks like LinkedIn and Facebook. As social media becomes more integrated with search engines like Google and Bing, people are increasingly using their social networks to search for and get recommendations. The document recommends that attorneys have a presence on multiple social media platforms to interact more frequently with referral sources and take advantage of the increased number of people one can ask for referrals through their expanded social networks.
The document discusses various bird-related topics in the form of trivia questions and answers. It covers the Soviet "Russian Woodpecker" signal, the bird that may have killed Aeschylus, the only place with wild penguins in the Northern Hemisphere, the Dickin Medal which honors animals in war, and more bird-related people, places, and things.
Goodrich Corporation reported fourth quarter and full year 2008 results. Sales for Q4 2008 increased 2% to $1.695 billion compared to Q4 2007. Net income for Q4 2008 increased 29% to $169 million versus Q4 2007. For the full year 2008, sales increased 10% to $7.062 billion and net income increased 41% to $681 million compared to 2007. Goodrich expects sales in 2009 to be between $7.1-7.2 billion, about 1-2% growth over 2008. Net income per share for 2009 is forecast to be $4.50-$4.90.
Goodrich Corporation reported fourth quarter and full year 2008 results on February 4, 2009. The document discusses:
1) Forward-looking statements about future plans, objectives, and performance are based on reasonable assumptions but actual results may differ due to various risks and uncertainties.
2) The commercial aerospace industry faces challenges from the health of the global economy and airline industry, as well as demand for new and existing aircraft models.
3) Global passenger capacity growth has slowed as airlines cut capacity due to high fuel prices and declining demand, primarily by grounding older aircraft.
Webcast 4th Quarter and Fiscal Year 2008 Petrobras
The document summarizes Petrobras' 4th quarter and fiscal year 2008 results. Key points include:
- Oil and gas production levels decreased slightly in 4Q08 due to natural field declines and stoppages. New production systems helped offset declines.
- Prices and margins decreased significantly in 4Q08 compared to 3Q08 due to lower global oil prices.
- Exploration and Production results were affected by lower prices and impairment charges. Downstream was impacted by inventory holding losses.
- Cash flow from operations was positive despite lower earnings, helped by inventory reductions. Leverage increased due to debt and currency devaluation.
Oceaneering International reported record first quarter earnings for the period ending March 31, 2009. Revenue was $435 million and net income was $44.3 million, or $0.80 per share. This was an increase from the same period in 2008 due to growth in ROV and Subsea Projects operating profits. While first quarter results exceeded guidance, earnings are expected to decline for the rest of the year relative to 2008 due to anticipated decreases in demand, though the ROV business is expected to achieve profit growth. Full year 2009 EPS guidance was raised to a range of $3.10 to $3.60.
Goodrich Corporation provided an overview of its 2008 financial results and 2009 outlook. Key points include:
- 2008 sales were $7.062 billion, with aftermarket sales representing 45% of total. Commercial aerospace was the largest market channel.
- The global economy deteriorated sharply in late 2008, but fuel prices have stabilized in the $40-60 range. Global passenger capacity growth is expected to decline in 2009 as airlines cut flights.
- Goodrich expects 2009 sales to increase 1-2% to $7.1-7.2 billion, with commercial OE deliveries up 3-5% and defense/space up 5%. Regional aircraft and aftermarket sales are expected to be flat.
Goodrich Corporation provided an overview of its 2008 financial results and 2009 outlook. Key points include:
1) Aftermarket sales represented 45% of total 2008 sales of $7.062 billion and are expected to be flat in 2009.
2) Commercial OE sales, which made up 34% of 2008 sales, are forecast to grow 3-5% in 2009, slower than the 7% growth in 2008.
3) Defense and space sales, which accounted for 25% of 2008 sales, are estimated to increase 5% in 2009, similar to the 11% growth in 2008.
4) EPS in 2009 is projected to decline 8-16% from $5.33 in 2008 to
KPR Mill reported 15.4% revenue growth in 9mFY12 but profitability was impacted by Tamil Nadu's power shortage. While KPR's exports grew strongly, output was reduced in Q3FY12 due to lower utilization from power cuts. Cotton prices stabilized after an initial sharp fall resulted in a one-time inventory write-down for KPR. The company's FY13 outlook is positive as the full benefits of its expanded yarn capacity will be realized and power availability is expected to improve in the second half of the year. However, near-term estimates have been reduced due to the expected impact of continuing power issues in the first quarter of FY13.
Upping CPO price forecasts. In this report card on the recent results season, we
are raising our CPO price (cif) forecasts by 18% for 2009 and 8% for 2010 to
US$710 per tonne for both years. The reasons for our upgrades are Argentina’s
lower soybean crops, the slower decline in demand growth from key consumers
and a slower-than-expected recovery in palm oil output. Our new local CPO price
forecasts are RM2,280 for 2009 and RM2,250 for 2010.
• CPO price to pull back in 3Q before recovering in 4Q. We remain positive
about CPO price until end-2Q as the replenishment of stocks will require time,
India’s import duties on edible oils remain at zero and there is concern over the
delay in plantings in US. We expect CPO price to pull back in 3Q before
recovering towards the end of the year.
• Upgrading earnings forecasts and target prices. In view of our higher CPO
price forecasts and recent changes in our rupiah assumptions, we are raising our
FY09-10 earnings forecasts for all the planters in our coverage by up to 30%.
This, along with higher target P/Es following our upgrade of regional
stockmarkets, bumps up our target prices by 3-53%. We are raising Hap Seng
Plantations and Sampoerna Agro to Neutral given their recent underperformance.
• Upgrading Malaysian plantation sector to Neutral. We are raising our rating for
the Malaysian plantation sector from Underweight to Neutral as its valuation
premium over regional peers has narrowed following its recent underperformance,
selected plantations stocks will benefit from an increase in their weightings in the
new FBM30 indices on 6 July 2009, we are more bullish on the Malaysian stock
market and foreign shareholding levels have fallen.
• Staying NEUTRAL on regional plantation sector. Despite our CPO price
upgrade, we remain NEUTRAL on the regional plantation sector as the share
prices of most planters in our universe have done well YTD, reflecting the more
upbeat CPO price outlook and expectations of a correction of CPO price in 3Q
due to seasonally higher production and potential cutbacks in demand from major
consuming countries if crop prospects improve. There is also no change to our
Overweight rating on the Singapore plantation sector and Neutral call on the
Indonesian plantation sector. For exposure to the regional plantation sector, we
continue to recommend large-cap liquid planters. Our top picks in the region are
Wilmar, Sime Darby, Indofood Agri and London Sumatra.
The document is a presentation by Tim Solso, Chairman and CEO of Cummins, at Baird's 2005 Industrial Conference. It summarizes Cummins' financial performance and commitments, including exceeding targets for revenue growth, EBIT margin, capital expenditures, debt ratios, and returns. It outlines strategies to increase profitability, reduce debt, invest in growth areas, and create shareholder value. Cummins is well positioned for future growth in emerging markets like China and India. The presentation also discusses strategies for heavy duty engines, components and distribution businesses, and preparations for 2007 emissions regulations.
The document is a presentation by Tim Solso, Chairman and CEO of Cummins, at Baird's 2005 Industrial Conference. It summarizes Cummins' financial performance and commitments, including exceeding targets for revenue growth, EBIT margin, capital expenditures, debt ratios, and returns. It outlines strategies to increase profitability, reduce debt, invest in growth, and create shareholder value. Key markets like North America heavy-duty trucks and emerging markets are growing significantly. Cummins is well-positioned for future emissions regulations and global trends.
Simon Henry - Credit Suisse conference in Vail Colorado, February 8, 2012Shell plc
Simon Henry, Chief Financial Officer of Royal Dutch Shell plc, presented the Shells updated strategy as laid out in February of 2012 and the financial and operational highlights of 2011.
The document summarizes Petrobras' financial results for the second quarter of 2009. It notes a 6% increase in oil and gas production compared to the previous quarter due to production boosts from several platforms. Exploration and production activities are increasing in the pre-salt region with new wells and rigs. Lifting costs remained stable while oil prices rose between the quarters. Overall the company saw significant improvements in operating income and net income compared to the previous quarter.
The document summarizes the company's 3rd quarter 2009 results. Domestic oil production increased 5% due to new production units coming online. Pre-salt exploration activities are accelerating with new wells planned. Lifting costs were stable despite higher oil prices. Net income was flat after adjusting for currency effects. Exploration and production saw solid operating performance while downstream income normalized with increasing international prices. Capex was in line with business plans and the company continues to successfully raise long-term capital.
The document summarizes the company's financial results for the 1st quarter of 2009. It reported a 3% increase in domestic oil, NGL, and natural gas production compared to the 4th quarter of 2008 due to new production systems coming online. Operating income decreased compared to the previous quarter primarily due to lower oil prices and sales volumes, though cost reductions partially offset this. New discoveries were also announced in pre-salt areas that will help drive future growth.
ExxonMobil announced its estimated earnings results for the first quarter of 2009. Earnings were $4.55 billion, down 58% from the first quarter of 2008. Earnings per share were $0.92, down 54% from the previous year. Capital and exploration expenditures increased 5% to $5.77 billion from the first quarter of 2008. ExxonMobil's Chairman commented that despite a slowdown in the global economy and lower commodity prices, the company maintained its long-term focus on capital investment in energy projects.
The document provides an overview of a global supplier of emission and ride control systems, including financial performance, strategic initiatives to drive growth, new product pipelines, opportunities in emerging markets, and efforts to reduce costs through restructuring and lean manufacturing. It outlines the company's plan to achieve double-digit revenue growth through capturing demand for new emissions technologies, expanding in Asia and with growing automakers. The company also aims to enhance profitability by introducing new aftermarket products and optimizing its global manufacturing footprint.
The majority down. 62% of our 72-stock universe suffered lower
sequential quarterly net profits, with 24% surprising on the downside.
The combined 1Q09 net profit of our research universe fell by just 3.5%
QoQ. But stripping out 5 large gainers, net profits fell a larger 13.6%
QoQ. Consumers and glove manufacturers’ defied gravity, but net
profits of virtually all stocks in nine sectors fell quarter-on-quarter.
A surprising combined result, but the devil is in the details. The
combined net profit of our research universe declined just 3.5% QoQ
despite an overwhelming 62% of companies reporting a sequential
quarterly decline. But excluding five companies, combined net profit fell
13.6% QoQ, an acceleration from previous quarters. A broad-based
earnings decline is being masked by a few companies, including some
monopolies.
Declines in nine sectors, but consumer sector unscathed. Every
stock in nine sectors, excluding monopolies Petronas Gas and KLCCP,
experienced a drop in quarterly sequential earnings. The sectors are
gaming, oil & gas, property, REITs, construction, building materials,
semi-conductors, plantations and toll roads. Consumer stocks and
glove manufacturers showed particular resilience.
An ‘energy dividend’ took effect; monopolies fared well. Lower oil
prices benefited heavy fuel users AirAsia and Tenaga. Their gains were
only partially offset by lower earnings at the oil & gas services
companies. Net profits of Telekom, Tenaga and Petronas Gas, all
effectively monopolies, improved on a quarterly basis although only
Petronas Gas raised prices in 1Q09.
The biggest disappointment and downgrade: 1Q GDP. First quarter
2009 GDP fell 6.2% YoY, against consensus expectations of a 3-4%
drop. We have revised our GDP forecasts to -3.8% in 2009 and +4.0%
YoY in 2010 (previously -1.3% and +3.5% respectively). The
government, to be ahead in the expectations game, is projecting 2009
GDP growth of -4% to -5%. The silver lining is the government is now
under greater pressure to implement its fiscal stimulus plans quickly.
A reversal of fortune ahead for construction, building materials.
Despite uniformly lower earnings this 1Q, we believe the construction
and building materials sectors are only 2-3 quarters away from
improved revenues. Share prices of stocks in these sectors will likely
be driven by newsflow from the fiscal stimulus rather than earnings.
This document provides an overview of Northrop Grumman Corporation's financial performance in Q1 2006 and outlook for 2006. It summarizes sales growth, operating margins, cash from operations, and guidance for each of its business segments. Non-GAAP measures like segment operating margin are also defined and reconciled.
Simon Henry – Société Générale Premium Conference Paris - November 30, 2011 Shell plc
This document provides an overview of a presentation given by Simon Henry, Chief Financial Officer of Royal Dutch Shell plc, at a conference in Paris on November 30, 2011. The presentation covers Shell's strategy and financial performance, with a focus on delivering profitable growth through investments in upstream oil and gas projects, downstream refining and marketing assets, and gas-to-liquids technologies. Specific examples of recent and ongoing projects that will underpin targeted production growth through 2014 are highlighted.
Goodrich Corporation reported its first quarter 2009 results with the following key highlights:
- Sales decreased 3% to $1.696 billion compared to first quarter 2008 due to impacts from the Boeing strike and foreign exchange rates.
- Net income per share increased 10% to $1.35 compared to first quarter 2008.
- The full year 2009 sales outlook is $6.9 billion, a decrease of 2-3% compared to 2008.
- The full year 2009 earnings per share outlook is $4.50-$4.75, lower than 2008 due to higher pension expenses.
The 10 Most Influential Leaders Guiding Corporate Evolution, 2024.pdfthesiliconleaders
In the recent edition, The 10 Most Influential Leaders Guiding Corporate Evolution, 2024, The Silicon Leaders magazine gladly features Dejan Štancer, President of the Global Chamber of Business Leaders (GCBL), along with other leaders.
Understanding User Needs and Satisfying ThemAggregage
https://www.productmanagementtoday.com/frs/26903918/understanding-user-needs-and-satisfying-them
We know we want to create products which our customers find to be valuable. Whether we label it as customer-centric or product-led depends on how long we've been doing product management. There are three challenges we face when doing this. The obvious challenge is figuring out what our users need; the non-obvious challenges are in creating a shared understanding of those needs and in sensing if what we're doing is meeting those needs.
In this webinar, we won't focus on the research methods for discovering user-needs. We will focus on synthesis of the needs we discover, communication and alignment tools, and how we operationalize addressing those needs.
Industry expert Scott Sehlhorst will:
• Introduce a taxonomy for user goals with real world examples
• Present the Onion Diagram, a tool for contextualizing task-level goals
• Illustrate how customer journey maps capture activity-level and task-level goals
• Demonstrate the best approach to selection and prioritization of user-goals to address
• Highlight the crucial benchmarks, observable changes, in ensuring fulfillment of customer needs
[To download this presentation, visit:
https://www.oeconsulting.com.sg/training-presentations]
This PowerPoint compilation offers a comprehensive overview of 20 leading innovation management frameworks and methodologies, selected for their broad applicability across various industries and organizational contexts. These frameworks are valuable resources for a wide range of users, including business professionals, educators, and consultants.
Each framework is presented with visually engaging diagrams and templates, ensuring the content is both informative and appealing. While this compilation is thorough, please note that the slides are intended as supplementary resources and may not be sufficient for standalone instructional purposes.
This compilation is ideal for anyone looking to enhance their understanding of innovation management and drive meaningful change within their organization. Whether you aim to improve product development processes, enhance customer experiences, or drive digital transformation, these frameworks offer valuable insights and tools to help you achieve your goals.
INCLUDED FRAMEWORKS/MODELS:
1. Stanford’s Design Thinking
2. IDEO’s Human-Centered Design
3. Strategyzer’s Business Model Innovation
4. Lean Startup Methodology
5. Agile Innovation Framework
6. Doblin’s Ten Types of Innovation
7. McKinsey’s Three Horizons of Growth
8. Customer Journey Map
9. Christensen’s Disruptive Innovation Theory
10. Blue Ocean Strategy
11. Strategyn’s Jobs-To-Be-Done (JTBD) Framework with Job Map
12. Design Sprint Framework
13. The Double Diamond
14. Lean Six Sigma DMAIC
15. TRIZ Problem-Solving Framework
16. Edward de Bono’s Six Thinking Hats
17. Stage-Gate Model
18. Toyota’s Six Steps of Kaizen
19. Microsoft’s Digital Transformation Framework
20. Design for Six Sigma (DFSS)
To download this presentation, visit:
https://www.oeconsulting.com.sg/training-presentations
Discover timeless style with the 2022 Vintage Roman Numerals Men's Ring. Crafted from premium stainless steel, this 6mm wide ring embodies elegance and durability. Perfect as a gift, it seamlessly blends classic Roman numeral detailing with modern sophistication, making it an ideal accessory for any occasion.
https://rb.gy/usj1a2
❼❷⓿❺❻❷❽❷❼❽ Dpboss Matka Result Satta Matka Guessing Satta Fix jodi Kalyan Final ank Satta Matka Dpbos Final ank Satta Matta Matka 143 Kalyan Matka Guessing Final Matka Final ank Today Matka 420 Satta Batta Satta 143 Kalyan Chart Main Bazar Chart vip Matka Guessing Dpboss 143 Guessing Kalyan night
Best practices for project execution and deliveryCLIVE MINCHIN
A select set of project management best practices to keep your project on-track, on-cost and aligned to scope. Many firms have don't have the necessary skills, diligence, methods and oversight of their projects; this leads to slippage, higher costs and longer timeframes. Often firms have a history of projects that simply failed to move the needle. These best practices will help your firm avoid these pitfalls but they require fortitude to apply.
How to Implement a Strategy: Transform Your Strategy with BSC Designer's Comp...Aleksey Savkin
The Strategy Implementation System offers a structured approach to translating stakeholder needs into actionable strategies using high-level and low-level scorecards. It involves stakeholder analysis, strategy decomposition, adoption of strategic frameworks like Balanced Scorecard or OKR, and alignment of goals, initiatives, and KPIs.
Key Components:
- Stakeholder Analysis
- Strategy Decomposition
- Adoption of Business Frameworks
- Goal Setting
- Initiatives and Action Plans
- KPIs and Performance Metrics
- Learning and Adaptation
- Alignment and Cascading of Scorecards
Benefits:
- Systematic strategy formulation and execution.
- Framework flexibility and automation.
- Enhanced alignment and strategic focus across the organization.
Navigating the world of forex trading can be challenging, especially for beginners. To help you make an informed decision, we have comprehensively compared the best forex brokers in India for 2024. This article, reviewed by Top Forex Brokers Review, will cover featured award winners, the best forex brokers, featured offers, the best copy trading platforms, the best forex brokers for beginners, the best MetaTrader brokers, and recently updated reviews. We will focus on FP Markets, Black Bull, EightCap, IC Markets, and Octa.
Industrial Tech SW: Category Renewal and CreationChristian Dahlen
Every industrial revolution has created a new set of categories and a new set of players.
Multiple new technologies have emerged, but Samsara and C3.ai are only two companies which have gone public so far.
Manufacturing startups constitute the largest pipeline share of unicorns and IPO candidates in the SF Bay Area, and software startups dominate in Germany.
HOW TO START UP A COMPANY A STEP-BY-STEP GUIDE.pdf46adnanshahzad
How to Start Up a Company: A Step-by-Step Guide Starting a company is an exciting adventure that combines creativity, strategy, and hard work. It can seem overwhelming at first, but with the right guidance, anyone can transform a great idea into a successful business. Let's dive into how to start up a company, from the initial spark of an idea to securing funding and launching your startup.
Introduction
Have you ever dreamed of turning your innovative idea into a thriving business? Starting a company involves numerous steps and decisions, but don't worry—we're here to help. Whether you're exploring how to start a startup company or wondering how to start up a small business, this guide will walk you through the process, step by step.
Top mailing list providers in the USA.pptxJeremyPeirce1
Discover the top mailing list providers in the USA, offering targeted lists, segmentation, and analytics to optimize your marketing campaigns and drive engagement.
Easily Verify Compliance and Security with Binance KYCAny kyc Account
Use our simple KYC verification guide to make sure your Binance account is safe and compliant. Discover the fundamentals, appreciate the significance of KYC, and trade on one of the biggest cryptocurrency exchanges with confidence.
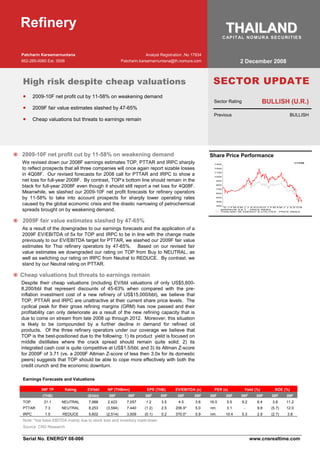
1. Refinery THAILAND
C AP I T AL N O M U R A S E C U R I T I E S
Patcharin Karsemarnuntana Analyst Registration .No 17834
2 December 2008
662-285-0060 Ext. 3506 Patcharin.karsemarnuntana@th.nomura.com
SECTOR UPDATE
High risk despite cheap valuations
• 2009-10F net profit cut by 11-58% on weakening demand
BULLISH (U.R.)
Sector Rating
• 2009F fair value estimates slashed by 47-65%
Previous BULLISH
• Cheap valuations but threats to earnings remain
2009-10F net profit cut by 11-58% on weakening demand Share Price Performance
We revised down our 2008F earnings estimates TOP, PTTAR and IRPC sharply 1/12/08
1300
to reflect prospects that all three companies will once again report sizable losses 1200
1100
in 4Q08F. Our revised forecasts for 2008 call for PTTAR and IRPC to show a 1000
net loss for full-year 2008F. By contrast, TOP’s bottom line should remain in the 900
black for full-year 2008F even though it should still report a net loss for 4Q08F. 800
700
Meanwhile, we slashed our 2009-10F net profit forecasts for refinery operators 600
by 11-58% to take into account prospects for sharply lower operating rates 500
400
caused by the global economic crisis and the drastic narrowing of petrochemical 300
D J FM AM J J A SO N D J FM AM J J A S ON
spreads brought on by weakening demand. BANGKOK S.E.T. - PRICE INDEX
THAILAND SE ENERGY & UTILITIES - PRICE INDEX
2009F fair value estimates slashed by 47-65%
As a result of the downgrades to our earnings forecasts and the application of a
2009F EV/EBITDA of 5x for TOP and IRPC to be in line with the change made
previously to our EV/EBITDA target for PTTAR, we slashed our 2009F fair value
estimates for Thai refinery operators by 47-65%. Based on our revised fair
value estimates we downgraded our rating on TOP from Buy to NEUTRAL, as
well as switching our rating on IRPC from Neutral to REDUCE. By contrast, we
stand by our Neutral rating on PTTAR.
Cheap valuations but threats to earnings remain
Despite their cheap valuations (including EV/bbl valuations of only US$5,600-
8,200/bbl that represent discounts of 45-63% when compared with the pre-
inflation investment cost of a new refinery of US$15,000/bbl), we believe that
TOP, PTTAR and IRPC are unattractive at their current share price levels. The
cyclical peak for their gross refining margins (GRM) has now passed and their
profitability can only deteriorate as a result of the new refining capacity that is
due to come on stream from late 2008 up through 2012. Moreover, this situation
is likely to be compounded by a further decline in demand for refined oil
products. Of the three refinery operators under our coverage we believe that
TOP is the best-positioned due to the following: 1) its product yield is focused on
middle distillates where the crack spread should remain quite solid; 2) its
integrated cash cost is quite competitive at US$1.5/bbl; and 3) its Altman Z-score
for 2009F of 3.71 (vs. a 2009F Altman Z-score of less then 3.0x for its domestic
peers) suggests that TOP should be able to cope more effectively with both the
credit crunch and the economic downturn.
Earnings Forecasts and Valuations
09F TP Rating EV/bbl NP (THBmn) EPS (THB) EV/EBITDA (x) PER (x) Yield (%) ROE (%)
(THB) ($/bbl) 08F 09F 08F 09F 08F 09F 08F 09F 08F 09F 08F 09F
TOP 21.1 NEUTRAL 7,988 2,423 7,057 1.2 3.5 4.5 3.8 16.0 5.5 9.2 6.4 3.8 11.2
PTTAR 7.3 NEUTRAL 8,253 (3,594) 7,440 (1.2) 2.5 206.9* 5.0 nm. 3.1 - 9.8 (5.7) 12.0
IRPC 1.5 REDUCE 5,602 (2,514) 3,509 (0.1) 0.2 370.0* 5.9 nm. 10.4 5.3 2.9 (2.7) 3.8
Note: *low base EBITDA mainly due to stock loss and inventory mark-down
Source: CNS Research
Serial No. ENERGY 08-006 www.cnsrealtime.com
2. Refinery Sector Capital Nomura Securities
High risk despite cheap valuations
We revised down our 2008F net profit estimates for TOP, PTTAR and IRPC sharply to reflect
We revised down our 2008
prospects that all three companies will once again report sizable losses in 4Q08F. The dreadful
net profit estimates for
outlook for 4Q08F can be attributed to: 1) stock losses and inventory mark-downs, particularly on
TOP, PTTAR and IRPC to
their crude oil inventories; 2) the weakening of their GRMs as a result of their vulnerable crack
reflect prospects that all
spreads for gasoline and the sizeable negative spreads for naphtha over Dubai crude; 3)
three companies will once
abnormally low aromatics spreads caused by weak demand; and 4) the likelihood of lower
again report sizable losses
operating rates at both their refinery and petrochemical plants. Thus, our revised forecasts for
in 4Q08
2008 call for PTTAR and IRPC to show a net loss for full-year 2008. By contrast, TOP’s bottom
line should remain in the black even though it should report a net loss for 4Q08.
Meanwhile, we slashed our 2009-10F net profit forecasts for TOP, PTTAR and IRPC by 11-58% We also slashed our 2009-
to take into account prospects for sharply lower operating rates caused by the global economic 10F net profit forecasts for
crisis and the drastic narrowing of petrochemical spreads brought on by weakening demand. As refinery operators by
a result of these downgrades and the application of a 2009F EV/EBITDA of 5x for TOP and IRPC 11-58%
to be in line with the change made previously to our EV/EBITDA target for PTTAR, we slashed
our 2009F fair value estimates for Thai refinery operators by 47-65%. Based on our revised fair
value estimates we downgraded our rating on TOP from Buy to NEUTRAL, as well as switching
our rating on IRPC from Neutral to REDUCE. By contrast, we stand by our Neutral rating on
PTTAR.
Despite their cheap valuations (including EV/bbl valuations of only US$5,600-8,200/bbl that
Despite their cheap
represent discounts of 45-63% when compared with the pre-inflation investment cost of a new
valuations, in our view TOP,
refinery of US$15,000/bbl) in our view TOP, PTTAR and IRPC are unattractive at their current
PTTAR and IRPC are
share price levels. The cyclical peak for their gross refining margins (GRM) has now passed and
unattractive at their current
their profitability can only deteriorate as a result of the new refining capacity that is due to come
share price levels
on stream from late 2008 up through 2012. Moreover, this situation is likely to be compounded
by a further decline in demand for refined oil products. On this basis we expect the share prices
for refinery stocks to continue to underperform the SET.
TOP is the best-positioned
Of the three refinery operators under our coverage we believe that TOP is the best-positioned
to cope with the credit
due to the following: 1) its product yield is focused on middle distillates where the crack spread
crunch and the economic
should remain quite solid; 2) its integrated cash cost is quite competitive at US$1.5/bbl; and 3)
downturn
its Altman Z-score for 2009F of 3.71 (vs. a 2009F Altman Z-score of less then 3.0x for its
domestic peers) suggests that TOP should be able to cope more effectively with both the credit
crunch and the economic downturn.
Net profit estimates for 2009-10F slashed by 11-58%
We slashed our 2009-10F
As mentioned earlier, we slashed our 2009-10F earnings forecasts for TOP, PTTAR and IRPC
earnings forecasts for TOP,
by 11-58% to take into account prospects for sharply lower operating rates caused by the global
PTTAR and IRPC by 11-58%
economic crisis. The reductions in operating rates for their petrochemical plants are likely to
to take into account
between 15-21% vs. 5-10% for their refineries. Another reason for downgrades to our earnings
prospects for sharply lower
forecasts for 2009-10F is the likelihood of seeing a drastic narrowing of their petrochemical
operating rates caused by
spreads brought on by weakening demand. This is likely to be particularly true for their the global economic crisis
paraxylene spreads and benzene spreads owing to the slowdown in demand in their derivative
chains for polyester/PET and styrene monomer. Note that previously we already cut our 2009F
GRM forecasts for complex refineries to US$4/bbl to reflect the new refining capacity coming
stream that is likely to overwhelm additional demand.
2 December 2008 2
3. Refinery Sector Capital Nomura Securities
Exhibit 1. 4Q08 net profit estimates and revised Exhibit 2. Stock losses and inventory mark-downs
2008-10 net profit forecasts (above) and oil price movement (below)
TOP PTTAR IRPC Stock Loss and Inventory Mark-down (LCM)
Current (THBmn)
TOP PTTAR IRPC
0
Net Profit (THBmn)
9M08 8,617 2,215 2,323 -2,000
4Q08F (6,194) (5,808) (4,837) -4,000
2008F 2,423 (3,594) (2,514) -6,000
2009F 7,057 7,440 3,509 -8,000
2010F 10,834 9,670 3,799 -10,000
3Q08 4Q08F
Previous
Net Profit (THBmn) O il P r ic e M o v e m e n t
U S $ /b b l
170
2008F 10,794 2,721 9,010 W TI B re n t
150
2009F 10,438 9,953 8,290 D u b ai T a p is
130
2010F 13,114 10,832 8,388 110
90
% change 70
2008F -78% nm. nm. 50
2009F -32% -25% -58% 30
May-05
May-06
Oct-06
Feb-07
Oct-07
Jul-08
Nov-08
Jan-05
Sep-05
Jan-06
Jun-07
Feb-08
2010F -17% -11% -55%
Source: CNS Research Source: The Company, CNS Research
Note: stock loss is a realized loss on refining activity, while an inventory
mark-down is an unrealized loss on physical stocks in the quarter based on
the conservative accounting method by means of the lower of cost or
market (LCM)
Exhibit 3. Change in key assumptions and earnings revisions for 2009-10F
Thai Oil (TOP) Current Previous % change
Key assumption and earnings revision 2009F 2010F 2009F 2010F 2009F 2010F
Operating rate - refinery plant (%) 90% 95% 105% 105% -15% -10%
Operating rate - aromatics plant (%) 75% 80% 95% 95% -20% -15%
Operating rate - lube base plants (%) 85% 90% 95% 95% -10% -5%
Market GRM (US$/bbl) 4.0 5.0 4.0 5.0 0% 0%
Spread PX - Platformate (US$/tonne) 260 260 300 280 -13% -7%
Spread BZ - Platformate (US$/tonne) 130 130 150 130 -13% 0%
Spread LB - HSFO (US$/tonne) 450 450 450 450 0% 0%
EBITDA (THBmn) 16,049 19,935 19,674 23,243 -18% -14%
Net Profit (THBmn) 7,057 10,834 10,438 10,438 -32% 4%
PTT Aromatics and Refining (PTTAR) Current Previous % change
Key assumption and earnings revision 2009F 2010F 2009F 2010F 2009F 2010F
Operating rate - refinery plant (%) 90% 95% 105% 105% -15% -10%
Operating rate - aromatics plant (%) 75% 80% 95% 95% -20% -15%
Market GRM (US$/bbl) 4.0 5.0 4.0 5.0 0% 0%
PX - Condensate (US$/tonne) 280 280 300 280 -7% 0%
BZ - Condensate (US$/tonne) 150 150 150 130 0% 15%
EBITDA (THBmn) 15,715 18,555 18,766 20,487 -16% -9%
Net Profit (THBmn) 7,440 9,670 9,953 10,832 -25% -11%
IRPC (IRPC) Current Previous % change
Key assumption and earnings revision 2009F 2010F 2009F 2010F 2009F 2010F
Operating rate - refinery plant (%) 70% 80% 85% 85% -15% -5%
Operating rate - petrochemical plant (%) 82% 86% 103% 103% -21% -17%
Integrated GRM (US$/bbl) 6.1 5.3 8.2 8.0 -26% -33%
GRM of refinery business (US$/bbl) 3.1 3.0 4.2 4.2 -27% -28%
GRM of petrochemical and others business (US$/bbl) 3.0 2.3 4.0 3.8 -24% -39%
EBITDA (THBmn) 7,051 8,246 12,216 14,289 -42% -42%
Net Profit (THBmn) 3,509 3,799 8,290 8,388 -58% -55%
Source: CNS Research
2 December 2008 3
4. Refinery Sector Capital Nomura Securities
Exhibit 4. Movement of crude oil price Exhibit 5. Movement of aromatics price
US$/bbl US$/tonne
170 1,800
WTI Brent Paraxylene
1,600
150 Dubai Tapis Benzene
1,400
130
1,200
110
1,000
90
800
70 600
400
50
200
30
Jan-05
Oct-05
Apr-06
Oct-06
Jan-07
Apr-07
Aug-08
Apr-05
Jul-05
Jan-06
Jul-06
Aug-07
Nov-07
Feb-08
May-08
Nov-08
May-05
May-06
Oct-06
Feb-07
Oct-07
Jul-08
Nov-08
Jan-05
Sep-05
Jan-06
Jun-07
Feb-08
Source: DataStream Source: CNS Research
Sharp drop in 4Q08 Singapore Dubai crack being hit by lowering gasoline crack
For 4Q08 the QTD Singapore Dubai crack has averaged at US$4.1/bbl for a decline of 29% q-q For 4Q08 the QTD
from US$5.8 in 3Q08 and down 47% y-y from US$7.6 in 4Q07. The cause of this decline is the Singapore Dubai crack has
dwindling demand for gasoline led by weak consumption in the US. Note that gas consumption averaged at US$4.1/bbl
in the US accounts for 45% of global demand. This is the result of a sharp decline in the (-29% q-q and -47% y-y)
gasoline crack spread to US$4.6/bbl QTD from US$5.9/bbl in 3Q08 and US$12.6/bbl in 4Q07. In
addition, the abnormally low price of naphtha price so far this quarter has resulted in a negative
spread over Dubai crude that in turn is putting further pressure on refinery operators’ GRMs.
These negative signs imply extremely poor demand for petrochemicals and further cutbacks in
production by Asian naphtha-based crackers making the excess supply of naphtha on the
market. Note that the crack spreads for middle distillates have weakened but remain fairly solid.
For example, the crack spread for jet oil has narrowed to US$22.9/bbl QTD (vs. US$28.6 in
3Q08, and US$22.7 in 4Q07), while the crack spread for gas oil has weakened to US$16.6/bbl
QTD (vs. US$25.6 in 3Q08, and US$19.5 in 4Q07).
Exhibit 6. Singapore Dubai crack Exhibit 7. Crack spread by type of refined oil
US$/bbl
US$/bbl
40
10.0
ULG 95-Dubai Diesel - Dubai
9.0 30 Jet - Dubai FO180 - Dubai
8.0 20
7.0 10
6.0
0
5.0
-10
4.0
-20
3.0
-30
2.0
4Q05
1Q07
2Q08
1Q05
2Q05
3Q05
1Q06
2Q06
3Q06
4Q06
2Q07
3Q07
4Q07
1Q08
3Q08
4Q08 QTD
4Q08 QTD
1Q05
2Q05
3Q05
4Q05
1Q06
2Q06
3Q06
4Q06
1Q07
2Q07
3Q07
4Q07
1Q08
2Q08
3Q08
Source: DataStream Source: CNS Research
Extremely weak demand putting pressure on aromatics spreads
So far the paraxylene-
Since the beginning of 4Q08 aromatics spreads have also dropped sharply. For example, QTD
condensate spread and the
the paraxylene-condensate spread and the benzene-condensate spread have dropped by 52%
benzene-condensate spread
q-q (to US$207/tonne) and by 89% q-q (to US$28/tonne), respectively. These declines have
for 4Q08 have dropped by
been caused by the sharp slowdown in demand for aromatics products caused by weak demand
2 December 2008 4
5. Refinery Sector Capital Nomura Securities
in the intermediate and downstream petrochemical chain brought on by the global economic 52% q-q and 89% q-q,
crisis. Buyers of petrochemical products are now destocking their inventory levels and delaying respectively
placing new orders. We expect this worse-than-usual trough situation for the petrochemical
industry to continue into 1Q09. However, this should be followed by the building up of new
inventory after several months of destocking.
On the cost side, given the greater market access to naphtha resulting from the production
cutbacks by naphtha-based crackers, the price of naphtha price is currently abnormally low at
just US$432/tonne, which is US$90/tonne cheaper than the price of condensate. This is unusual
because naphtha is usually more expensive than condensate. However, we expect this
abnormal situation will not last long and that it will take at most one quarter for conditions to
return to normal where the price of naphtha is US$30-50/tonne higher than the price of
condensate.
Exhibit 8. Paraxylene spread and benzene spread Exhibit 9. Condensate price vs. naphtha price
US$/tonne
US$/tonne
1,300
1,000
Condensate
1,200
Paraxylene Spread
1,100 Naphtha
800 Benzene Spread 1,000
900
600
800
700
400
600
500
200
400
300
0
200
100
-200
0
Jan-06
Jan-05
Apr-05
Jul-05
Oct-05
Apr-06
Jul-06
Oct-06
Jan-07
Apr-07
Nov-07
Feb-08
May-08
Aug-08
Nov-08
Aug-07
Jan-05
May-08
Apr-05
Jul-05
Oct-05
Jan-06
Apr-06
Jul-06
Oct-06
Jan-07
Apr-07
Aug-07
Aug-08
Nov-08
Nov-07
Feb-08
Source: DataStream Source: CNS Research
Low base effect in 2008F to bring about earnings recovery next year
In general, refinery operators are likely to report low to negative earnings for 2008F due to If we exclude the inventory
prospects for extremely weak results in 2H08F that should include huge net losses caused by mark-downs for this year,
substantial stock loss and inventory mark-downs following the sharp drop in the price of crude oil. the operating performance
Nevertheless, for full-year 2008 we expect TOP to post a net profit of THB2.4bn owing to its at TOP, PTTAR AND IRPC is
strong performance in 1H08 that included a solid GRM and a substantial stock gain made likely to deteriorate in 2009F
possible by the sharp rise in the price of crude oil (particularly in 2Q08), as well as the company’s given the anticipated
capacity expansion. By contrast, PTTAR and IRPC are likely to fall into the red for full-year 2008 downturn for both their
with net losses of THB3.6bn and THB2.5bn, respectively. GRMs and petrochemical
spreads
Due to the low base effect from 2008F TOP, PTTAR and IRPC should see their earnings
rebound in 2009F even though we revised down our net profit forecasts for 2009-10F. However,
if we exclude their inventory mark-downs for this year, their operating performance is likely to
deteriorate in 2009F given the anticipated downturn for both their GRMs and petrochemical
spreads. Note that PTTAR should be an exceptional case as its 2009F earnings are likely to be
supported by a full-year contribution from the commercial start-up of its new aromatics complex.
This facility is comprised of a reformer complex and aromatics complex that are likely to boost its
nameplate refining capacity by 65kbd to 280kbd (including its condensate splitter capacity of its
existing Aromatic I plant), as well as its nameplate aromatics capacity that should nearly double
to 2.23mn tpa.
2 December 2008 5
6. Refinery Sector Capital Nomura Securities
Exhibit 10. Comparison of 2008-10F net profit for TOP, PTTAR and IRPC
THBmn
12,000
10,000
8,000
6,000
4,000
2,000
0
TOP PTTAR IRPC
(2,000)
(4,000)
(6,000)
2008F 2009F 2010F
Source: CNS Research
2009F fair value estimates slashed by 47-65%
Our revised fair value
As a result of the downgrades to our earnings forecasts and the application of a 2009F
estimates for TOP, PTTAR
EV/EBITDA of 5x for TOP and IRPC to be in line with the change made previously to our
and IRPC are based on a
EV/EBITDA target for PTTAR, we slashed our 2009F fair value estimates for TOP, PTTAR and
IRPC by 47-65%. Based on our revised fair value estimates we downgraded our rating on TOP 2009F EV/EBITDA of 5x
from Buy to NEUTRAL, as well as switching our rating on IRPC from Neutral to REDUCE. By
contrast, we stand by our Neutral rating on PTTAR.
Exhibit 11. Fair value and change in ratings for TOP, PTTAR and IRPC
Rating 2009F Fair Price (THB) % chg Valuation Methodology
Current Previous Current Previous Current Previous
TOP NEUTRAL BUY 21.1 44.2 -52% 2009F EV/EBITDA: 5x SOTP
2009F EV/EBITDA: 5x
PTTAR NEUTRAL NEUTRAL 7.3 13.9 -47% 2009F EV/EBITDA: 5x
EV/EBITDA
2009F EV/EBITDA: 5x
IRPC REDUCE NEUTRAL 1.5 4.5 -65% DCF
EV/EBITDA
Source: CNS Research
Key risks to our revised earnings forecasts for 2009F
Although inventory mark-downs are likely to have less of an impact on refinery operators’ Risks to our newly revised
earnings for 2009F, there are several risks to our net profit estimates for that year. These earnings estimates for
include weaker-than-anticipated GRM and petrochemical spreads, as well as lower-than- 2009F include weaker-than-
expected operating rates brought on by sharper-than-anticipated declines in the demand for anticipated GRMs and
petroleum and petrochemical products caused by the global economic slowdown. petrochemical spreads, as
well as lower-than-expected
Despite their cheap valuations (including EV/bbl valuations of only US$5,600-8,200/bbl that operating rates
represent discounts of 45-63% when compared with the pre-inflation investment cost of a new
refinery of US$15,000/bbl), we believe that TOP, PTTAR and IRPC are unattractive at their
current share price levels. The cyclical peak for their gross refining margins (GRM) has now
passed and their profitability can only deteriorate as a result of the new refining capacity that is
due to come on stream from late 2008 up through 2012F. Moreover, this situation is likely to be
compounded by a further decline in demand for refined oil products. Note that Nomura
International Hong Kong’s (NIHK) energy research team calls for the addition of new crude
distillation capacity of 7mn bbl/d during 2008-12F, which would be equivalent to 1.5% CAGR
versus demand growth at 1% CAGR in the period. Furthermore, overcapacity is likely to be more
2 December 2008 6
7. Refinery Sector Capital Nomura Securities
persistent in the next 12 months as out-sized new capacity is set to come on-stream within a
relatively short timeframe. This is particularly true of Reliance Industries that will add 580kbd of
refining capacity in early 2009F, as well as the cumulative 840kbd of refining capacity that is
scheduled to come on stream from China in 2H08F-1H09F. Hence, due to the global economic
crisis the scope for an incremental improvement in demand is in doubt. All of these factors are
potential threats to our revised earnings forecasts for 2009F.
Of the three refinery
Of the three refinery operators under our coverage we believe that TOP is the best-positioned
operators under our
due to the following: 1) its product yield is focused on middle distillates where the crack spread
coverage we believe that
should remain quite solid; 2) its integrated cash cost is quite competitive at US$1.5/bbl; and 3)
TOP is the best-positioned
its Altman Z-score for 2009F of 3.71 (vs. a 2009F Altman Z-score of less then 3.0x for its
to cope with the credit
domestic peers) suggests that TOP should be able to cope more effectively with both the credit
crunch and global economic
crunch and the economic downturn.
slowdown
Exhibit 12. 2008-09F earnings forecast and valuation
09F TP Rating EV/bbl NP (THBmn) EPS (THB) EV/EBITDA (x) PER (x) Yield (%) ROE (%)
(THB) ($/bbl) 08F 09F 08F 09F 08F 09F 08F 09F 08F 09F 08F 09F
TOP 21.1 NEUTRAL 7,988 2,423 7,057 1.2 3.5 4.5 3.8 16.0 5.5 9.2 6.4 3.8 11.2
PTTAR 7.3 NEUTRAL 8,253 (3,594) 7,440 (1.2) 2.5 206.9* 5.0 nm. 3.1 - 9.8 (5.7) 12.0
IRPC 1.5 REDUCE 5,602 (2,514) 3,509 (0.1) 0.2 370.0* 5.9 nm. 10.4 5.3 2.9 (2.7) 3.8
Note: *low base EBITDA mainly due to stock loss and inventory mark-down
Source: CNS Research
Exhibit 13. Global CDU additions Exhibit 14. Incremental supply of refined oil
products less incremental demand
kbd
kbd
2,000
3,500 3.5%
3,000 3.0%
1,600
2,500 2.5%
2,000 2.0% 1,200
1,500 1.5%
800
1,000 1.0%
500 0.5%
400
0 0.0%
2007 2008F 2009F 2010F 2011F 2012F 2013F 0
2007 2008F 2009F 2010F 2011F 2012F 2013F
Global CDU additions (LHS) % addition (RHS)
Source: Nomura International (H.K.) Source: Nomura International (H.K.)
Exhibit 15. TOP’s product yield vs. peers and Thailand’s oil demand
100%
10%
11%
19%
80%
41% 45%
60%
52%
40% 12%
25%
9% 17%
20%
19% 15%
16%
5%
4%
0%
T O P (9 M0 8 ) O th e r R e fin e r y ' s T h a ila n d ' s O il D e m a n d
P r o d u c t Y ie ld
LP G G a s o lin e Jet D ie s e l FO
Source: TOP, CNS Research
2 December 2008 7
8. Refinery Sector Capital Nomura Securities
Exhibit 16. Altman Z-scores for TOP, PTTAR and IRPC
Stock 09F EBIT/TA 09F Net Sales /TA 09F Mkt Value of Equity/TL 09F WC/TA 09F RE/Total Assets 09F Z-Score
TOP 0.06 2.68 0.47 0.15 0.27 3.71
PTTAR 0.07 2.10 0.24 (0.06) 0.15 2.57
IRPC 0.03 1.62 0.69 0.36 0.31 2.97
Source: CNS Research
Note: Details of the Altman Z-core
RATIO WEIGHTAGE
A EBIT/Total Assets x. 3.3
B Net Sales /Total Assets x 0.999
C Market Value of Equity / Total Liabilities x 0.6
D Working Capital/Total Assets x 1.2
E Retained Earnings /Total Assets x1.4
These ratios are multiplied by the weightings indicated above, and the results are added together.
Z-Score = A x 3.3 + B x 0.99 + C x 0.6 + D x 1.2 + E x 1.4
2 December 2008 8