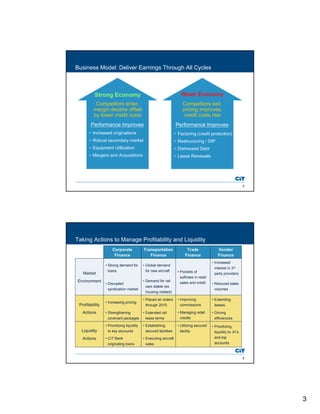
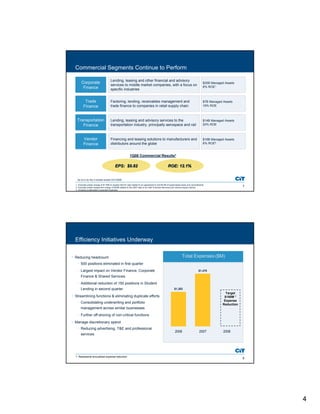
Jeffrey Peek, CEO of Lehman Brothers, presented at the 11th Annual Financial Services Conference in London on May 20, 2008. He discussed Lehman Brothers' business model of delivering earnings through all economic cycles. He also outlined several actions Lehman Brothers is taking to manage profitability and liquidity during the current market environment, including increasing pricing, strengthening covenant packages, and prioritizing liquidity. Peek concluded by emphasizing Lehman Brothers' proven liquidity into 2009 and vision for a balanced funding model and capital structure going forward.
Buy Side Challenges in the Field of Collateral Management - Marc Peter JahnckeLászló Árvai
Prior to 2009, strict regulations did not exist on
collateralized products. Over-the-counter
derivatives were traded under an ISDA Master
Agreement or long form confirmation
Buy Side Challenges in the Field of Collateral Management - Marc Peter JahnckeLászló Árvai
Prior to 2009, strict regulations did not exist on
collateralized products. Over-the-counter
derivatives were traded under an ISDA Master
Agreement or long form confirmation
how to swap pi coins to foreign currency withdrawable.DOT TECH
As of my last update, Pi is still in the testing phase and is not tradable on any exchanges.
However, Pi Network has announced plans to launch its Testnet and Mainnet in the future, which may include listing Pi on exchanges.
The current method for selling pi coins involves exchanging them with a pi vendor who purchases pi coins for investment reasons.
If you want to sell your pi coins, reach out to a pi vendor and sell them to anyone looking to sell pi coins from any country around the globe.
Below is the contact information for my personal pi vendor.
Telegram: @Pi_vendor_247
when will pi network coin be available on crypto exchange.DOT TECH
There is no set date for when Pi coins will enter the market.
However, the developers are working hard to get them released as soon as possible.
Once they are available, users will be able to exchange other cryptocurrencies for Pi coins on designated exchanges.
But for now the only way to sell your pi coins is through verified pi vendor.
Here is the telegram contact of my personal pi vendor
@Pi_vendor_247
NO1 Uk Divorce problem uk all amil baba in karachi,lahore,pakistan talaq ka m...Amil Baba Dawood bangali
Contact with Dawood Bhai Just call on +92322-6382012 and we'll help you. We'll solve all your problems within 12 to 24 hours and with 101% guarantee and with astrology systematic. If you want to take any personal or professional advice then also you can call us on +92322-6382012 , ONLINE LOVE PROBLEM & Other all types of Daily Life Problem's.Then CALL or WHATSAPP us on +92322-6382012 and Get all these problems solutions here by Amil Baba DAWOOD BANGALI
#vashikaranspecialist #astrologer #palmistry #amliyaat #taweez #manpasandshadi #horoscope #spiritual #lovelife #lovespell #marriagespell#aamilbabainpakistan #amilbabainkarachi #powerfullblackmagicspell #kalajadumantarspecialist #realamilbaba #AmilbabainPakistan #astrologerincanada #astrologerindubai #lovespellsmaster #kalajaduspecialist #lovespellsthatwork #aamilbabainlahore#blackmagicformarriage #aamilbaba #kalajadu #kalailam #taweez #wazifaexpert #jadumantar #vashikaranspecialist #astrologer #palmistry #amliyaat #taweez #manpasandshadi #horoscope #spiritual #lovelife #lovespell #marriagespell#aamilbabainpakistan #amilbabainkarachi #powerfullblackmagicspell #kalajadumantarspecialist #realamilbaba #AmilbabainPakistan #astrologerincanada #astrologerindubai #lovespellsmaster #kalajaduspecialist #lovespellsthatwork #aamilbabainlahore #blackmagicforlove #blackmagicformarriage #aamilbaba #kalajadu #kalailam #taweez #wazifaexpert #jadumantar #vashikaranspecialist #astrologer #palmistry #amliyaat #taweez #manpasandshadi #horoscope #spiritual #lovelife #lovespell #marriagespell#aamilbabainpakistan #amilbabainkarachi #powerfullblackmagicspell #kalajadumantarspecialist #realamilbaba #AmilbabainPakistan #astrologerincanada #astrologerindubai #lovespellsmaster #kalajaduspecialist #lovespellsthatwork #aamilbabainlahore #Amilbabainuk #amilbabainspain #amilbabaindubai #Amilbabainnorway #amilbabainkrachi #amilbabainlahore #amilbabaingujranwalan #amilbabainislamabad
how can I sell my pi coins for cash in a pi APPDOT TECH
You can't sell your pi coins in the pi network app. because it is not listed yet on any exchange.
The only way you can sell is by trading your pi coins with an investor (a person looking forward to hold massive amounts of pi coins before mainnet launch) .
You don't need to meet the investor directly all the trades are done with a pi vendor/merchant (a person that buys the pi coins from miners and resell it to investors)
I Will leave The telegram contact of my personal pi vendor, if you are finding a legitimate one.
@Pi_vendor_247
#pi network
#pi coins
#money
USDA Loans in California: A Comprehensive Overview.pptxmarketing367770
USDA Loans in California: A Comprehensive Overview
If you're dreaming of owning a home in California's rural or suburban areas, a USDA loan might be the perfect solution. The U.S. Department of Agriculture (USDA) offers these loans to help low-to-moderate-income individuals and families achieve homeownership.
Key Features of USDA Loans:
Zero Down Payment: USDA loans require no down payment, making homeownership more accessible.
Competitive Interest Rates: These loans often come with lower interest rates compared to conventional loans.
Flexible Credit Requirements: USDA loans have more lenient credit score requirements, helping those with less-than-perfect credit.
Guaranteed Loan Program: The USDA guarantees a portion of the loan, reducing risk for lenders and expanding borrowing options.
Eligibility Criteria:
Location: The property must be located in a USDA-designated rural or suburban area. Many areas in California qualify.
Income Limits: Applicants must meet income guidelines, which vary by region and household size.
Primary Residence: The home must be used as the borrower's primary residence.
Application Process:
Find a USDA-Approved Lender: Not all lenders offer USDA loans, so it's essential to choose one approved by the USDA.
Pre-Qualification: Determine your eligibility and the amount you can borrow.
Property Search: Look for properties in eligible rural or suburban areas.
Loan Application: Submit your application, including financial and personal information.
Processing and Approval: The lender and USDA will review your application. If approved, you can proceed to closing.
USDA loans are an excellent option for those looking to buy a home in California's rural and suburban areas. With no down payment and flexible requirements, these loans make homeownership more attainable for many families. Explore your eligibility today and take the first step toward owning your dream home.
how can I sell pi coins after successfully completing KYCDOT TECH
Pi coins is not launched yet in any exchange 💱 this means it's not swappable, the current pi displaying on coin market cap is the iou version of pi. And you can learn all about that on my previous post.
RIGHT NOW THE ONLY WAY you can sell pi coins is through verified pi merchants. A pi merchant is someone who buys pi coins and resell them to exchanges and crypto whales. Looking forward to hold massive quantities of pi coins before the mainnet launch.
This is because pi network is not doing any pre-sale or ico offerings, the only way to get my coins is from buying from miners. So a merchant facilitates the transactions between the miners and these exchanges holding pi.
I and my friends has sold more than 6000 pi coins successfully with this method. I will be happy to share the contact of my personal pi merchant. The one i trade with, if you have your own merchant you can trade with them. For those who are new.
Message: @Pi_vendor_247 on telegram.
I wouldn't advise you selling all percentage of the pi coins. Leave at least a before so its a win win during open mainnet. Have a nice day pioneers ♥️
#kyc #mainnet #picoins #pi #sellpi #piwallet
#pinetwork
Falcon stands out as a top-tier P2P Invoice Discounting platform in India, bridging esteemed blue-chip companies and eager investors. Our goal is to transform the investment landscape in India by establishing a comprehensive destination for borrowers and investors with diverse profiles and needs, all while minimizing risk. What sets Falcon apart is the elimination of intermediaries such as commercial banks and depository institutions, allowing investors to enjoy higher yields.
Empowering the Unbanked: The Vital Role of NBFCs in Promoting Financial Inclu...Vighnesh Shashtri
In India, financial inclusion remains a critical challenge, with a significant portion of the population still unbanked. Non-Banking Financial Companies (NBFCs) have emerged as key players in bridging this gap by providing financial services to those often overlooked by traditional banking institutions. This article delves into how NBFCs are fostering financial inclusion and empowering the unbanked.
what is the best method to sell pi coins in 2024DOT TECH
The best way to sell your pi coins safely is trading with an exchange..but since pi is not launched in any exchange, and second option is through a VERIFIED pi merchant.
Who is a pi merchant?
A pi merchant is someone who buys pi coins from miners and pioneers and resell them to Investors looking forward to hold massive amounts before mainnet launch in 2026.
I will leave the telegram contact of my personal pi merchant to trade pi coins with.
@Pi_vendor_247
The secret way to sell pi coins effortlessly.DOT TECH
Well as we all know pi isn't launched yet. But you can still sell your pi coins effortlessly because some whales in China are interested in holding massive pi coins. And they are willing to pay good money for it. If you are interested in selling I will leave a contact for you. Just telegram this number below. I sold about 3000 pi coins to him and he paid me immediately.
Telegram: @Pi_vendor_247
Currently pi network is not tradable on binance or any other exchange because we are still in the enclosed mainnet.
Right now the only way to sell pi coins is by trading with a verified merchant.
What is a pi merchant?
A pi merchant is someone verified by pi network team and allowed to barter pi coins for goods and services.
Since pi network is not doing any pre-sale The only way exchanges like binance/huobi or crypto whales can get pi is by buying from miners. And a merchant stands in between the exchanges and the miners.
I will leave the telegram contact of my personal pi merchant. I and my friends has traded more than 6000pi coins successfully
Tele-gram
@Pi_vendor_247
Poonawalla Fincorp and IndusInd Bank Introduce New Co-Branded Credit Cardnickysharmasucks
The unveiling of the IndusInd Bank Poonawalla Fincorp eLITE RuPay Platinum Credit Card marks a notable milestone in the Indian financial landscape, showcasing a successful partnership between two leading institutions, Poonawalla Fincorp and IndusInd Bank. This co-branded credit card not only offers users a plethora of benefits but also reflects a commitment to innovation and adaptation. With a focus on providing value-driven and customer-centric solutions, this launch represents more than just a new product—it signifies a step towards redefining the banking experience for millions. Promising convenience, rewards, and a touch of luxury in everyday financial transactions, this collaboration aims to cater to the evolving needs of customers and set new standards in the industry.
how to sell pi coins at high rate quickly.DOT TECH
Where can I sell my pi coins at a high rate.
Pi is not launched yet on any exchange. But one can easily sell his or her pi coins to investors who want to hold pi till mainnet launch.
This means crypto whales want to hold pi. And you can get a good rate for selling pi to them. I will leave the telegram contact of my personal pi vendor below.
A vendor is someone who buys from a miner and resell it to a holder or crypto whale.
Here is the telegram contact of my vendor:
@Pi_vendor_247
1. Lehman Brothers 11th Annual
Financial Services Conference
Jeffrey M. Peek
Chairman & Chief Executive Officer
London, England
May 20, 2008
2. Lehman Brothers 11th Annual
Financial Services Conference
Jeffrey M. Peek
Chairman & Chief Executive Officer
London, England
May 20, 2008
Notices
Forward Looking Statements
Certain statements made in these presentations that are not historical facts may constitute “forward-
looking” statements under the Private Securities Litigation Reform Act of 1995, including those that are
signified by words such as “anticipate”, “believe”, “expect”, “estimate”, “target”, and similar expressions.
These forward-looking statements reflect the current views of CIT and its management and are subject
to risks, uncertainties, and changes in circumstances. CIT’s actual results or performance may differ
materially from those expressed in, or implied by, such forward-looking statements. Factors that could
affect actual results and performance include, but are not limited to, potential changes in interest rates,
competitive factors and general economic conditions, changes in funding markets, industry cycles and
trends, uncertainties associated with risk management, risks associated with residual value of leased
equipment, and other factors described in our Form 10-K for the year ended December 31, 2007 and
Form 10-Q for the quarter ended March 31, 2008 filings. CIT does not undertake to update any forward-
looking statements.
This presentation is derived from CIT’s publicly available information and is to be used solely as part of
CIT management’s continuing investor communications program. This presentation has not been
prepared in connection with, and should not be used in connection with, any offering of securities by CIT.
For the sale of any securities by CIT you are directed to rely only upon the offering document for those
particular securities.
Data as of or for the period ended March 31, 2008 unless otherwise noted.
2
1
3. Agenda
Business Update
Focus Areas
Funding & Liquidity
Long-Term Model
3
Leading Provider of “Capital” For the Middle Market
Global brand, market leader & long-standing relationships
Franchise
Broad-based revenues and spread of risk
Diversity
Engrained culture and solid commercial performance
Credit Quality
Strong base and disciplined management
Capital
Solid commercial returns
Profitability
Experienced management
Governance
4
2
4. Business Model: Deliver Earnings Through All Cycles
Weak Economy
Strong Economy
Competitors enter, Competitors exit,
margin decline offset pricing improves,
by lower credit costs credit costs rise
Performance Improves Performance Improves
Increased originations Factoring (credit protection)
Robust secondary market Restructuring / DIP
Equipment Utilization Distressed Debt
Mergers and Acquisitions Lease Renewals
5
Taking Actions to Manage Profitability and Liquidity
Corporate Transportation Trade Vendor
Finance Finance Finance Finance
• Increased
• Strong demand for • Global demand
interest in 3rd
loans for new aircraft • Pockets of
Market party providers
softness in retail
Environment • Demand for rail sales and credit
• Disrupted • Reduced sales
cars stable (ex
syndication market volumes
housing-related)
• Improving
• Placed air orders • Extending
• Increasing pricing
Profitability commissions
through 2010 leases
Actions • Managing retail
• Strengthening • Extended rail • Driving
credits
covenant packages lease terms efficiencies
• Prioritizing liquidity • Establishing • Utilizing secured • Prioritizing
Liquidity to key accounts secured facilities facility liquidity to JV’s
and top
Actions • CIT Bank • Executing aircraft
accounts
originating loans sales
6
3
5. Commercial Segments Continue to Perform
Lending, leasing and other financial and advisory
Corporate $25B Managed Assets
services to middle market companies, with a focus on 8% ROE1
Finance specific industries
Trade Factoring, lending, receivables management and $7B Managed Assets
trade finance to companies in retail supply chain
Finance 16% ROE
Transportation Lending, leasing and advisory services to the $14B Managed Assets
transportation industry, principally aerospace and rail
Finance 20% ROE
Vendor Financing and leasing solutions to manufacturers and $16B Managed Assets
distributors around the globe 6% ROE2
Finance
1Q08 Commercial Results3
EPS: $0.82 ROE: 12.1%
As of or for the 3 months ended 3/31/2008.
1. Excludes pretax charge of $118M on assets held for sale related to an agreement to sell $4.6B of asset-based loans and commitments
7
2. Excludes pretax impairment charge of $33M related to the 2007 sale of our Dell Financial Services joint venture equity interest
3. Including unallocated Corporate Expenses
Efficiency Initiatives Underway
Total Expenses ($M)
Reducing headcount
− 500 positions eliminated in first quarter
− Largest impact on Vendor Finance, Corporate $1,479
Finance & Shared Services
− Additional reduction of 150 positions in Student
Lending in second quarter $1,383
Target
Streamlining functions & eliminating duplicate efforts $100M 1
Expense
− Consolidating underwriting and portfolio
Reduction
management across similar businesses
− Further off-shoring of non-critical functions
Manage discretionary spend
− Reducing advertising, T&E and professional
2006 2007 2008
services
1. Represents annualized expense reduction
8
4
6. Commercial Credit Quality
Credit Losses ($M)
$466
$234
1.75%
$174
$127
$120 $67
0.82%
0.56% 0.36% 0.63%
0.32%
2003 2004 2005 2006 2007 Q108
Net Charge-offs % of AFR
Non-Performing Assets
Delinquency 60+ Days
$700
$707
$520
$612
$478
$527
$362
$444
$433 $316
$307
$402 1.68%
1.87%
1.90%
1.70%
1.46% 1.47%
1.32% 1.23% 1.22% 1.15%
0.87%
1.01%
2003 2004 2005 2006 2007 Q108
% of FR
Delinquent Repo % of FR
Non-Accrual
Owned portfolio statistics: excludes Consumer and Home Lending segments
9
Limited Exposure to Some Current Areas of Focus
Reliance on highly engineered financial products
Investments in third-party originated CLOs or CDOs
No Commitments to fund under conduit facilities/ SIV’s
Large leveraged buyout obligations
Exposure to airlines that recently shutdown
Commercial real estate exposure
Construction industry exposure
Minimal Unsecured exposure
Coverage from monoline insurers
Trucking industry exposure
10
5
7. Prudent Consumer Liquidation Strategy
Student Lending Home Lending
Wrote-off all goodwill and Collect on $9.4B of contractual
intangibles Q4 2007 balances with a carrying value of
Ceased all student loan originations $8.7B and $0.4B of reserves
in April 2008
Improved servicing processes
−
$20M restructuring charge
−
Refined staffing model
−
Servicing existing obligations:
Enhanced Analytics
−
Servicing platform unaffected
−
Aggressively manage REO portfolio
~$200M of commitments remain
−
$12.6B portfolio composition: Evaluate reserve adequacy quarterly
and provision accordingly
$11.9B government guaranteed
−
$ 0.7B private student loans
− Mitigate risk and maximize liquidity
11
Home Lending Exposure & Risk Transfer
$9.8 B
Repo
$.15 B
Assets
$. 7 B
$0.3B
Repo
Discount $. 4 B
Discount &
Valuation $8.5 B
Reserves
Reserve for
$6.6 B
Credit Loss
Receivables $1.9 B
Held for Notes
Investment Retained
$9.4 B
Economic Risk Analysis:
Receivables / Repo (CB) $3.2B* $4.7 B
AAA
Securitization assets 1.9
Notes
Total $5.1
Sold
Less: Discount & Reserves (1.2)
Maximum Exposure $3.9B
Carrying Value “Mortgages
Capital Allocated to Segment ~$1.0B
Contractual Balance
Less Reserve Securitized”
3/31/2008
12
* Contractual balance (CB) of $9.8B less $6.6B securitized.
6
8. Multi-Faceted Approach to Funding – Steady Progress
Maintain ample cash balances
Execute planned asset sales
Bolster Near-term Liquidity Continue to source secured financings
Manage asset originations / use CIT Bank
Execute public asset-backed transactions
Monitor term debt market opportunities
Return to Public Markets
Commence pay-down of bank facilities
Return to commercial paper market
Reduce reliance on wholesale funding
Expand deposit base
Solidify Long-Term Model
Explore funding partner
Enhance credit ratings
13
Proven Liquidity Into 2009
2008 – Significant Sources & Uses of Cash
Sources Uses
Available cash at 3/31 $8.4B* Debt Maturities:
Available ABS facilities at 3/31 1.9 Commercial paper $1.3B
Capital raise - common 1.0 Bank borrowings 2.1
Capital raise - preferred 0.6 Unsecured term debt 8.1
Asset-based loan sale 1.4 Deposits 0.9
Aircraft sales 0.5 Aircraft purchases 1.5
Deposit issuance 0.9
Total sources $14.7B Total uses $13.9B
• Base case analysis assuming no further liquidity actions taken in 2008, flat assets
(excluding agreed upon sales) and no unsecured debt issuance
• ABL and aircraft sales progressing as planned – expected closings Q2
• High degree of confidence in ability to resume deposit issuance from CIT Bank
* $10.3 billion cash on balance sheet less $1.9 billion restricted cash and non-immediately liquid cash amounts 14
7
9. Significant Additional Liquidity Sources Identified
Asset Sale / Secured Unsecured
Potential Liquidity Source
Liquidation Financing Financing
Ongoing liquidation of the home lending & consumer portfolios X
Rail business under strategic review X
Middle-market and syndicated loans being studied for possible
X X
sale/securitization
Considering ECA financing for new aircraft; secondary market
X X
demand remains strong for existing fleet
Maintain Vendor and Corporate Finance securitization programs X
Grow deposits in CIT Bank X
Opportunistic term debt issuance X
Additional $8-$12 Billion
$8-
15
Maintaining a Strong Capital Base
Total Capital1
($ in Millions)
10,000 ~$9,680
$8,401
$7,949
8,000 $7,215
$6,310
6,000 $5,650
4,000
2,000
0
2
2003 2004 2005 2006 2007 Q1 08 Proforma
Common Equity Non-common equity
Tangible Capital
10.4% 10.7% 9.8% 9.4% 8.8% 10.2%
to
Managed Assets
Issued $750 million of junior subordinated debt and $690 million of convertible “equity units” in 2007
Issued $1.0 billion of common equity and $575 million of convertible preferred stock April 2008
1. Capital = common stock + preferred stock + mandatory convertible +junior subordinated securities
16
2. Based on March 31, 2008 data adjusted for the April 2008 capital raises
8
10. Expected 2008 Consolidated Financial Trends
Q2-Q4 2008
Metric Q1 2008 Comments
Expected vs Q1
• Increased cash balance
• Reduced leverage
Finance Margin 2.35% Flat – Down slightly
• Cost to re-enter market
• Stable commercial losses
Commercial: $98 Commercial: Flat
• HL provisions down slightly
Loss Provisions
Consumer: $367 Consumer: Down
• SL provisions down
• Modest fee increase
$174 million Flat – Up slightly
Other Income
• Asset sale/syndication
(incl. $33 million charge) (excl. Q1 charge)
• Restructuring realization
Operating Expenses $318 million Flat – Down slightly
• Ongoing management
• Asset sales
Managed Assets $84 billion Down
• Origination management
17
Vision for the Future
Capital Structure
Business Demographics
Balanced funding model
Commercial finance company focused
on the middle market Increased use of deposits
Higher levels of capital
Quality portfolio, broad spread of risk
Strong investment grade ratings
Diverse revenue streams
Dividend aligned with capital generation
Global franchise
Financial Model
Single-digit asset growth
Double-digit revenue growth Premium Valuation
Double-digit return on equity
18
9
11. Building a Strong Foundation for a Second Century of Growth
Sustainable Performance & Returns
Leading commercial
finance provider to the
middle-market Global Operations
Diverse Portfolio
Broad-Based Revenues
Deep Industry Expertise
Disciplined Credit Culture
with 100 years of success
Long-Standing Relationships
19
20
10
12. Diverse and Quality Portfolio
Balanced Portfolio1 Secured Commercial Lender1
(% Financing and Leasing Assets) (% Commercial Exposure Secured by:)
Communications Unsecured <1%
Consumer Other
Wholesale 3% 2%
2%
Transportation 4%
Other2
Healthcare 5%
18%
Cash Flow
Services 21%
6%
Asset Financings
Student Lending
Factoring
Retail 45%
16%
9% 10%
Equipment
Commercial
Air 24%
Manufacturing
11% Home
13%
Lending
11%
Risk Mitigation
Expanded into non-cyclical industries Building international franchises
Growing fee based services Established asset management vehicles
Managing capital in more cyclical industries Expanded risk management capabilities
1. As of industry served greater than 3%
* No other March 31, 2008.
21
2. No other industry served greater than 2%.
Broad Spread of Economic Risk
Initiatives 26% of Portfolio Assets Outside US
Europe Non-US Owned Portfolio
• Expanded Dublin Servicing Center for Vendor ~$21 Billion
• Acquired vendor business in U.K. and Germany South Pacific
• Integrated Factoring platform in Germany 6%
• Expanding global relationship with Microsoft
Latin America
• Leveraging tax efficient Dublin structure for Aerospace Canada
11%
• Expanded UK leveraged finance team 23%
Canada Other
9%
• Full suite of commercial products and services
• Expanding middle-market corporate finance team
Asia Pacific
Europe
10%
Asia Pacific 42%
• Opened new centralized servicing center in Shanghai
• Servicing Aerospace through Singapore
• Largest foreign owned leasing company in China
Middle East
• Doubled number of aircraft in the region
As of March 31, 2008.
22
11
13. Reducing Level of Unfunded Credit Commitments
At March 31
Unfunded Commitments $11 billion
Vendor Lines1 $(2 billion)
Lines2
Unavailable $(2 billion)
Net Commitments $7 billion
• Planned sale of $1.4 billion of asset-based loans and $3.2 billion of unfunded
commitments further reduces exposure
• Diverse portfolio spread among numerous clients, sectors and geographies
• Many commitments are CIT’s participation in broadly syndicated loans or asset
based, ie. client must post collateral to draw
1. Requires asset purchase by customer and needs approval confirmation by CIT. 23
2. Based upon covenants and asset availability
Investment Grade Debt Ratings
Agency Short Term Long Term Outlook / Watch
Moody’s P-2 A3 Negative
S&P A-2 A- Negative
Fitch F2 A- Negative
DBRS R-1 Low A Negative
24
12
14. Q1 2008 Financings
• $2.7B Asset backed issuance at weighted average cost of ~LIBOR+100 to 125 bps
$2.2B on balance sheet - Rail, Middle Market Loans, Student Loans, Trade Receivables
−
$0.5B off balance sheet - Vendor
−
• $0.6B Unsecured term retail notes at weighted average coupon of ~6.75%
• $7.3B bank borrowings at weighted average cost of ~LIBOR+50 bps
No MAC Clause; only financial covenant is maintenance of $4B minimum net worth
−
Staggered Maturities:
−
$2.1B October 2008 $2.1B April 2010
$2.1B April 2009 $1.1B December 2011
25
CIT Bank Funding Platform
• Industrial bank chartered in 2000 and located in Utah
• Significant level of under deployed cash remains in the Bank following Home
Lending exit
• Attractively priced deposits remain outstanding
WAC of 5.5%
WAM of 15 months
• Meaningful incremental funding capacity available in wholesale CD market. For
new deposits:
• The brokered deposit market is deep and recognized by financial institutions as a
stable source of funding
$249 billion market1
Over 3,000 banks active in the market1
Current market turbulence has produced a flight to quality sentiment, resulting
in greater investor demand1
26
1. Source: Merrill Lynch Update: The Brokered CD Market and Industrial Banks, April 2008
13
15. Recent Capital Offerings
Supports All Aspects of Liquidity Plan
Deal Terms
Re-access the capital markets
Common Equity
Leverage market window
Amount1 $1 billion
Enhance bondholder confidence
Shares 94 million
Bolster the capital base
Price $11.00
Maintain balance sheet strength
Convertible Preferred
Provide cushion against potential
Amount1 $575 million
loss
Dividend Yield 8.75%
Fortify liquidity position
Conversion Price $12.65
Increase operating flexibility
Liquidation Value $50.00
Facilitate return to unsecured debt
Ticker Symbol CITprC markets
1. Includes partial exercise of underwriters purchase option for common shares and full exercise of underwriters option for preferred 27
shares.
Solid Capital Position
($ billions)
10
9
$1.2
8
Consumer (2%)
7 Home Lending
Total Pro-forma
(11%)
6 Required Actual
Vendor Finance
(8%)
$8.6 $9.7
5 Trade Finance
(11%)
4
Transportation Finance
3 (12%)
2
Corporate Finance
1 (10%)
0
Business Goodwill Capital1,2
Capital1
Requirements
1. Capital = common stock + preferred stock + mandatory convertible +junior subordinated securities
28
2. Based on March 31, 2008 data adjusted for the April 2008 capital raises
14
16. 2007: Commercial Earnings Offset by Consumer/Home Lend Loss
Managed Assets (%) Net Income ($M)
$1.3B
Trade Finance $164
Trade Finance
9%
Transportation Finance $271
16% Transportation Finance
Vendor Finance1 $410
73%
19% Vendor Finance
$453
Corporate Finance2
$0
$(275)
Consumer
Corporate Finance
29%
$(989)
Home Lending
15% Consumer
27%
12% Home Lending
$(1.3B)
As of or for the full year ending December 31, 2007; Net Income excludes Corporate and Other net loss of $145 million.
1. Includes impact from 2 acquisitions and sales of ownership interest in Dell JV and systems leasing business
29
2. Includes impact from sale of construction business
1Q08 Results: Commercial Franchise Continues to Deliver
Net Income
• Uninterrupted service to key customers
EPS ROE
/ (Loss)
• Healthy levels of new business volume
Net loss – reported $(257M) $ (1.35) -15.8%
• Significant levels of unencumbered assets
Home lending and
(249M) (1.30)
consumer segments
• Broad based operating expense reductions
*
Noteworthy items (166M) (0.87)
• Continued strength in credit quality
Commercial results, • Market leadership positions intact
$ 157M $ 0.82 12.1%
including corporate
* Noteworthy items include:
$118M pre-tax lower of cost or market adjustment
$33M pre-tax retained interest impairment charge
$148M pre-tax mark to market charge on terminated hedges
$69M pre-tax charge for severance and restructuring
30
15
17. Corporate Finance
Return on Risk Adjusted Capital
14.6% 18.3%
13.6%
13.4% 13.7%
2007*
2003 2004 2005 2006
2008 Priorities / Outlook
Market Environment
Continued focus on improving yield and
Continued disruption in the leveraged loan
structure
market; more pronounced in larger
transactions as opposed to the middle market Build on long-standing client relationships
Loan syndication market likely to remain Invest in focus industries – Healthcare,
challenged through mid-year 2008 Commercial & Industrial, Communications,
Media & Entertainment, and Energy
Trend towards “originate & hold” & club deals
Enhance penetration in advisory products
Significant improvement in yields and structure
and services by leveraging recent
on new originations
acquisition
Increased opportunities in distressed debt and
Streamline credit and operations platforms
restructuring
* Includes $240M pre-tax gain on sale of U.S. Construction Portfolio
31
Benefits of CIT’s Middle Market Focus
Private Equity M&A Volume and Number of Deals
Large Cap Middle Market
$16,000 70
$200,000 40
$180,000 $14,000
35 60
$160,000 $12,000
30 50
Deal Value ($mm)
$140,000
Deal Value ($mm)
$10,000
25
$120,000
# of Deals
# of Deals
40
$100,000 20 $8,000
30
$80,000 15 $6,000
$60,000 20
10 $4,000
$40,000
5 10
$2,000
$20,000
$0 0 $0 0
J06 F MAM J J A S O N D J07 F MAM J J A S O ND J06 F M A M J J A S O N D J07 F M A M J J A S O N D
Deal Value (US$mm) # of Deals
CIT Delivers Integrated Value Proposition To Key Customer Relationships
Lender M&A Advisor Lender
M&A Advisor
$128,000,000
Senior Secured Credit
Facilities were provided for
a portfolio company of
the acquisition of
by
has been acquired
by a group led by
October
Sole Lead
2007
Arranger and
Sole Bookrunner
33
32
16
18. Transportation Finance
Return on Risk Adjusted Capital
18.4%
16.3%
9.2%
7.1% 7.0%
2003 2004 2005 2006 2007
2008 Priorities / Outlook
Market Environment
Optimize aircraft portfolio given strong order
Favorable global aerospace trends continue:
book and market demand
Demand for air travel remains strong,
Continue build-out of global Business Air
particularly emerging markets
initiatives
Supply / demand balance favors lessors
Bring corporate finance solutions to
with strong order books
transportation customers
Unprecedented commitments for future
Actively manage railcar renewals and
deliveries
deliveries to optimize utilization
North American rail leasing remains solid
33
Attractive Transportation Fleet
Air Portfolio – Geographic Mix Rail Portfolio – Car Type
Under
Middle East/Africa 15% 10%
North Flat
Oth
Latin America
Ta
er
America
nk
Coal
Europe
Asia Box
Covered
Pacific
Go
nd
ola
s
Total Fleet: 289 Planes Total Fleet: 100K Cars
Number of accounts 104 Wtd Average Age ~6 years
Wtd Average Age: ~6 Years Current Utilization: 95%
Current Utilization: 100% 2008 New Deliveries: ~8K Cars
2008 New Deliveries: 23 Planes 2008 Lease Expiration: ~18%
2008 Lease Expiration: ~10%
As of March 31, 2008 34
17
19. Trade Finance
Return on Risk Adjusted Capital
17.9% 18.7% 19.8% 18.3%
17.8%
2003 2004 2005 2006 2007
2008 Priorities / Outlook
Market Environment
Macroeconomic trends point to Improve efficiency of global factoring
potentially weaker retail trends platform
Less favorable retail environment Implement cross-geography solutions
increases value of factoring
Carefully monitor credit environment and
Stable competitive landscape in the US refine risk-based pricing strategy
Market evolving in Europe and Asia Expect increase in factoring
commissions
Global trading flows likely to become
more important (e.g. Asian exports)
35
Vendor Finance
Return on Risk Adjusted Capital
27.0%
26.7%
23.6%
22.6% 21.4%
2007*
2003 2004 2005 2006
Market Environment 2008 Priorities / Outlook
Growth in certain sectors (e.g. Improve efficiency globally, including
technology, health care) and non-US businesses acquired in 2007
geographies
Mitigate impact from sale of Dell JV
Continued shift towards large, global
Expand existing global relationships;
providers
focus on margins
Services and software becoming more
Reduce administrative delinquencies
prevalent in addition to equipment
Trend towards divestiture of captives by
large manufacturers
36
* Includes $268M pre-tax gain on sales of CIT’s interest in its Dell Financial Services JV and of its U.S. Systems Leasing Portfolio
18
20. Vendor Finance Competitive Positioning is Very Strong
Key Attributes Captives Banks Independents
Organization alignment
to support vendors
Global reach Limited Limited Limited
Risk management expertise Limited
Residual management Limited Limited
Specialized products and
Limited
structures
Balance sheet /
Limited
syndication capabilities
37
Home Lending Portfolio Summary
Financial Statements Receivables Repo Total
Contractual Balance (CB) $9.4 $0.3 $9.8
Valuation Reserves & Discounts 0.7 0.1 0.8
Receivable Carrying Value 8.7 0.2 8.9
Loan Loss Reserves 0.4 --- 0.4
Total Discount & Reserves $1.1 $0.1 $1.2
Discount & Reserves as % of CB ~12% ~45% ~13%
Economic Risk Third Party CIT Total
Securitization Investments $4.7 $1.9* $6.6
Other Receivables & Assets --- 3.2 3.2
Total Gross Assets $4.7 $5.1 $9.8
Discount & Reserves as % of CIT Risk ~25%
CIT also has approximately $1.0 billion of capital allocated to the Home Lending Segment
* CIT holds subordinated interests in the securitization transactions
38
At March 31, 2008; Dollar amounts in billions
19
21. Home Lending – Cumulative Charges
Unpaid Principal Balance (UPB) at 6/30/2007 $11.3 B
Valuation Loan Loss Total
Charges Provisions Charges
Q2 07 765 0 765
Q3 07 466 0 466
Q4 07 42 256 298
Q1 08 23 218 241
Total 1,296 474 1,770
Cumulative charges as a percentage of 6/30/07 UPB ~16%
39
CIT Investor Relations - Key Contacts
Ken Brause
Executive Vice President
212-771-9650
ken.brause@cit.com
Steve Klimas
Senior Vice President
973-535-3769
steve.klimas@cit.com
Bhavin Shah
Assistant Vice President
973-597-2603
bhavin.shah@cit.com
40
20
23. Global Headquarters
505 Fifth Avenue
New York, NY 10017
212-771-0505
www.cit.com
Global Commercial Finance
Overview
CIT (NYSE: CIT), a leading global commercial finance company, provides a
comprehensive set of financial products and services to clients in more than
50 countries around the world. A leader in middle market financing, CIT has
more than $80 billion in managed assets and provides financial solutions for
more than half of the Fortune 1000.
Our diversified business platform serves more than one million clients
in more than 30 industries. We serve a wide variety of industries
including manufacturing, transportation, retailing, wholesaling, healthcare,
communications, technology, energy, real estate, financial sponsor and various
service-related industries. Each business has industry alignment and focuses
on specific sectors, products and markets with portfolios diversified by client
and geography.
Our century of growth has been fueled by an unyielding focus on meeting
our client’s financial needs and is balanced by our deep credit and risk
management culture. The CIT brand platform, Capital Redefined, articulates
CIT International
our value proposition of providing our customers with the relationship,
intellectual and financial capital to yield infinite possibilities. Founded in 1908, CIT has offices in more than 50 locations throughout North America,
CIT is celebrating its Centennial throughout 2008.
Europe, Latin America and Asia Pacific.
Financial Performance
2003 2004 2005 2006 2007
Net Income $567m $754m $936m $1,016m ($111m)*
Diluted EPS $2.66 $3.50 $4.44 $5.00 ($0.58)*
Dividends Per Share $0.48 $0.52 $0.61 $0.80 $1.00
10.9% 13.2% 15.1% 15.0% (1.6%)*
Return on Equity
* Reflects a $1.3 billion net loss from our Home Lending and consumer business.
citnet.cit.comlivfileMerrill_Consultants18_US_FactsheetsCIT GROUP INCCIT Group Inc_#4508.indd
Revenue
$9.0
$8.6
8.0
Debt Ratings
$6.9
7.0
Commercial Senior
$5.8
Paper Unsecured Debt
6.0
($ in billions)
$4.6 $4.7
DBRS R-1L A
5.0
Fitch Ratings F1 A
4.0
Moody’s Investors P-2 A3
3.0
A-2 A-
Standard & Poor’s
2.0 The credit ratings stated above are not a recommendation to buy, sell or hold securities and
may be subject to revision or withdrawal by the assigning rating organization. Each rating
should be evaluated independently of any other rating. As of 03/31/08.
1.0
0.0
2003 2004 2005 2006 2007
4/8/2008 6:39:42 P, Curt Ritter,4508
1
Finance Income Rental Income Other Income
1 Includes fees, commissions, asset gains and other income.
Contacts
Investor Relations: Media Relations:
Ken Brause C. Curtis Ritter
Executive Vice President Director of External Communications & Media Relations
212-771-9650 212-461-7711
Ken.Brause@cit.com Curt.Ritter@cit.com
25. FOR IMMEDIATE RELEASE
CIT REPORTS FIRST QUARTER RESULTS;
SIGNIFICANT PROGRESS ON LIQUIDITY PLAN
First Quarter Net Loss of $257 Million, $1.35 per share
Commercial Businesses earn $0.82 per share excluding Noteworthy Items
Credit Loss Reserves Strengthened
Quarterly Dividend Reduced to $0.10 per share
NEW YORK – April 17, 2008 – CIT Group Inc. (NYSE: CIT) today announced a series of
actions that demonstrate significant progress on the plans it announced on March 20, 2008 to improve its
liquidity position. These actions include:
• Agreeing to sell $4.6 billion of asset-based loan commitments, of which $1.4 billion is
currently drawn;
• Agreeing to sell $770 million of aircraft at a gain of approximately 10%, of which $300
million closed in the first quarter;
• Identifying another $2.0 billion of loan assets that will be either used for a secured
financing or sold during the second quarter;
• Funding $335 million of first quarter commercial loan originations through CIT Bank;
• Engaging financial advisors to explore various capital raising initiatives, including the
possible issuance of equity securities, and to evaluate strategic alternatives for the
Company’s $4 billion rail leasing business; and
• The declaration by the Board of Directors of a $0.10 per share quarterly dividend payable
on May 30, 2008 to shareholders of record on May 15, 2008.
The combination of these actions, in addition to existing cash balances, materially enhances the
Company’s liquidity and significantly advances its plan to reduce the size of the balance sheet.
The Company reported a net loss of $257.2 million, or $1.35 per share, for the first quarter of
2008. Commercial segment earnings were more than offset by a combined net loss in our home lending
and consumer lending segments, a non-cash charge related to terminated hedges, and severance costs. Net
income was $200.6 million, or $1.01 of diluted earnings per share, for the comparable 2007 quarter.
“The prolonged and pervasive dislocation in the capital markets continued to present significant
challenges for the financial services sector,” said Jeffrey M. Peek, Chairman and CEO. “CIT’s core
commercial businesses performed well against this turbulent backdrop, with particularly strong results in
Transportation and Trade Finance. Our overall loss for the quarter was driven largely by our liquidating
consumer businesses. Given the need to continue to bolster our balance sheet and preserve capital, the
Board of Directors has made the prudent but difficult decision to reduce the quarterly common stock
dividend by 60% to $0.10 per share.
“The liquidity actions we announced today, coupled with the quality and breadth of our portfolio,
provide us with increased flexibility to carry out future asset dispositions and evaluate funding and capital
raising alternatives in a judicious manner. As we look ahead, it’s clear we will operate a smaller, more
nimble company that is competitively positioned to take advantage of both economic contractions and
1
26. expansions. We are a recognized leader in the commercial middle market and remain committed to
providing intellectual and financial capital to our customers.”
The following table breaks down our reported results between our ongoing commercial
businesses, liquidating consumer segments, and other noteworthy items:
Net Income
/ (Loss) EPS ROE
Net loss - reported
results $ (257.2) $ (1.35) -15.8%
Home lending and
consumer segments (248.5) (1.30)
Noteworthy items (165.6) (0.87)
Commercial results,
including corporate $ 156.9 $ 0.82 12.1%
Net income for Commercial Segments and Corporate was $156.9 million, down from $267.9 million
in the prior year quarter and $368.8 million last quarter, reflecting lower finance margins, lower other
income and higher credit costs.
The noteworthy items in the table above are comprised of the following:
• A lower of cost or market valuation allowance pretax charge of $117.5 million (decrease to
EPS of $0.36) on assets held for sale in the Corporate Finance segment, reflecting the
agreement to sell $4.6 billion of asset-based lending commitments of which $1.4 billion
represents funded receivables that were classified as held for sale at March 31, 2008;
• A $33 million pretax impairment charge (decrease to EPS of $0.11), that should have been
recorded concurrently with the 2007 fourth quarter sale of our Dell Financial Services joint
venture equity interest, reflecting the repricing of debt cost underlying a securitization
conduit vehicle in the Vendor Finance segment; the charge relates to the fourth quarter
financial statements, as it was triggered by the buy out of CIT’s joint venture equity in the
fourth quarter of 2007;
• A pre-tax charge, in Corporate and other, of approximately $148 million related to losses on
swaps that hedged the now inactive commercial paper program (decrease to EPS of $0.47)
and were previously recorded in Other Comprehensive Income. An offsetting pre-tax gain of
approximately $140 million on the termination of a corresponding amount of swaps with
essentially offsetting economics was deferred and will be amortized over the remaining life of
those terminated swaps;
• Pre-tax charges of $69 million, primarily reflecting costs associated with severance and
termination expenses related to approximately 500 employees in corporate and other
(decrease to EPS of $0.22); and
• Tax benefits of approximately $56 million relating to applying the projected annual effective
tax rate for 2008, including the projected income mix between international and domestic
operations (increase to EPS of $0.29).
2
27. The loss of $248.5 million in the Home Lending and Consumer Segments was primarily driven
by $270 million in reserve building during the quarter ($150 million for Home Lending, $120 million for
Student Lending), reflecting continued deterioration in the home lending markets and seasoning of the
home lending portfolio and reserves for private (non-government guaranteed) loans, principally to
students of a pilot training school that filed bankruptcy during the quarter.
Consolidated Financial Highlights:
Liquidity, Funding and Capitalization
• The Company has taken significant actions to bolster its liquidity position. We agreed in April to
sell $4.6 billion of asset based loans and related commitments ($1.4 billion of loans and $3.2
billion of commitments). We also have agreements to sell $770 million of aircraft, of which $300
million closed in the first quarter. An additional $2.0 billion in assets have been identified to be
financed or sold. Finally, the Company is exploring the potential sale of its $4.0 billion railcar
leasing business.
• Our total cash position increased to $10.3 billion at quarter end, from $6.8 billion at December
31, 2007. This cash includes $7.0 billion of immediately available cash, $1.4 billion of cash and
short-term investments at our Utah bank, $0.6 billion of other cash balances, and $1.3 billion of
restricted cash (largely related to securitization transactions).
• During the quarter, we raised approximately $10.6 billion of financing including $7.3 billion from
our bank lines, $2.7 billion of asset-backed financing and $0.6 billion of unsecured retail notes.
Asset-backed financing, secured by rail assets, middle-market loans, trade finance receivables,
student loans and mortgages, included $2.2 billion of on-balance sheet secured borrowings and
$0.5 billion of off-balance sheet securitization transactions.
• Principal uses of cash during the quarter included $1.5 billion to pay maturing commercial paper,
$1.6 billion to pay maturing debt, $1.7 billion to fund portfolio growth and a $1.0 billion
reduction in credit balances to factoring clients.
• We had approximately $50 billion of unencumbered portfolio assets at March 31, 2008,
essentially unchanged from December 31, 2007.
• Outstanding commercial paper declined from $2.8 billion at December 2007 to $1.3 billion at
March 31, 2008 due to our suspension of the Company’s commercial paper program.
• The ratio of total tangible equity to managed assets at March 31, 2008 declined to 8.33% from
8.82% last quarter and is currently below our target of 8.50%. The Company’s announced
liquidity actions are designed to strengthen the ratio to well above our target.
• In addition, the Company may use the proceeds of any offering of common equity to facilitate the
payment of quarterly dividends of approximately $8.0 million on the Company's Series A and
Series B preferred stock in June.
Net Finance Revenue
• Net finance revenue was down 11% from last quarter and 10% from last year primarily reflecting
lower interest rates and higher borrowing costs. Average earning assets increased 1% over the
prior quarter and 9% over last year.
• Net finance revenue as a percentage of average earning assets was 2.35%, down from 2.67% last
quarter and 2.83% last year, as interest expense reflected the widening of CIT credit spreads and
the cost of maintaining excess cash balances. The net finance revenue comparisons also reflected
lower rates of lease renewals on certain operating leases and higher levels of non-accrual assets.
3