Optimization of Assembly Line and Plant Layout in a Mass Production Industry...
02 v2 n3-full
1. Journal of Industrial and Systems Engineering
Vol. 2, No. 3, pp 180-196
Fall 2008
Implementation of a Lean Model for Carrying out Value Stream
Mapping in a Manufacturing Industry
V. Ramesh1*, K.V. Sreenivasa Prasad2, T.R. Srinivas3
Department of I & P Engg., SJCE, Mysore, India
1
vajram_ramesh@yahoo.com, 2kvsprasad3@yahoo.com, 3shashisrini@yahoo.com
ABSTRACT
Value Stream Mapping technique involves flowcharting the steps, activities, material flows,
communications, and other process elements that are involved with a process or transformation.
In this respect, Value stream mapping helps an organization to identify the non-value-adding
elements in a targeted process and brings a product or a group of products that use the same
resources through the main flows, from raw material to the arms of customers. In this study, a
practical study carried out in a manufacturing industry for the manufacture of Machining center
is discussed. The main aim was to draw the current state value stream mapping for the main
components like Base, Column, Cross Slide, Milling Head and Table. Further, the paper has
identified some of the processes which can be carried out by the sub contractor and suggested
measures to be taken up by the higher level management in reducing the non value added
process. It discusses the reduction in the set up time and cycle time that can be obtained through
the implementation. This paper also discusses the plan of action for improving the Future State
Value Stream Mapping (FVSM). A FVSM for the manufacture of Base is drawn.
Keywords: Current state value stream mapping (CVSM), Future state value stream mapping
(FVSM), Value added time.
1. INTRODUCTION
The research study was carried out in a CNC manufacturing unit located in Bangalore, which
manufactures cylinder heads, cylinder blocks, crank case crank shaft, connecting rod etc, to the
Automobile, Textile, Defense, Agricultural, Railway and Electrical sectors. They are also the
manufacturers of Special Purpose Machines. The study discusses the implementation of Value
Stream Mapping carried out in the CNC machining center division of the industry. The main aim
was to reduce the cycle time and to eliminate unwanted facilities and suggest improvement
measures from the lean manufacturing perspective. Hence, the research work focuses on mapping
the current state, reducing the cycle time and the setup time and suggests a future state value stream
mapping for the manufacture of a machining center.
The objectives for the implementation of the lean manufacturing tools in this industry are
• To study the Current State Value Stream Mapping by collecting the preliminary data.
*
Corresponding Author
2. Implementation of a Lean Model for Carrying … 181
• To identify the problems faced by the Industry in terms of Non Value Added time
• To propose Future State Value Stream Mapping which can increase the Value added time and
reduce non value added time.
2. LITERATURE SURVEY
Taiichi Ohno (1988), Womack et al (1990), Womack and Jones (1998, 2005), Daniel. T. Jones
(2006), Rother and Shook (1999), and Peter Hines and Nick Rich (1997) have studied the
implementation of Value Stream Mapping effectively.
In essence, Value Stream Mapping (VSM) is a visualization tool oriented to the Toyota version of
Lean Manufacturing (Toyota Production System). It helps to understand and streamline work
processes using the tools and techniques of Lean Manufacturing. The goal of VSM is to identify,
demonstrate and decrease waste in the process. Waste being any activity that does not add value to
the final product, often used to demonstrate and decrease the amount of ‘waste’ in a manufacturing
system. VSM can thus serve as a starting point to help management, engineers, production
associates, schedulers, suppliers, and customers recognize waste and identify its causes. As a result,
Value Stream Mapping is primarily a communication tool, but is also used as a strategic planning
tool, and a change management tool. Toyota have been benefiting since 1940’s, from Material and
Information Flow Mapping (Value stream mapping).
Taiichi Ohno (1988) could not see waste at a glance (especially across a geographical area). He
developed Material and Information Flow Mapping (VSM) as a standard method for mapping the
flows visually and it became the standard basis for designing improvements at Toyota - as a
common language. It became one of their business planning tools. VSM is now utilized throughout
the world, in many businesses to strategically plan and it is the starting point to any lean
transformation and implementation.
Womack and Jones (1998) and Moore (2006) have stated that, the organizations of many types are
implementing lean manufacturing, or lean production, practices to respond to competitive
challenges. They have mentioned that lean initiatives can be taken up in the fields of automotive
sector, aerospace, and consumer goods industries around the world. Moore has discussed various
implementation tools of Lean Manufacturing, which can be incorporated in the industries.
Rother and Shook (1999) have discussed that Value Stream Mapping (VSM) is used to define and
analyze the current state for a product value stream and design a future state focused on reducing
waste, improving lead-time, and improving workflow. The use of VSM appears to be increasing,
particularly since the publication of “learning to see” by Rother and Shook (1999). One of the
unique characteristics of VSM in comparison with other process analysis techniques is that one map
depicts both material and information flow that controls the material flow. The focus of VSM is on
a product “value stream” (all actions required to transform raw materials into a finished product) for
a given “product family” -- products that follow the same overall production steps.
Doolen et al (2002) have extended the applications of lean production techniques in the electronics
manufacturing perspectives. Hyer (2002) has implemented Lean manufacturing in the office service
and administrative processes.
Badrinarayana and Sharma (2007) discusses that the interdependent components form the value
stream and Value Stream is the set of all specific actions required to bring out a specific product.
3. 182 Ramesh, Prasad and Srinivas
In order to attain noteworthy improvements the Zayko, et.al (1997) have decided to use value
stream mapping to visualize the entire flow and select lean tools that yielded maximum benefits.
Hines and Rich (1997) has opined that, the value stream is “the specific activities within a supply
chain required to design order and provide a specific product or value”.
Simchi-Levi et al (2004) are of the opinion that the customers are always concerned with their order
status, and sometimes they value the order status more than a reduced lead time. But, McDonald
et.al (2002) point out that the VSM creates a common language for production process, thus
facilitating more thoughtful decisions to improve the value stream. This will effectively reduce the
wastes and improves the productivity. While researchers and practitioners have developed a number
of tools to investigate individual firms and supply chains, most of these tools fall short in linking
and visualizing the nature of the material and information flow in an individual company.
McDonald et.al (2002) have used simulation techniques for the high-performance motion control
products manufacturing system to demonstrate that, simulation can be a very crucial tool in
assessing different future state maps. They demonstrate that simulation can provide and examine
different scenarios to complement those obtained from future state mapping.
The value stream mapping was extended in the field of aircraft manufacturing also. Abbett and
Payne (1999) have discussed the application of value stream mapping in an aircraft manufacturing
unit. They have developed the current and future state maps with the objective of reducing lead-
time according to customer’s requirements.
New (1993), and Jones et.al (1997) and other researchers developed individual tools to understand
the value stream. VSM extends guidance for improvements in the process, identifies the need to
improve workflow and finally shows avenues to reduce waste.
Shingo (1989) has discussed the strategies for the effective implementation of Value Stream
Mapping in a wood industry. He also opines that loops can be formed to identify the similar
processes and these loops will be helpful in identifying the non value activities in a systematic
manner. He has suggested the ways to eliminate non value added activity and proposed measures to
increase the Value added ratio.
Yang-Hua and Valandeghem (2002) describe, Value stream mapping as a mapping tool that is used
to describe supply chain networks. It maps not only material flows but also information flows that
signal and control the material flows. The material flow path of the product is traced back from the
final operation in its routing to the storage location for raw material. This visual representation
facilitates the process of lean implementation by helping to identify the value-added steps in a value
stream, and eliminating the non-value added steps / waste (muda).
Often, key questions in examining these types of processes are: what is the value-added ratio of
these supporting processes to the organization? Should the current plans of manufacturing should
remain internal or has to be outsourced? All these discussions have prompted the authors to carry
out VSM as a useful tool to explore additional redesign opportunities, set targets and to propose for
the future performance levels.
This prompted the authors to study the processes of manufacture of machining centers and have
drawn CVSM for all the processes (I objective) and carried out brain storming sessions with the
managers and engineers concerned to arrive at FVSM and have suggested action plans to be taken
to effectively implement FVSM.
4. Implementation of a Lean Model for Carrying … 183
3. A MODEL PLAN FOR THIS STUDY
A model plan was arrived at after the detailed discussions with the management. As the industry
was manufacturing many products, it was proposed to carry out a case study in the CNC vertical
machining center division. A model for carrying out Value stream mapping in this industry was
devised. The model proposed for the implementation of VSM is shown in the Figure 1. The model
proposed is applicable for any Medium Scale Industries in India. The plan starts with problem
statement and discusses the issues relating to the commitment from the management. A detailed
plan is discussed herewith for the implementation in the phased manner. However, the paper
discusses the issues relating to CVSM and FVSM for the manufacture of machining center.
Figure 1. Implementation model for the Value Stream Mapping in a Medium Scale Industry
The model parameters to be considered during the implementation are,
Problem Statement- The main aim is to identify the problems prevailing and to fill the gap in order
to establish lean compliancy.
5. 184 Ramesh, Prasad and Srinivas
Management Commitment- This is an important step for lean implementation initiative. The
management has not only to be committed but also should be willing to implement change.
Current State Data collection- This is an important step in VSM analysis. The data is collected
while walking along the actual pathways of material and information flow. The data collection
begins at the shipping end and work towards the upstream. Data has to be collected using the
stopwatch and should personally collect the data of cycle time and change over time for the process
of manufacture. Hence, as per the requirements, the appropriate data has to be collected. The
analysis of the current data collection is based on the bottle necks observed in the process of
manufacture.
Lean Implementation teams – The team should have managers, engineers and workers, who are
multi skilled, should be ready to accept the changes which the proposals suggest. This plays an
important step in the lean tool implementation. A survey with interviews has to be carried out.
Lean Tool Box- A detailed knowledge on the implementation and the use of Lean Manufacturing
tools like Kanban, Value Stream Mapping, One piece flow, Pareto diagram, Cause & effect
Diagrams, Why-Why analysis, PQ analysis, Total Productive Maintenance, Total Quality
Management etc are required. However, in this case, an attempt has to be made in mapping the
Current and future Value Stream Mapping.
Select appropriate Lean Tool- Once the data is collected, depending on the problems and the gaps
prevailing in the manufacturing activity, an appropriate lean tool need to be applied. This is based
on the customer’s requirements in the downstream.
Establish desired state – the desired state is based on the objectives set by the management.
Formulate the tool as per the organization’s culture & requirements- This is the most critical
step for effective implementation in any medium scale industry from the Indian context. The
medium scale Industries in India as a policy stated by Government of India are intended for high
contribution to domestic production, significant export earnings, low investment requirements,
operational flexibility, location wise mobility, low intensive imports, capacities to develop
appropriate indigenous technology, import substitution, contribution towards defense production,
competitiveness in domestic and export markets. But, the limitations the medium scale Industries
face are low Capital base, concentration of functions in one / two persons, inadequate exposure to
international environment, inability to face impact of World Trade Organization (WTO) regime,
inadequate contribution towards R & D and lack of professionalism. Further, these companies face
problems of cultural factors in their implementation initiatives as many medium scale industries are
launched in regional belts with cultural barriers. Further, the training initiatives form one of the core
need areas in the implementation.
Validate with test runs – The model has to be validated by carrying out test runs before launching
the proposal on a full scale.
Finalize blue print for the implementation – use flow chart, Supplier- Input-Process-Output-
Customer (SIPOC) system of implementation, Value Stream Mapping, Kaizen etc. In this study, the
research scholar has planned to propose a future state value stream mapping.
6. Implementation of a Lean Model for Carrying … 185
Train all the employees/ employers concerned with the implementation plan. This is the most
crucial step, as the workers should cultivate the lean thinking. It is proposed to the management to
carry out training program for the effective implementation.
Launch & Monitor This is the final step in the work.
4. CASE STUDY – CURRENT STATE VALUE STREAM MAPPING
Rother and Shook (1999) has discussed that, mapping helps to see the sources of waste in the value
stream. The reward of VSM is the elimination of large amounts of wastes in the organization. The
extended value stream mapping includes suppliers and customers in their decision to suggesting
Future State Value Stream Map.
Further, many research scholars opine that it is possible to identify and eliminate waste and they
opine that the problems faced by every industry is case specific. In this connection, it was felt that
the machining center section in this industry was having some non value added processes, which
can be avoided. Hence, as per the model suggested, the study was carried out. Further, Value
Stream Mapping (VSM) is a visual tool that integrates material flow and information flow into a
critical path chart to understand the relationships and importance of all Value Added and Non-value
Added actions. This methodology enables the team to prioritize projects for a systematic Lean
approach.
It was observed that BMV 45 Vertical Milling Center was one of the popular machines
manufactured by the industry. It was felt that there was enough scope to carry out value stream
mapping in this section. It was decided to carry out VSM analysis for the manufacture of Machine
Base, V- Column, Cross-Slide, Table and Milling Head.
The study involved in identifying a team consisting of a representative from TQM dept, a lean
consultant, engineers and workers were involved in carrying out the study. The data required for
plotting the Current State Value Stream Mapping (CVSM) was collected.
Further, the following procedure was adopted to draw the Current State Map.
• Identification and drawing the product flow from the raw-material entry point of the
manufacturing division (MFD) to the finished goods exit point of the MFD.
• Calculating the number of Work-in-process (WIP) for each component at each work cell.
• Calculating the cycle time set up time and utilization percentage of each process
• Plotting the Current State Value Stream Map based on the data collected
4.1. Data Collection and Study of the Process
The data regarding the cycle time, setup time was calculated for the manufacture of BMV 45
Machining. Further, the details regarding the various processes involved in the manufacture was
noted down. It was observed that the flow of the process of manufacture was fettling Yard, Fettling,
Priming, Roughing, Finish Machining, Fitting, inspection, putty, drying, polishing and painting.
Hence, the cycle time, set up time and the details regarding the speed of the spindle ,feed rate, WIP
quantity required, WIP others, distance to be traveled, utilization in percentage, Number of shifts
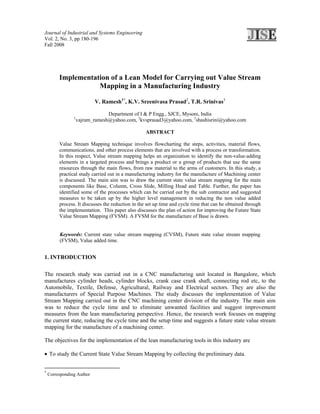
7. Ramesh, Prasad and Srinivas
Figure 2. CVSM for the Base of the Machining Center
186
8. 187
Implementation of a Lean Model for Carrying …
Figure 3. CVSM Diagram for the Column of the Machining Center
9. Ramesh, Prasad and Srinivas
Figure 4. VSM Diagram for the Cross Slide of the Machining Center
188
10. 189
Implementation of a Lean Model for Carrying …
Figure 5. VSM Diagram for the Milling Head of the Machining Center
11. Ramesh, Prasad and Srinivas
Figure 6. VSM Diagram for the Table of the Machining Center
190
12. Implementation of a Lean Model for Carrying … 191
were noted down. Finally, a current state value stream map was drawn for the manufacture of Base,
Column, Cross slide, Milling head and Table of the Machining center and is shown in the Figures 2,
3, 4, 5 and 6 respectively. It is to be noted that these data have been entered directly in the Value
Stream Map drawn.
4.2. Analysis of Current State Value Stream Mapping
The Value stream mapping of the components namely Base, Column, Cross Slide, Milling Head
and the Table required for the manufacturing and the assembly of BMV 45 Machining center
showed the following value added time, set up time and other details. The details of the activity are
shown in the Table 1.
Table 1. Analysis of Value Added Time for the manufacture of Machining Center
Cross Milling
Details of Activity Base Column Table
Slide Head
Value Added (Cycle time) Time in Mins 1065 1765 1495 1575 645
Set up Time in Mins 180 215 225 290 220
Total WIP Component in tons 39 27 53 59 58
Total WIP Others in tons 437 474 372 406 132
Customer Demand in days 3 3 3 3 6
Total Production Lead Time in days 13 9 17.67 19.67 9.67
Percentage Value added Time 5.69 13.62 5.88 5.56 4.63
It was observed that the percentage value added time ranged from 4.63 to 13.62 %. It was also
observed that the overall setup time was ranging from 180 mins to 290 minutes. In addition, there
was a need to look into the production lead time. The lead time was ranging from 9 days to 19.67
days. It was also observed that WIP of others was as high as 474 tons, which was leading to higher
working capital and the buffer stock issues. These were observed as the wastes attributing to the
decrease in the value added time.
These scenarios provided the authors an opportunity to propose a lean manufacturing tool to
improve the value added time. In this direction, it was decided to carry out discussions with the
mangers, engineers and workers and the issues relating to the increase in value added time were
pointed out. Further, the authors used the questionnaires and collected the data regarding the
awareness, knowledge and implementation difficulties faced by the employees and the management
in its effective implementation. Finally, based on the feedbacks collected, it was decided to suggest
the following lacuna in the process of manufacture and suggested remedial measures for the same.
Finally, a future state value stream map was proposed to be implemented.
4.3. Analysis for the Future State Value Stream Mapping
It was observed that processes like Fettling, Marking, Pre-machining can be eliminated / reduced by
improving the quality of castings at the supplier level. The industry took up this issue seriously and
13. 192 Ramesh, Prasad and Srinivas
requested the higher level management to implement as early as possible. It was felt that, follow up
measures are required in the incoming inspection section. This would reduce the set up time and
cycle time considerably and would increase the value added ratio. The plan of action for improving
the Future State Value Stream Mapping (FVSM) were,
• To develop a new layout, where the line flow of the components was possible. This makes the
inspection and quality control tasks much easier.
• To carry out online inspection and scrap reduction programs.
• To implement Kanban systems for the effective material and process control. It was suggested to
implement a pull type Kanban system to reap the benefits.
• To review the work sequence in order to reduce idle time and
• To Identify value added versus non value added elements and minimize / eliminate non value
added operations
4.4. Proposal for the Future State Value Stream Mapping
It was proposed to suggest the following steps to be taken to implement a Future State Value
Stream Map (FVSM). In this connection, the research scholar decided to provide suggestions based
on standard nine types of wastes of lean manufacturing as proposed by Womack [2] and others. It
was observed from the literature survey that the non value adding activity is the activity, which is
performed by the workers, will not add value to the product. These activities are considered as
wastes. Lean manufacturing tools will strive in eliminating these activities and in turn eliminate the
wastes in the manufacturing process.
FVSM for the manufacture of the parts of the machining center were drawn, however, a Sample
proposed FVSM for the manufacture of Base is shown in the Fig 7. Since, these steps have to be
taken up in the phased manner, the proposed FVSM has indicated the processes that can be avoided
to reap the benefits of value added time and reduce the non value added time (marked in red lines
and texts).
Hence, the following steps were suggested for the improvement of the process of manufacture.
Table 2 shows the detail of CVSM, cause, effect and the improvement measures to be undertaken
for improving the Future Value Stream.
Hence, in summary, the following suggestions were proposed for FVSM implementation
• Use of Special Dial stand for the alignment of component in Y and Z axis on alternate pallet,
which can reduce the set up during the machining of Loading Palette. The reduction in the dialling
time is estimated at 10 mins/ piece (40 components per month). Therefore, Total setting time saved
/ month =10 * 40 = 400 mins. Hence, Estimated Saving / month = 400 /60 = 6.67 Hours/month (i.e.,
30 days x 2 shifts = 60 shifts per month).
14. 193
Implementation of a Lean Model for Carrying …
Figure 7. Future State Value Stream Mapping for the manufacture of BMV 45 B
•
15. 194 Ramesh, Prasad and Srinivas
Table 2. Nine types of waste and the proposal for future state value stream mapping
Type of CVSM Cause Effect FVSM
Waste
Layout planning was not taken
Movement of the up in this case research work.
Unnecessary/ workers between Layout, Leads to However, use of Special Dial
Excessive the processes and location and fatigue (Muri. stand for the alignment of
Human motion other additional procedural and Mura) component in Y and Z axis on
movements. issues alternate pallet will reduce the
worker movements and also
reduces the set up time
The conveyance Layout, Integrity of It cannot be avoided. But, use
Conveyance of material using location and material and the pull system approach to
the Material material handling logistics care reduce this effect
equipments
Strategic, More storage
Over- Not seen capacity space. No change seen in CVSM and
production balancing Preservation FVSM approaches
requirements
Shop floor Work in Space Apply JIT principles to reduce
Inventory process inventory Lead time requirements lead time and to reduce the
with buffer stock space requirements
Modify the policy decision as
Over regards to the purchasing
processing or procedures. Attach
inappropriate Information flow Manual system Extra time on responsibility to the sub
processing NVA contractors for the supply of
right quality products to the
buyers’ premises.
Could be
Spillage/ caused due to It could lead to To control the rework, online
Rework/ Issues were less the unclean inspection using Reni Shaw
Salvage mishandling of environment probe is suggested.
machines by and wastages
the employees
Could be More material
caused due to movements, Apply the cellular / one piece
improper more time and lean line design concept if
Space Issues not taken up Layout and controls necessary in the later stages
machinery required
location
Between processes Layout, More space
Waiting and at interim location and required for Apply line balancing to reduce
locations. balancing. materials and the wait time
spoilages
Quality of the Leading to the
Talent Need for additional product and isolation in the Extend good lean related
utilization training other issues work culture training and explore multi
related to the and the work skilled avenues.
expertise level becomes
of the worker monotonous
16. Implementation of a Lean Model for Carrying … 195
• Use of Reni Shaw probe for work offset measurement can help in eliminating the need for
expensive fixtures and manual setting with dial indicators. This will reduce the machine downtime
and eliminate manual setting errors and can save 5 minutes /piece / setup. Therefore, Estimated
Saving / month = 5 * 40 Components = 200 mins/month. Further, turret mounted probes can be
used for the in-cycle gauging and part measurement with automatic offset correction. Proposed to
carry out online inspection.
• Cycle time can be reduced considerably with the effective use of tools in the magazine of
Machining Center. The policy decision regarding extending responsibilities to the sub contractors
for the supply of quality products will reduce the need to supply the material from fettling yard to
the Fettling station and carrying out Fettling, Marking, Pre-machining operations. This
implementation resulted in the reduction of cycle time to the extent of 1080 mins. As shown in the
Table 6.3. In summary, the stoppage of bringing the material from fettling yard has reduced the
cycle time of 250 mins, 150 mins, 200 mins, 40 mins and 60 mins in the manufacture of Base,
Colum, Cross Slide, Milling Head and Table respectively. Further, the marking operation has
resulted in 120 mins of savings in time. The stoppage of pre machining process has resulted in the
reduction of cycle time to the extent of 110 mins as shown in the Table 3.
Table 3. Reductions in cycle time after the implementation of FVSM
Reduction in Cycle Cross Milling
Base Column Table
Time in Mins. Slide Head
Fettling 250 150 200 40 60
Marking 120 150
Pre Machining 25 85
5. CONCLUSIONS
It was observed that, due to enormous potential in the lean manufacturing tools, value stream
mapping study was carried out in a medium scale industry for the manufacture of machining center.
It was observed from CVSM that the value added time was less. Hence, the study was carried out in
the manufacture of Base, Column, Cross Slide, Milling Head and Table and various parameters like
cycle time, set up time, WIP were recorded. By carrying out interviews with the managers,
engineers and workers, the authors have proposed measures to reduce cycle time and improve the
process of manufacture. A CVSM was drawn for all the processes as it was one of the main
objectives of this study and identified the reasons for increase in cycle & set up time. The authors
have suggested FVSM for improving the value added time by reducing the cycle time and the set up
time. Finally, the reductions in the cycle time after the implementation is estimated and proposed.
REFERENCES
[1] Abbett D., Payne V. (1999), Gulfstream value stream tour; presentation at 1999 Lean Summit.
[2] Badrinarayana S., Vishnupriya Sharma. (2007), Value stream mapping as the systems way of
optimizing the flow in an organization for producing of goods, Proc in a Challenge for Collaborative
Manufacture systems; APCOMS 2007; Bali, 5th -6th Sept.
[3] Doolen T., Nagarajan R.D, Hacker M.E. (2002), Lean manufacturing: An electronics manufacturing
perspective; Proc. of the 2002 IERC; Orlando, FL, May 19-22
17. 196 Ramesh, Prasad and Srinivas
[4] Hines P., Rich N. (1997), The seven value stream mapping tools; International Journal of Operations
& Production Management 17(1); 46-64.
[5] Hyer N.L., Wemmerlov U. (2002), The office that lean built; IIE Solutions 34; 37-43.
[6] Jones D. T. (2006), From lean production to lean consumption- Chairman; Lean Enterprise Academy,
UK, www.leanuk.org.
[7] Jones D.T., Hines P., Rich N. (1997), Lean logistics; International Journal of Physical distribution &
logistics Management 27(3/4); 153-173.
[8] McDonald T., Van Aken E.M., Rentes A.F. (2002), Utilizing simulation to enhance value stream
mapping: A Manufacturing case application; International Journal Of Logistics: Research and
Applications 5(2); 213-232.
[9] Moore R. (2006), Selecting the right manufacturing improvement tools, ISBN: 0750679166; Elsevier
Science & Technology Books.
[10] New C. (1993), The use of throughput efficiency as a key performance measure for the new
manufacturing era; The International Journal of Logistics Management 4(2); 95-104.
[11] Ohno. T. (1988), The Toyota production system: Beyond large-scale production; Productivity Press;
Edition I.
[12] Rother M., Shook J. (1999), Learning to see: Value stream mapping to add value and eliminate muda;
2 Edition, Brookline, MA; The Lean Enterprise Institute Inc.
[13] Shingo Shigeo (1989), A study of the Toyota production system from an industrial engineering
viewpoint; Productivity Press; Portland, OR.
[14] Simchi-Levi D., Kaminsky P., Simchi-Levi E. (2004), Designing and managing the supply chain,
concepts strategies and case studies; McGraw-Hill.
[15] Womack J.P., Jones D.T. (1998), Lean thinking: Banish waste and create wealth in your corporation;
New York, Free Simon & Schuster.
[16] Womack J.P., Jones D.T. (2005), Lean solutions: How companies and customers can create value and
wealth together; New York, Free Press.
[17] Womack J.P., Jones D.T., Roos D. (1990), The machine that changed the world: The story of lean
production; New York, Simon & Schuster.
[18] Yang-hua, L., Vanlandeghem H. (2002), An application of simulation and value stream mapping in
lean manufacturing; Proceedings 2002; October 23-26, Dresden, Germany; 300-307.
[19] Zayko M., Broughman D., Hancock W. (1997), Lean manufacturing yields world class improvements
for small manufacturer; IIE Solutions 29(4); 46-64.