
Recommended
More Related Content
Similar to Application of vsm (lean tool) in indian tyre indusrty ( published at proceeding of international conference icrbs 2015 ) by, rajnish, ravishankar & niranjan
Similar to Application of vsm (lean tool) in indian tyre indusrty ( published at proceeding of international conference icrbs 2015 ) by, rajnish, ravishankar & niranjan (20)
Recently uploaded
Recently uploaded (13)
Application of vsm (lean tool) in indian tyre indusrty ( published at proceeding of international conference icrbs 2015 ) by, rajnish, ravishankar & niranjan
- 1. Proceedings of ICRBS 2015 December 4-6, 2015 Department of Management Studies, IIT Roorkee Proceedings of International Conference on ‘Research and Business Sustainability’ Ƈ 733 Ƈ Application of Value Stream Mapping (Lean Tool) in Tyre Industries: A Case of Indian Tyre Manufacturing Unit Rajnish Kumar1 , Ravishankar2 , Niranjan Patro3 1 Divisional In charge (Engineering) Birla Tyres (Cavendish Industries Ltd.) Unit – 4 Address - E10/6 , Birla Tyres Colony Laksar, Haridwar, Uttrakhand – 247663 rksai22@gmail.com/epgp1423@iimkashipur.ac.in 2 Lead Production (Manufacturing Head), Birla Tyres (Cavendish Industries Ltd.)Unit – 4 ravi672011@gmail.com 3 Lead Technical, Birla Tyres (Cavendish Industries Ltd.) unit 4 niranjanpatro2012@gmail.com Abstract : Purpose:- This paper describes application of Value Stream Mapping(VSM) to analyze and redesign a process in Indian Tyre Industry. This Article addresses the importance of VSM in Lean Management environment in Indian Tyre Industry. Implementation of lean as core and its impact in improving the competitiveness. Design/Methodology /Approach: - The Case study approach has been used to show Importance and applicability of Value stream mapping in Indian Tyre Industry. VSM is selected as a tool for increase the overall productivity for that company could meet the present demand. The current state map developed after observation of information flow, material flow and cycles Time. Then identified various opportunities for improvement and the future state Map has been developed. After observation of current state map Team found that Production at Tyre building should be increased and Tyre curing cycle time should be reduced as per possibility. VSM is a language of symbol and is used as technique for analyzing material and information flow (Jones and Womack, 2000). VSM, an essential tool to manage process improvements provides a visual representation of the material and information flow for a product family.( Tom Luyster with Don Tapping, 2006). Findings:- The Case study analysis shows that Value stream Map is a valuable Lean tool for redesigning the productive system . Managerial Implications:- The results which obtained in study will help other Industries to implement VSM . Scope for Future Work /Limitation:- The main case limitation is confine focus only in a Motor cycle tyre plant . The Case should be extended in other factories for wider generalization. Keywords: Current State VSM, Future State VSM, Tyre, Lean Management 1. INTRODUCTION India is becoming one of the major Tyre manufacturing hubs in the world .ICRA expects the Indian Tyre industry to raise by a Compound annual growth rate (CAGR) of 11%-12% during 2014-17 with revenues of Rs. 623 billion by 2016- 17.Now a days there is a need for manufacturing firms to redefine and restructure (redesign) the manufacturing process to face the competitive demand by the challenges of current market (European commission 2004). Lean is structured common sense that aims to understand what our customers need and redesign the best way to ensure cost effective, timely and safe delivery (Mark EATON, 2013). The Study considered case study approach to show the significance of value stream mapping (VSM) tool in tyre manufacturing industry .This approach checks the applicability of any tool and generates the complex
- 2. Application of Value Stream Mapping (Lean Tool) in Tyre Industries: A Case of Indian Tyre Manufacturing Unit Proceedings of International Conference on ‘Research and Business Sustainability’ Ƈ 734 Ƈ relationship between various variables to propose new theories (Wacker, 1998). The purpose of this case study was to chart the different processes in a tyre manufacturing industry and after that categories them under the value stream mapping tool ,and there by creating an improvised future state of map, where in the value addition is enhanced . 2. LITERATURE REVIEW The Lean tool can be used in level production that reduces throughput time and costs dramatically and improves the Quality (James PWomack, 2006). A Lean event (VSM) consists of the focused effort of a team for a finite period of time on a problem which is defined, at the end of which something has changed. A Lean programme normally involves a whole organization, or certainly a large percentage of it, in a programme of improvement over a extended period of time. Lean programme consists of both the daily improvement activities as well as a mix of Lean events and projects as needed (Mark Eaton , 2013). All value produced by an organization is the end result of complex process, a series of actions that Lean thinkers call a Value Stream. Moreover, the customers are interested only in the value flowing to them, not in the weighted average of an organization’s effort forevery product orinthe value flowing to other customers(James P Womack ,2006). Rother and shook stated that wherever the product is developing for customer, there should be a value stream .The information for the VSM can be gathered by walking along the pathways of material and information (Rother and shook, 2003). Managers can judge the current condition and any possible opportunity to improve the value of product through using VSM as a tool. VSM is a language of symbols and is used as a technique for analyzing material and information flow(Jones and Womack , 2000). VSM is an excellent way to get everyone to see their value streams and agree to eliminate waste (Kevin J. Duggan, 2013). Value Stream Mapping is a powerful tool that combines material processing steps withimportant data as well as the information flow (TonyManos, 2006). The best and more easy way to create VSM is to form a cross functional team that includes supervisory and managerial level members throughout the organization (TonyManos, 2006).VSM is one of the most useful tools to understand and improve larger processes such as an end to end process that covers one or more organizations(Mark Eaton , 2013). VSM is a technique that is used to map out , understand and redesign information ,people and product flows. When done correctly it is very powerful and is a great way of getting groups of people to understand why processes are not as effective as they could be and to work together to improve them(Mark Eaton , 2013). The purpose of drawing the map is to detect each significant action required to create the desired value(James P Womack,2006). There are only few research case study published in the area of Indian tyre manufacturing industry. So present research tries to attempt how the VSM can be put into practice in the Tyre industry to improve the overall productivity. 2.1 VSM Symbols:- Rother and Shook (1998) have proposed various process material and information symbols to draw VSM. Symbols provide a shorthand approach of representing lots of steps.
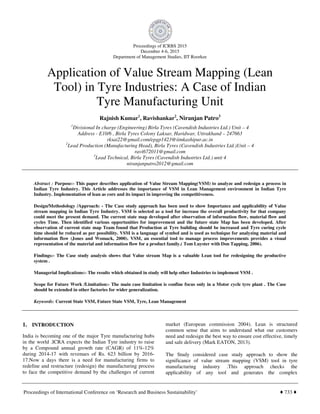
- 3. Application of Value Stream Mapping (Lean Tool) in Tyre Industries: A Case of Indian Tyre Manufacturing Unit Proceedings of International Conference on ‘Research and Business Sustainability’ Ƈ 735 Ƈ 3. OBJECTIVE / PROBLEM DEFINITION The main objective of this research is to check the application of VSM in Indian Tyre Industry .The main problem faced by the company is that the customer demand of 6.25 lac tyres/month is not attainable under the present situations. By this project , it is intended to cover the following major tasks: • Check the application of VSM in Indian Tyre Industry • Current and future state VSM • Viable improvements • Enhancement of value addition to the product. 4. RESEARCH METHODOLOGY The Case study approach has been used to show Importance and applicability of Value stream mapping in Indian Tyre Industry. VSM is selected as a tool for increase the overall productivity for that company could meet the present demand (upto 6.25 lacsTyre /month).The research methodology depends upon the case study approach(Eisenhardt, 1989; yin, 1994). In this paper, Rother and Shook’s VSM concept is used. Case study strategy not only provides answers to how and why questions, but it also helpful to build up new concepts and thoughts, and it can be useful to test the theory and refinement(Meredith, 1998; Snow and Thomas, 1994).This study aims to verify the application of VSM to improve the production system performance (Productivity). The production line has been manufacturing Tyres (BIRLA TYRES) for different automobile companies (Hero corp, Bajaj,etc) and Replacement market. The demand of motorcycle Tyres ( 6.25Lacstyres/month from 5.40Lacs tyres) from Customer was very high but organization was not able to delivers there customer requirements. Study concentrated on particular machine (Production Stage) to improve overall productivity. For making 5.40 lacs tyre/month in every shift we were making 18000 cure tyrein each shift and for 18000 cure tyre we were making 20,676 Green tyre (From Tyre Building) in each shift. So for increase the overall productivity we have to increase the productivity of Green Tyre and Cure Tyre. The study collected the data related to information flow, material flow and cycle time, based on which, the study prepared a current state of VSM .The Study performed analysis on current state of VSM and proposed various improvements/recommendation. All possible Improvement/recommendation proposed by the current state, contained by the future state of VSM. A VSMprovides a visual representation of the material and information flow for a product family and is an essential tool for managing process improvements ( Tom Luyster with Don Tapping, 2006). Fig 1 shows complete set of VSM steps in flow chart . Fig. 1. Flowchart showing five steps of VSM 5. CASE STUDY In order to perform the study a team was formed. Firstly team understand how current processes work (called current state analysis). After this, Team create an improved plan of how the process will work (called future state), and finally Team develop the implementation plan that will take from current state to the future state. For increase the productivity from 5.40 lacs tyre/month to 6.25 lacs/month , Team modified Tyre Building machine and Tyre Curing machine. After study of curing cycle process with blow point study method curing cycle time was reduced by 1 minute for some size of tyre. R K das , Ravishankar, Niranjan patra, Lalit kushwaha, Anil Ramdas Gatkhane, Brijesh Janbhandhu, Rajnish ,Vivek and Kamal are the dedicated members of Team. They all are from different departments (Engineering, Technical & Production). The data regarding material flow, informational flow was collected.
- 4. Application of Value Stream Mapping (Lean Tool) in Tyre Industries: A Case of Indian Tyre Manufacturing Unit Proceedings of International Conference on ‘Research and Business Sustainability’ Ƈ 736 Ƈ Fig. 2. Motorcycle unit Process flow chart of Birla Tyre (Cavendish Industries ltd.) 5.1 Data Box Detail:- The Data box is a VSM tool used in the chart to address the data input crossponding to each process. PROCESS Utilization (%) on Man Power/machine No, of shifts/shift Time avilable/shift No. of Machine Cycle time 5.2 A. Current State VSM:- The Current state map should exemplify that how the processes in an organization are performed in today’s work environment (Manos and Tony,2006). The current state map puts a stack in the ground ; it ought to shown accurate, real time data related to the targeted VSM. The data collection for a current state value stream map start with the shipping department(the closest point of customer) and works upstream through the various processes. (Tom Luyster and D. Tapping, 2006). Analysis of the current state map is concerned with ensuring everyone has a perfect understanding of what actually is going on. It is plotted considering material flow, information flow and cycles times. The studies have tried to improve the productivity and to find out the wastage in production process. One of the major observation of the study is movement of material in production line. Current Takt time = 43200/540000 = 0.08 minute (Here customer demand in a month is 540000 tyres and total available time in a month is (30*24*60) 43200 minute)
- 5. Application of Value Stream Mapping (Lean Tool) in Tyre Industries: A Case of Indian Tyre Manufacturing Unit Proceedings of International Conference on ‘Research and Business Sustainability’ Ƈ 737 Ƈ TyreBuilding :- Type of Machine Number of Machine Target Total Production /shift (Green Tyres) Total production per day (Green Tyres) STU 15 244 3660 10980 BTU 15 168 2520 7560 SLC 1 244 244 732 RB1 6 78 468 1404 Total 37 6892 20676 Fig. 3. Current state of Map
- 6. Application of Value Stream Mapping (Lean Tool) in Tyre Industries: A Case of Indian Tyre Manufacturing Unit Proceedings of International Conference on ‘Research and Business Sustainability’ Ƈ 738 Ƈ B. Recommendation:- 1. To Increase the productivity Modify the Tyre building machine from BTU to STU . 2. Modify the 15 Tyre Curing press(from 45 inch for LCVto 36 inch motorcycle curing press). 3. The curing cycle time to be reduced. 4. Green Tyre standardization. 5.3. Future State mapping Lean thinking is providing the guideline to develop a future state of map and methodology of map drawn(Rother and Shook,1998). Future state of map has been constructed with various modification/recommendation on current state of map. Based on this recommendation,Team modified the 7 BTU Tyre Building machine into 7 STU Tyre building machine, which increased the productivity of Tyre Building from 20676 green tyres to 22272 green tyres on per day (3 Shift) basis. Per day difference of production is 1596 Green Tyres and in a month now Team build(1596*30) 47880 more green tyres. 15 Tyre curing press (45 inch LCV Press) modified into 36 inch motorcycle tyre curing presses .so number of Motorcycle Tyre Curing press increased from 100 to116. Curing cycle time for curing process of tyre have reduced by 1 minute for different size of Tyre. Blow point study method is used for reducing the cycle time of curing process. Green Tyre Standardization has done for reducing manpower and the manufacturing time( machine set up time for different size). Earlier, for two size of green tyre, two machines were used but now we are using single tyre building machine on same set up. Hence, for two different type of Tyre, earlier we were used two type of Green tyres but now we are cured two different tyres by same Green tyres. For this we have modified tread and carcas of green tyre, as example two type of tyre 275-17-F22 and 275-17-F81 were made by two different size of green tyre but now after modification in tread and carcas both different size of tyres are made by same green tyre (275-17-F81 GT). After implementing all recommendation of current state of map now production of Tyre curing increased upto 625000 Tyres on per month basis. Final Takt Time = 43200/625000 = 0.0692 minute. (Here customer demand in a month is 625000 tyres and total available time in a month is (30*24*60) 43200 minute). Earlier Takt time is 0.08 minute while now Takt Time is 0.06 minute; Hence, Takt time is reduced by 0.02 minute. Type of Machine Number of Machine Target Total Production /shift(Green Tyres) Total Production /Day(Green Tyres) STU 22 244 5368 16104 BTU 08 168 1344 4032 SLC 1 244 244 732 RB1 6 78 468 1404 Total 37 7424 22272 Tyre Curing Cycle S. No. Tyre Size Loading/ Unloading time (min) Previous cycle time Existing cycle time Difference 1 2.75-17 ROADMAXX F21 1.5 11.3 10.3 1 2 3.00-17 ROADMAXX R42 1.5 13.3 12.3 1 3 100/90-17 ROADMAXX R81/R45 1.5 15.3 15.3 0 4 100/90-17 FIREMAXX R81 (TUBELESS) 1.5 15.3 15.3 0 5 2.75-18 ROADMAXX F21 1.5 11.3 10.3 1 6 2.75-18 ROADMAXX R41/42/46/R48 1.5 13.3 12.3 1 7 3.00-18 ROADMAXX R42 1.5 13.3 12.3 1 8 2.75-17 ROADMAXX F81/F82/F22 1.5 12.3 11.3 1 9 3.00-17 ROADMAXX R82/R84 1.5 13.3 12.3 1 10 2.75-18 ROADMAXX F81/F22 1.5 12.3 11.3 1 11 3.00-18 ROADMAXX R82 1.5 13.3 12.3 1
- 7. Application of Value Stream Mapping (Lean Tool) in Tyre Industries: A Case of Indian Tyre Manufacturing Unit Proceedings of International Conference on ‘Research and Business Sustainability’ Ƈ 739 Ƈ S. No. Tyre Size Loading/ Unloading time (min) Previous cycle time Existing cycle time Difference 12 100/90-18 ROADMAXX R81/R43 1.5 15.3 15.3 0 13 100/90-18 ROADMAXX R81/R43 TUBELESS 1.5 15.3 15.3 0 14 2.50-18 ROADMAXX F21 1.5 11.3 10.3 1 15 4.50-10 ROADMAXX BT339+/BT222+ 1.5 24.8 24.8 0 16 4.00-8 ROADMAXX BT339+/BT112+/BT222+ 1.5 17.8 17.8 0 17 3.00-18 ROADMAXX R43/R44/45 1.5 15.3 14.3 1 18 300-19 ROADMAXX F21 1.5 13.3 13.3 0 19 3.00-17 ROADMAXX R43/44 1.5 15.3 14.3 1 20 3.25-19 ROADMAXX R43 1.5 15.3 15.3 0 21 2.75-18 ROADMAXX R43/44/45 1.5 13.3 12.3 1 22 3.25-19 ROADMAXX F21 1.5 13.3 13.3 0 23 3.50-19 ROADMAXX R44 1.5 15.3 15.3 0 24 5.00-10 ROADMAXX BT112+/ ULTRA 1.5 26.8 26.8 0 25 3.50-10 ROADMAXX S61/S62 1.5 11.3 11.3 0 26 3.00-10 ROADMAXX S61 1.5 11.3 11.3 0 27 2.75-10 ROADMAXX S61 1.5 11.3 11.3 0 28 3.00-18 ROADMAXX R46 1.5 13.3 12.3 1 29 2.50-16 ROADMAXX F22 1.5 11.3 10.3 1 30 2.50-16 ROADMAXX R45/R48 1.5 12.3 11.3 1 31 3.00-19 ROADMAXX R42 1.5 13.3 13.3 0 32 3.00-17 ROADMAXX R48 1.5 15.3 13.3 2 33 3.00-18 ROADMAXX R48 1.5 15.3 13.3 2 34 2.50-16 ROADMAXX F21+(plus) 1.5 11.3 10.3 1 35 90/90-12 ROADMAXX S63 1.5 13.3 13.3 0 36 90/90-17 FIREMAXX F83 (T/L) 1.5 15.3 13.3 2 37 90/90-18 FIREMAXX F83 (T/L) 1.5 15.3 13.3 2 38 2.50-16 ROADMAXX F23 1.5 11.3 10.3 1 39 100/90-10 & 90/100-10 ROADMAXX S63 1.5 13.3 13.3 0 40 3.50-8 ROADMAXX S61 1.5 11.3 11.3 0 41 4.00-8 ROADMAXX RUSTOM 1.5 17.8 17.8 0 42 2.25-17 ROADMAXX F21 1.5 11.3 10.3 1 43 2.75-17 ROADMAXX R42 1.5 12.3 11.3 1 44 3.25-19 ROADMAXX R42 1.5 14.3 14.3 0 45 120/80-17 ROADMAXX R45/ R50 1.5 15.3 15.3 0 46 120/80-17 FIREMAXX R45/ R50/R51 TUBELESS 1.5 15.3 15.3 0 47 120/80-18 ROADMAXX R43 1.5 15.3 15.3 0
- 8. Application of Value Stream Mapping (Lean Tool) in Tyre Industries: A Case of Indian Tyre Manufacturing Unit Proceedings of International Conference on ‘Research and Business Sustainability’ Ƈ 740 Ƈ S. No. Tyre Size Loading/ Unloading time (min) Previous cycle time Existing cycle time Difference 48 120/80-18 FIREMAXX R43 TUBELESS 1.5 15.3 15.3 0 49 4.50-10 ROADMAXX RUSTOM 1.5 24.8 24.8 0 50 100/90-17 FIREMAXX R51 (TUBELESS) 1.5 15.3 15.3 0 Fig. 4. Future state of Map 6. RESULT& CONCLUSION The Result after improvement are as following – 1. Tyre building production of green tyre increased from 20676 to 22272 on per day basis . 2. Takt time reduced from 0.08 m to 0.06 m . 3. Number of Motorcycle Tyre curing press increased from 100 to 116 after conversion of LCV 45 inch press into motorcycle 36 inch press. 4. Green Tyre Standardized 5. Overall production capacity increased from 540000 tyres to 625000 tyres. 6. Approx. cost saving 2cr./month
- 9. Application of Value Stream Mapping (Lean Tool) in Tyre Industries: A Case of Indian Tyre Manufacturing Unit Proceedings of International Conference on ‘Research and Business Sustainability’ Ƈ 741 Ƈ 7. CONCLUSION Indian Tyre Industry is expanding rapidly with growth rate of 11-12% per year. Although, the major tyre manufacturing organizations are facing problem to satisfy the requirements of the customer and to stay in competition with the global players in terms of performance cost and quality .Lack of knowledge and information is one of the reasons why most of Indian Tyre manufacturing industries are yet unable to implement the advance manufacturing system (Like LM). Due to this reason, many Tyre Industries spend more resources to satisfy the requirements of customer. The Objective of the research is to check the application of VSM in Indian Tyre Industries. The research clearly shows the importance of VSM (LM tool) for identifying/reducing the waste and non-value added time in Indian Tyre Industries or Indian Manufacturing Industries. VSM gives one sight view of all the processes and helps in finding the inefficient and the most efficient process at plant. This study is contributed towards the implementation of Lean concept in Indian tyre Industry. REFERENCES [1] Mark Eaton, 2013. The Lean Practitioner’s handbook. [2] James P Womack, Manufacturing Engineering May 2006; 136, 5; ABI/ INFORM complete pg. 145 [3] Jones, D. and Womack, J.2000, Seeing the whole : Mapping the extended value stream, Lean Enterprise Institute, Cambridge, MA. [4] J. J. Jacob and J.J. E, 2014. Reducing throughput time by value stream mapping in a tyre manufacturing industry. Vol.3 issue 11 [5] Kevin J. Duggan,2013. Creating Model Value Streams : Practical Lean Techniques for building to Demand. [6] N. V. krisna Jasti and Aditya Sharma, 2013. Lean Manufacturing Implementation using Value Stream Mapping as a Tool. [7] Rother and Shook, 1998. , Learning to See: Value stream mappingto create value and eliminatemuda. Lean Enterprise Institute. [8] Rother and shook, 2003, Learning to See: Value stream mapping to crate value and eliminatemuda. Lean Enterprise Institute Brook ,online, P. 102. [9] S. Vinodh, M. Somnaathan and K.R.Arvind, 2013. Journal of Engineering design and technology Vol.11 No.2: Development of value stream map for achieving leanness in a manufacturing organization. [10] Tom Luyster with Don Tapping, 2006. Creating Your Lean Future State: How to move from seeing to Doing. [11] TonyManos ,2006. Value Stream Mapping – An Introduction . [12] Wacker, 1998. A definition of theory: “Research guideline for different theory building research methods in operation management”, Journal of operations management vol.16 No.4,PP. 361-385.