1. 1
Metropolitan Police Department
LGBT Domestic Violence in the
District: January 2013 – June 2015
LOCATION
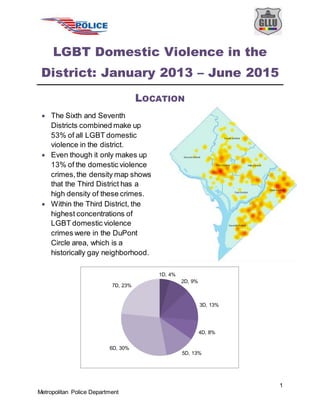
1D, 4%
2D, 9%
3D, 13%
4D, 8%
5D, 13%
6D, 30%
7D, 23%
The Sixth and Seventh
Districts combined make up
53% of all LGBT domestic
violence in the district.
Even though it only makes up
13% of the domestic violence
crimes,the density map shows
that the Third District has a
high density of these crimes.
Within the Third District, the
highest concentrations of
LGBT domestic violence
crimes were in the DuPont
Circle area, which is a
historically gay neighborhood.
2. 2
Metropolitan Police Department
CRIME and
INCIDENT TYPE
About 3 out of 4
LGBT domestic
violence crimes
were assaults or
threats.
More than 90% of
these crimes were
crimes against
persons,which is
not surprising as it
is difficultfor a propertycrime to be considereddomestic.
Even though family disturbance is not necessarilyconsidered a
crime, it was included in this report because these family
disturbances were flagged as domestic by officersand ended up
taking 14% of the crime/incidenttype.
TIME & DAY
Time & Day of LGBT Domestic Violence (January 2013– June 2015)
Most LGBT domestic violenceoccurs at night, between the hours of
9pm and 3am.
When looking at the percentages foreach day, domestic violence is
pretty evenly spread out across the days with Saturday having the
highest percentage (18%). The highest concentration was on
Saturdays between 3am and 6am.
Mon Tue Wed Thu Fri Sat Sun %
Midnight - 3am 17 15 11 17 15 17 17 24%
3am - 6am 7 4 5 4 7 19 7 12%
6am - 9am 5 4 4 1 5 3 4 6%
9am - noon 4 3 9 11 4 4 6 9%
Noon - 3pm 5 5 4 5 3 4 4 7%
3pm - 6pm 10 10 4 6 4 6 5 10%
6pm - 9pm 8 8 10 11 5 9 7 13%
9pm - midnight 13 15 8 12 7 17 15 19%
% 15% 14% 12% 15% 11% 18% 15% 100%
AGGRAVATED
ASSAULT/ADW
17%
DESTRUCTION
OF PROPERTY
3%
FAMILY
DISTURBANCE
14%
OTHER
5%
ROBBERY
1%SEXUAL
ASSAULT
2%
SIMPLE
ASSAULT
52%
THEFT
1%
THREATS
5%
3. 3
Metropolitan Police Department
Data Source:National Archive of Criminal Justice Data. National Incident-Based Reporting System, 2009 and 2010: Extract Files
[Computer file]. Ann Arbor, MI: Inter-university Consortium for Political and Social Research [distributor].
Note: Violent crimes include murder, violent sexual assault, robbery, aggravated assault, and simple assault. Data are
from law enforcement agencies in 35 states and the District of Columbia.
When comparing to national violent crime patterns, LGBT domestic
violence matches closely. Most adult violent crime gradually
increases as the day goes on and peaks at 10pm.
It is high throughout the night and gradually decreases until 6am
where it is the lowest, just like the LGBT domestic violence.
ARREST RATES and CLOSURE RATES
The chart below compares arrest rates of LGBT domestic violence
cases to closure rates of all crimes 2012-2014.Arrestrates and
closure rates are not directly comparable,but the closure rates of all
crimes can be used as a benchmark to look at the LGBT cases.
The arrest rates for all types of LGBT domestic violence crimes are
considerablyhigher than the closure rates of those crimes.
Aggravated assault and simple assault, which made up the highest
percentages of LGBT domestic violencecrimes committed, also have
the highest arrest rates at 81% (aggravated) and 73% (simple).
Note: Due to the small number of cases, one arrest can make a huge difference in this chart. Destruction of property for the DV
arrests w as only 3 cases so the percentage should be interpreted carefully.
81%
33% 33%
73%
60%
54%
12%
22%
56%
43%
0%
10%
20%
30%
40%
50%
60%
70%
80%
90%
Aggravated
Assault
Destruction of
Property
Robbery Simple
Assault
Threats
LGBT DV Arrest Rates ('13-June '15)
All Crimes Closure Rates('12-'14)
4. 4
Metropolitan Police Department
NOTES
Data
This report includes all crimes flagged as domesticby an officerin their
own report. It also includes all calls for service to the Gay and Lesbian
Liaison Unit that were considereddomestic.The data comes from 30
months of reporting from January 2013 through June 2015.
Domestic Violence
Domestic violence is defined by Metropolitan Police Department as, “a
pattern of behavior used by someone to establishpower and control over
another personthrough fear and intimidation”. This can be actual violence
or just the threat of violence. It can be emotional, sexual, physical, or
economicalabuse. It can occur at higher rates in the LGBT community
because people in this community deal with specific types of abuse, such
as threatening to “out” a partner.
For this report, some of the crimes included are not necessarilyviolent.
Family disturbances are not considereda crime, only an incident. This
report includes any intrafamily dispute betweenan offenderand victim. The
relationship betweenthe two is also not always intimate; it could be
roommates or friends, as long as there is a relationship present. This report
attempts to look at everything considered orflagged as domestic within the
LGBT community that was reported to MPD.
Closure and Arrest Rates
The “All Crimes Closure Rates” documented inthis report were calculated
by dividing the total number of cases closed in a calendar year, regardless
of when the crime occurred,by the total number of cases in that calendar
year. These are in line with FBI standards.
The “LGBT DV Arrest Rates” documented in this report were calculated by
dividing the number of cases closed with an arrest by the total count of
LGBT domestic violence cases for each crime type.