1. Jamri AB QMT181(PJJ)
1
Chapter 7 : Time Series Analysis
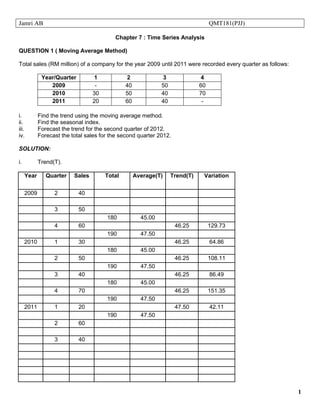
QUESTION 1 ( Moving Average Method)
Total sales (RM million) of a company for the year 2009 until 2011 were recorded every quarter as follows:
Year/Quarter
1
2
3
4
2009
-
40
50
60
2010
30
50
40
70
2011
20
60
40
-
i. Find the trend using the moving average method.
ii. Find the seasonal index.
iii. Forecast the trend for the second quarter of 2012.
iv. Forecast the total sales for the second quarter 2012.
SOLUTION:
i. Trend(T).
Year
Quarter
Sales
Total
Average(T)
Trend(T)
Variation
2009
2
40
3
50
180
45.00
4
60
46.25
129.73
190
47.50
2010
1
30
46.25
64.86
180
45.00
2
50
46.25
108.11
190
47.50
3
40
46.25
86.49
180
45.00
4
70
46.25
151.35
190
47.50
2011
1
20
47.50
42.11
190
47.50
2
60
3
40
2. Jamri AB QMT181(PJJ)
2
ii. The seasonal index.
Year/Quarter
1
2
3
4
2009
129.73
2010
64.86
108.11
86.49
151.35
2011
42.11
Total
106.97
108.11
86.49
281.08
Average
53.485
108.11
86.49
140.54
Adjustment
400 388.625 = 1.0293
Seasonal index
55.05
111.28
89.02
144.66
iii. Forecast the trend for the second quarter of 2012.
Trend variation = last trend - first trend
n - 1
T(2) = last trend + trend variation ( step )
iv.
3. Jamri AB QMT181(PJJ)
3
QUESTION 2 ( Moving Average Method)
The following table represents the number of road accidents reported at a police station every four months from year 2008 to year 2011
Year/Term
Jan - Apr
May – Aug
Sept – Dec
2008
35
28
54
2009
42
37
60
2010
49
43
66
2011
51
48
75
i. Find the trend using the moving average method.
ii. Find the seasonal index.
iii. Forecast the trend for the second quarter of 2012.
iv. Forecast the total sales for the second quarter 2012.
SOLUTION:
i. Trend(T).
Year
Term
The number
Total
Average = Trend , T
Variation
2008
1
35
2
28
3
54
2009
1
42
2
37
3
60
2010
1
49
2
43
3
66
2011
1
51
2
48
3
75
4. Jamri AB QMT181(PJJ)
4
ii. The seasonal index.
Year/Term
1
2
3
2008
2009
2010
2011
Total
Average
CF
Seasonal index
iii. Forecast the trend for the second term of 2012.
Trend variation = last trend - first trend =
n - 1
T(2) = last trend + Trend variation ( step )
iv.
5. Jamri AB QMT181(PJJ)
5
QUESTION 2 ( Least Square Method)
Total sales (RM million) of a company for the year 2009 until 2011 were recorded every quarter as follows:
Year/Quarter
1
2
3
4
2009
-
40
50
60
2010
30
50
40
70
2011
20
60
40
-
i. Find the trend using the least square method.
ii. Find the seasonal index.
iii. Forecast the trend for the second quarter of 2012.
iv. Forecast the total sales for the second quarter 2012.
SOLUTION:
Year
Quarter
Sales, y
t (time code)
ty
t 2
2009
2
40
1
40
1
3
50
2
100
4
4
60
3
180
9
2010
1
30
4
120
16
2
50
5
250
25
3
40
6
240
36
4
70
7
490
49
2011
1
20
8
160
64
2
60
9
540
81
3
40
10
400
100
JUMLAH
2520
385
i. Trend(T).
T = a + b t
6. Jamri AB QMT181(PJJ)
6
Year
Quarter
Sales
t (time code)
Trend(T),
T = 46.67 - 0.1212 t
Variation
2009
2
40
1
46.55
85.93
3
50
2
46.43
107.69
4
60
3
46.31
129.57
2010
1
30
4
46.19
64.96
2
50
5
46.06
108.54
3
40
6
45.94
87.06
4
70
7
45.82
152.77
2011
1
20
8
45.70
43.76
2
60
9
45.58
131.64
3
40
10
45.46
87.99
ii. The seasonal index.
Year/Quarter
1
2
3
4
2009
85.93
107.69
129.57
2010
64.96
108.54
87.06
152.77
2011
43.76
131.64
87.99
Total
108.72
326.11
282.74
282.34
Average
54.36
108.70
94.25
141.17
Adjustment
400 ¸ 398.48 = 1.0038
Seasonal index
54.57
109.12
94.60
141.71
iii. Forecast the trend for the second quarter of 2012.