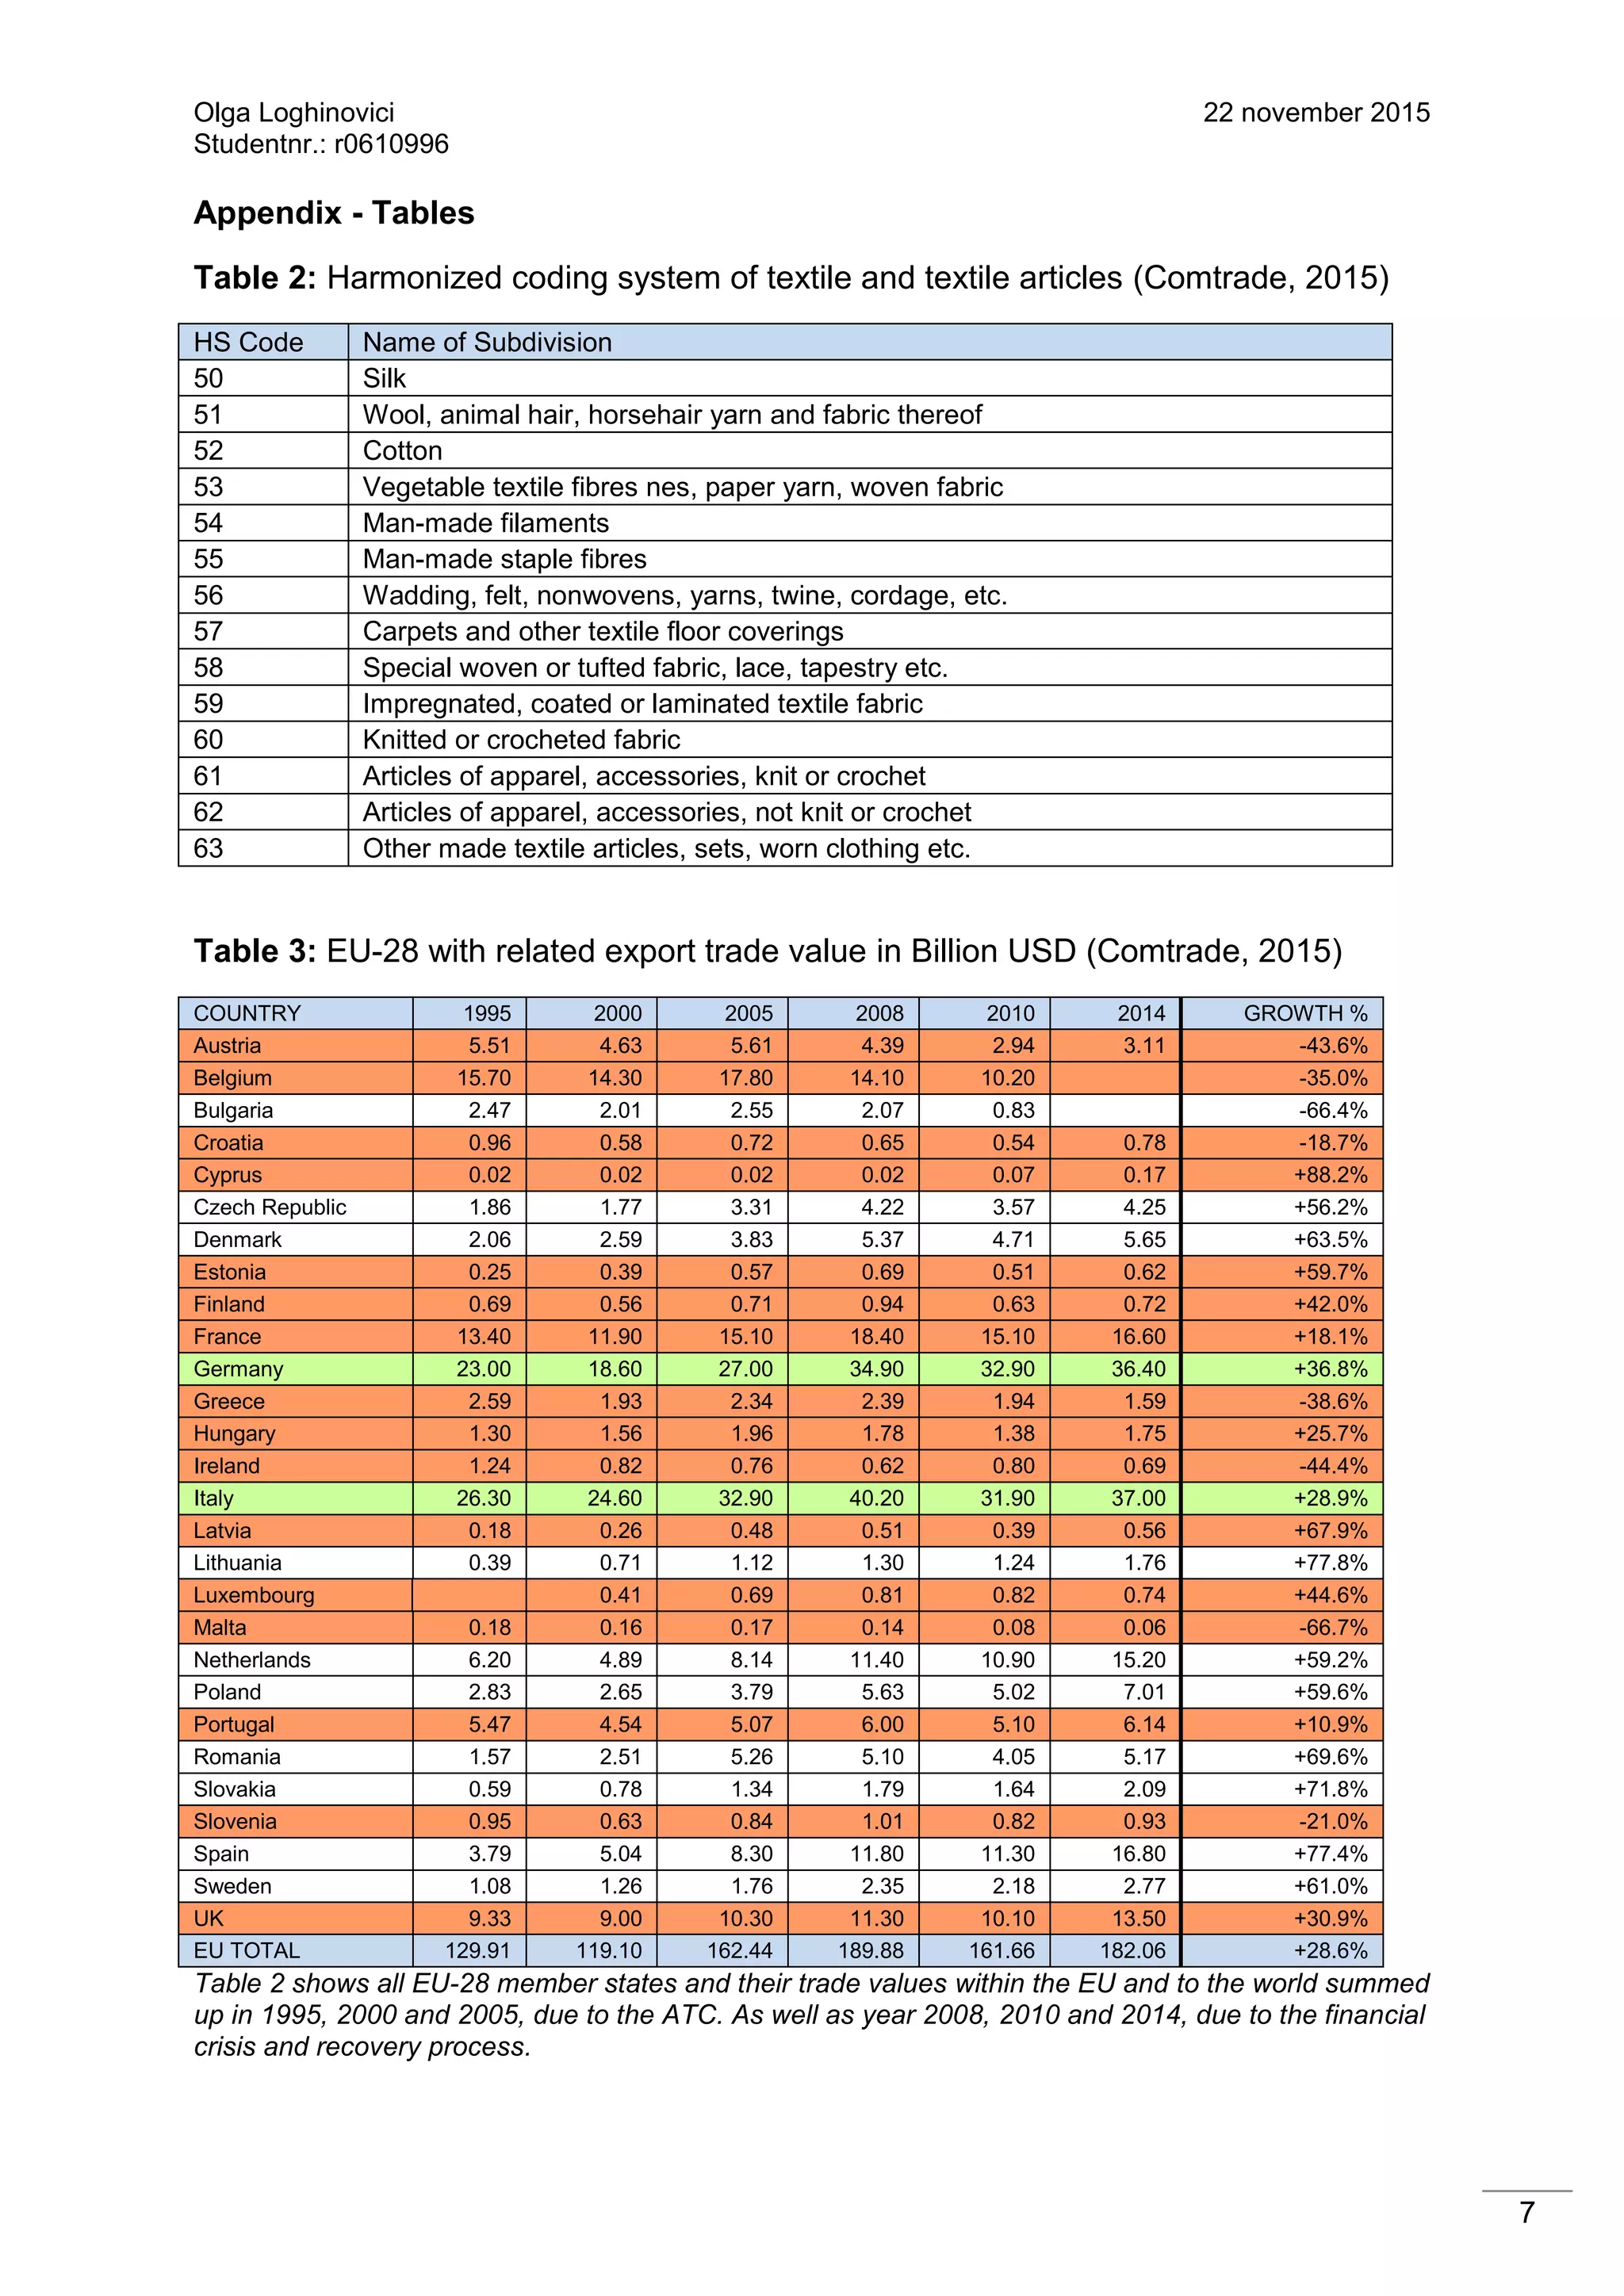
SlideShare a Scribd company logo
Olga Loghinovici 22 november 2015
Studentnr.: r0610996
1
Development of textile production with an overview of the export
shifting
The textile industry (T/C) is one of the most globalised industries which plays an
important role in the world trade. For some economies, for instance Pakistan (CIA,
2015) and Indonesia (CIA, 2015), it represents the most crucial sector for export
earnings.
In the last two decades, the global trade has sustained fundamental changes which
have caused significant movements in textile exports. One of them was the approval
for the Agreement of Textile and Clothing (ATC) from WTO members on January 1
1995. This led to a 10 year transitional program, which liberalised the global textile
trade, due to elimination of all textile and apparel product quotas. 2005 was the year
of a new start. From then on, textile and clothing were governed by the general rules
and disciplines embodied in the multilateral trading system. (WTO, 2015)
Another significant change in the global trade was the economic crisis from 2008 until
2009. This caused a worldwide recession with not just high budget deficits and
unstainable debts, but also considerable decreases in textile exports. (Young, 2014)
The following sections of this paper will describe the development and significant
movements of the textile sectors in Europe and the World, where export tables and
related graphics will illustrate the changes in more detail. At the end, a conclusion will
summarize the economy analysis will finish up the context.
Overview of European textile exports from 1995-2014
The textile industry is a varied and diverse industry which comprises a substantial
number of processes from the transformation of raw material into the production of
end results like industrial or hi-tech synthetic textile products. Hence, the textile
sector consists of various subdivisions. For the purposes of the following analysis,
the Harmonized Coding System (HS) is used which is a standardized system of
names and numeral indications to classified traded products.
Textile and textile articles are listed under the HS numbers 50 through 63. These
include inter alia raw materials, articles of apparel, and also textile coverings.(Table
2)
For the overview of the European exports all 28 members of the European Union
(EU-28) and their export trade values between 1995 and 2014 were considered first.
Next, a change in percentage from 1995 to 2014 was calculated, and all EU member
states with less than 50% change rate and less than $1 Billion USD trade value were
eliminated for a closer inspection of significant developments.
Italy and Germany were excluded of the elimination, because both countries are the
two main exporters of the European textile sector over this period of time. Looking at
the 2014 exports of textile products among the individual EU members, these two
countries alone are responsible for almost half (40.3%) of the EU total (Table 1).
Compared to 1995, it shows a moderate increase in percentage.
Olga Loghinovici 22 november 2015
Studentnr.: r0610996
2
In the following table are all countries listed which remain after the elimination.
Table 1: Significant EU members with related export trade value in Billion USD
COUNTRY 1995 2000 2005 2008 2010 2014 GROWTH %
Bulgaria 2.47 2.01 2.55 2.07 0.83 -66.4%
Czech Republic 1.86 1.77 3.31 4.22 3.57 4.25 +56.2%
Denmark 2.06 2.59 3.83 5.37 4.71 5.65 +63.5%
Germany 23.00 18.60 27.00 34.90 32.90 36.40 +36.8%
Italy 26.30 24.60 32.90 40.20 31.90 37.00 +28.9%
Lithuania 0.39 0.71 1.12 1.30 1.24 1.76 +77.8%
Netherlands 6.20 4.89 8.14 11.40 10.90 15.20 +59.2%
Poland 2.83 2.65 3.79 5.63 5.02 7.01 +59.6%
Romania 1.57 2.51 5.26 5.10 4.05 5.17 +69.6%
Slovakia 0.59 0.78 1.34 1.79 1.64 2.09 +71.8%
Spain 3.79 5.04 8.30 11.80 11.30 16.80 +77.4%
Sweden 1.08 1.26 1.76 2.35 2.18 2.77 +61.0%
EU TOTAL 129.91 119.10 162.44 189.88 161.66 182.06 +28.6%
(Comtrade, 2015)
To see which countries demonstrate a considerable development, the following line
chart is illustrated. (Figure 1)
Figure 1: European member state developments from 1995-2014
(Own illustration)
Between 1995 and 2005, the development of European exports has been especially
successful for Lithuania (with an increase of 77.8%) and Spain (with an increase of
77.4%), although Lithuania’s value is less important for Europe overall.1
Spain, in
contrast, has developed as the third largest textile exporter (9.2%) in Europe since
the year 2000. (Table 1)
1
Shares in textile trade over the years less than 1% in the EU total
0
5
10
15
20
25
30
35
40
45
1995 2000 2005 2008 2010 2014
Bulgaria
Czech Republic
Denmark
Germany
Italy
Lithuania
Netherlands
Poland
Romania
Slovakia
Spain
Sweden
Olga Loghinovici 22 november 2015
Studentnr.: r0610996
3
On one hand, investigating the line diagram of European members, it is possible to
assume that Spain took advantage of the quota-free trade from 2005. On the other,
Spain received a motivational boost rather than a significant loss after the financial
crisis between 2008 and 2009. After both events, the Spanish economy
demonstrated a greater increase. (Figure 1)
Slovakia and Romania have also reached additional outstanding developments
(Figure 1). Even if Slovakia shows a significant increase in textile exports, with a
share of about 1%, it does not play an important role of Europe’s total exports.
Furthermore, due to ongoing corruptions, high corporate taxes, high energy costs,
and other factors, Slovakia still has a non-attractive market for Europe. (CIA, 2015)
Looking to the export developments of Romania, it is clear to see that this country
had a strong increasing textile industry from the years 1995 to 2005 (Figure 1). The
year 2005 is a turning point of the Romanian success. From this year on, Romania’s
exports have gradually decreased, because of falling production, the liberalisation of
textile trade and the financial crisis. (Tudor, 2012)
As shown in Table 1, Bulgaria is the country where the textile exports have witnessed
a strong decline of over 60% in the period from 1995 to 2005. This decline is most
significant, which can be assumed as a cause, after the approval of the ATC in 2005.
However, the exports of Bulgaria, with a share of less than 1% on Europe’s total, are
insignificant for the European trade.
After analysing the development of European textile exports, this next section is
concentrating on the World textile exports between the years 1995 to 2014.
Overview of World textile exports from 1995-2014
For the World overview of textile exports, all countries with a trade value over $10
Billion USD from 1995 to 2014 are chosen. The following table lists all significant
countries and their trade values.
Table 4: Significant textile countries of the World with related export trade value in
Billion USD
Country 1995 2000 2005 2008 2010 2014 Growth %
China 39.30 44.90 107.60 179.70 199.50 287.50 86.3%
EU-28
2
29.00 41.10 53.40 45.20 57.80 49.8%
India 8.11 11.10 17.03 22.70 27.10 38.60 79.0%
Turkey 8.31 10.00 18.90 23.10 21.80 29.40 71.7%
USA 18.60 21.90 21.90 22.60 23.60 26.20 29.0%
Bangladesh 4.58 2.49 7.68 13.20 16.70 21.42 78.6%
Korea 17.80 18.20 13.70 13.10 13.70 15.70 -11.8%
Pakistan 10.30 10.60 11.60 13.80 25.4%
Indonesia 6.06 8.20 8.60 10.10 11.20 12.70 52.3%
Viet Nam 2.10 5.31 10.20 13.30 21.53 90.2%
Mexico 4.41 11.30 9.56 6.86 6.27 6.96 36.6%
(Comtrade, 2015)
2
Just Extra-EU trade considered
Olga Loghinovici 22 november 2015
Studentnr.: r0610996
4
In the table, it is clear to see that China is the biggest export and manufacturing
economy of the World. Over $200 Billion USD were circulated global in 2014. As
second and third country, Germany and India are registered.
The next figure presents developments of the significant textile countries in a line
diagram.
Figure 2: Textile countries with related development flows3
(Own illustration)
China is not just the largest textile economy, it has also shown one of the most
significant developments over the years. Chinese textile exports grew by 86% from
1995 to 2014 without any cutbacks. Significant to see (Figure 2) is the sharp rise
between 2000 and 2008 which is a result of China’s WTO entry in late 2001 and the
gradually removal of textile quotas (Lu, 2012). The economic crisis moderated
Chinese export increases, but this has not led to any losses. (Table 4)
Vietnam is the economy which has shown the greatest export development with an
immense increase of 90.2%. This change has mostly resulted from the WTO entry in
2007 and the affiliation to Trans-Pacific Partnership in 2010. Both approvals have
led to a free textile trade. (CIA, 2015)
India, with a constant growth rate of 79%, presents a further considerable growth.
Textiles and textile products are the largest export groups and a meaningful
generator of employment within this economy. With the abolition of textile quotas and
the liberalization of investments, India has created an international brand economy
with markets of the USA and EU as main importer (Kar, 2015). Furthermore is to say,
3
For a better overview, China was excluded of the line diagram
0
10
20
30
40
50
60
70
1995 2000 2005 2008 2010 2014
EU-28
India
Turkey
USA
Bangladesh
Korea
Pakistan
Indonesia
Vietnam
Mexico
Olga Loghinovici 22 november 2015
Studentnr.: r0610996
5
that India has not shown losses in the development process over the years. (Figure
2)
Additional significant export increases have shown Bangladesh. This country has
reached a growth rate of 78.6% since the year 2000. The data for Bangladesh is
available just until the year 2011. In the recent years, the textile sector has gone
through a series of factory accidents that have killed over 1,000 workers and strikes
that closed down most of the economic activities (CIA, 2015). These happenings
could have influenced the textile sector significantly and it is possible to assume that
the growth rate could take a turn for the worst in the future.
Turkey has shown similar developments as Bangladesh. Since 1995, Turkey
presents a constant growth with a moderate cutback during the economic crisis,
which has not resulted in a considerable deficit. (Figure 2)
There is just one economy, Korea, which has revealed a negative growth rate over
the years (Figure 2). Before the Korean textile industry has been challenged by the
reduction of trade quotas, this country has demonstrated a constant increase of
textile exports. Korea is one developing country which has not stayed resistant
against the new and strong competitiveness (like China and Europe). (Truett &
Truett, 2011)
Conclusion
It is significant to see that the world countries have all been influenced by the 10 year
transitional program from the WTO since 1995. The final implementation of the
Agreement for Textile and Clothing in 2005 has liberalised the global textile trade
with quota eliminations.
All in all, the approval of the ATC has generated both ‘winners’ and ‘losers’. Most of
the Asian countries show considerable growth rates. China and Vietnam are the two
economies which have the greatest increase from 1995 to 2014, followed by India,
Bangladesh and Turkey. Of these countries, Vietnam can be assumed as a new and
future important production area due to their fast and significant growth. Bangladesh
could also count as a prospective manufacturing area, but because of the recent
negative incidents, a declining growth rate is expected.
Korea has shown the most significant decrease in textile exporting which is why this
country is on top of the ‘losers’ category. In conclusion, it is to say, that the
production of this country is decreasing and hence shifting away.
Europe has presented a positive growth rate between 1995 and 2014. But this
continent had a deep cutback during the economic crisis. Without this occurrence,
Europe could have had a better textile export increase.
Within Europe, Germany and Italy are the main exporters of textiles. These have
shown a gradual increase parallel to the rise of the EU total textile exports since
1995. This means that both countries were, and still are, the most important
Olga Loghinovici 22 november 2015
Studentnr.: r0610996
6
production areas for Europe. Spain is also a significant EU member in development,
which explains a shift in the European textile production. This country has shown an
incredible rise over the years. In 2014, Spain was the third largest textile exporter
and a very important production place of the European Union. Another significant
change was shown in Romania. In conclusion of this development, it is possible to
say that Romania was an essential textile exporter and manufacturing base up until
2005. After this year, because of a decrease in exports, there followed a shifting
away of production.
To put everything in a nutshell, international textile productions are increasingly
shifting to the Asian economies, most importantly to China, Vietnam, Turkey, India,
and within Europe they are shifting to Spain. A considerable shifting away of
production has shown from Romania, Korea and possibly from Bangladesh.
Olga Loghinovici 22 november 2015
Studentnr.: r0610996
7
Appendix - Tables
Table 2: Harmonized coding system of textile and textile articles (Comtrade, 2015)
HS Code Name of Subdivision
50 Silk
51 Wool, animal hair, horsehair yarn and fabric thereof
52 Cotton
53 Vegetable textile fibres nes, paper yarn, woven fabric
54 Man-made filaments
55 Man-made staple fibres
56 Wadding, felt, nonwovens, yarns, twine, cordage, etc.
57 Carpets and other textile floor coverings
58 Special woven or tufted fabric, lace, tapestry etc.
59 Impregnated, coated or laminated textile fabric
60 Knitted or crocheted fabric
61 Articles of apparel, accessories, knit or crochet
62 Articles of apparel, accessories, not knit or crochet
63 Other made textile articles, sets, worn clothing etc.
Table 3: EU-28 with related export trade value in Billion USD (Comtrade, 2015)
COUNTRY 1995 2000 2005 2008 2010 2014 GROWTH %
Austria 5.51 4.63 5.61 4.39 2.94 3.11 -43.6%
Belgium 15.70 14.30 17.80 14.10 10.20 -35.0%
Bulgaria 2.47 2.01 2.55 2.07 0.83 -66.4%
Croatia 0.96 0.58 0.72 0.65 0.54 0.78 -18.7%
Cyprus 0.02 0.02 0.02 0.02 0.07 0.17 +88.2%
Czech Republic 1.86 1.77 3.31 4.22 3.57 4.25 +56.2%
Denmark 2.06 2.59 3.83 5.37 4.71 5.65 +63.5%
Estonia 0.25 0.39 0.57 0.69 0.51 0.62 +59.7%
Finland 0.69 0.56 0.71 0.94 0.63 0.72 +42.0%
France 13.40 11.90 15.10 18.40 15.10 16.60 +18.1%
Germany 23.00 18.60 27.00 34.90 32.90 36.40 +36.8%
Greece 2.59 1.93 2.34 2.39 1.94 1.59 -38.6%
Hungary 1.30 1.56 1.96 1.78 1.38 1.75 +25.7%
Ireland 1.24 0.82 0.76 0.62 0.80 0.69 -44.4%
Italy 26.30 24.60 32.90 40.20 31.90 37.00 +28.9%
Latvia 0.18 0.26 0.48 0.51 0.39 0.56 +67.9%
Lithuania 0.39 0.71 1.12 1.30 1.24 1.76 +77.8%
Luxembourg 0.41 0.69 0.81 0.82 0.74 +44.6%
Malta 0.18 0.16 0.17 0.14 0.08 0.06 -66.7%
Netherlands 6.20 4.89 8.14 11.40 10.90 15.20 +59.2%
Poland 2.83 2.65 3.79 5.63 5.02 7.01 +59.6%
Portugal 5.47 4.54 5.07 6.00 5.10 6.14 +10.9%
Romania 1.57 2.51 5.26 5.10 4.05 5.17 +69.6%
Slovakia 0.59 0.78 1.34 1.79 1.64 2.09 +71.8%
Slovenia 0.95 0.63 0.84 1.01 0.82 0.93 -21.0%
Spain 3.79 5.04 8.30 11.80 11.30 16.80 +77.4%
Sweden 1.08 1.26 1.76 2.35 2.18 2.77 +61.0%
UK 9.33 9.00 10.30 11.30 10.10 13.50 +30.9%
EU TOTAL 129.91 119.10 162.44 189.88 161.66 182.06 +28.6%
Table 2 shows all EU-28 member states and their trade values within the EU and to the world summed
up in 1995, 2000 and 2005, due to the ATC. As well as year 2008, 2010 and 2014, due to the financial
crisis and recovery process.

More Related Content

What's hot

JICA - IPSI joint study on VN auto ind
JICA - IPSI joint study on VN auto indJICA - IPSI joint study on VN auto ind
JICA - IPSI joint study on VN auto ind
Thuy Nguyen
 
International trade
International tradeInternational trade
International trade
suryamanyu sharma
 
Global Textile &Apparel : Trade Performance 2015
Global Textile &Apparel : Trade Performance 2015Global Textile &Apparel : Trade Performance 2015
Global Textile &Apparel : Trade Performance 2015
Sanjay Arora
 
Market Access Paper - Final 2
Market Access Paper - Final 2Market Access Paper - Final 2
Market Access Paper - Final 2Evelyn Teoh
 
Jacob Ng'ang'a: Industrialization in Kenya: What Went Wrong and Why?
Jacob Ng'ang'a: Industrialization in Kenya: What Went Wrong and Why?Jacob Ng'ang'a: Industrialization in Kenya: What Went Wrong and Why?
Jacob Ng'ang'a: Industrialization in Kenya: What Went Wrong and Why?
UNU-WIDER
 
Industries in Sri Lanka 10 years Review (2004-2013)
Industries in Sri Lanka 10 years Review (2004-2013) Industries in Sri Lanka 10 years Review (2004-2013)
Industries in Sri Lanka 10 years Review (2004-2013)
University of Moratuwa / Sri Lanka Law College
 
Foreign trade export import bank of india
Foreign trade export import bank of indiaForeign trade export import bank of india
Foreign trade export import bank of indiaPervez Khan
 
Future Watch: Asia trade deals
Future Watch: Asia trade dealsFuture Watch: Asia trade deals
Future Watch: Asia trade deals
Soile Ollila
 
China trade planning commision
China trade planning commisionChina trade planning commision
China trade planning commision
sandyparakh
 
Vietnam Market Outlook 2021
Vietnam Market Outlook 2021Vietnam Market Outlook 2021
Vietnam Market Outlook 2021
Vinacontrol Group
 
AMRO(ASEAN+3 MACROECONOMIC RESEARCH OFFICE) AND MYANMAR
AMRO(ASEAN+3 MACROECONOMIC RESEARCH OFFICE) AND MYANMARAMRO(ASEAN+3 MACROECONOMIC RESEARCH OFFICE) AND MYANMAR
AMRO(ASEAN+3 MACROECONOMIC RESEARCH OFFICE) AND MYANMAR
MYO AUNG Myanmar
 
Chinese Markets for Textile Chemicals
Chinese Markets for Textile ChemicalsChinese Markets for Textile Chemicals
Chinese Markets for Textile ChemicalsReportsnReports
 
10_Trade & Poverty Link_Garment
10_Trade & Poverty Link_Garment10_Trade & Poverty Link_Garment
10_Trade & Poverty Link_GarmentSamsen Neak
 
#Know What India Exports# By SN Panigrahi
#Know What India Exports# By SN Panigrahi#Know What India Exports# By SN Panigrahi
#Know What India Exports# By SN Panigrahi
SN Panigrahi, PMP
 
Top import & export of India
Top import & export of IndiaTop import & export of India
Top import & export of India
Suman Sutradhar
 
2020 TIO2 MARKET REVIEW & 2021 OUTLOOK
2020 TIO2 MARKET REVIEW & 2021 OUTLOOK2020 TIO2 MARKET REVIEW & 2021 OUTLOOK
2020 TIO2 MARKET REVIEW & 2021 OUTLOOK
Chao Huang
 
Bangladesh us$100-bn-export-potential
Bangladesh us$100-bn-export-potentialBangladesh us$100-bn-export-potential
Bangladesh us$100-bn-export-potential
wastra101
 
TiO2 China Monthly Report 201103 .pdf
TiO2 China Monthly Report 201103 .pdfTiO2 China Monthly Report 201103 .pdf
TiO2 China Monthly Report 201103 .pdf
CCM Intelligence
 
India's import export
India's import exportIndia's import export
India's import export
Hamid Husain
 
How are factory owners coping with the covid 19 effect on cancellation of RMG...
How are factory owners coping with the covid 19 effect on cancellation of RMG...How are factory owners coping with the covid 19 effect on cancellation of RMG...
How are factory owners coping with the covid 19 effect on cancellation of RMG...
Ashik Nobi
 

What's hot (20)

JICA - IPSI joint study on VN auto ind
JICA - IPSI joint study on VN auto indJICA - IPSI joint study on VN auto ind
JICA - IPSI joint study on VN auto ind
 
International trade
International tradeInternational trade
International trade
 
Global Textile &Apparel : Trade Performance 2015
Global Textile &Apparel : Trade Performance 2015Global Textile &Apparel : Trade Performance 2015
Global Textile &Apparel : Trade Performance 2015
 
Market Access Paper - Final 2
Market Access Paper - Final 2Market Access Paper - Final 2
Market Access Paper - Final 2
 
Jacob Ng'ang'a: Industrialization in Kenya: What Went Wrong and Why?
Jacob Ng'ang'a: Industrialization in Kenya: What Went Wrong and Why?Jacob Ng'ang'a: Industrialization in Kenya: What Went Wrong and Why?
Jacob Ng'ang'a: Industrialization in Kenya: What Went Wrong and Why?
 
Industries in Sri Lanka 10 years Review (2004-2013)
Industries in Sri Lanka 10 years Review (2004-2013) Industries in Sri Lanka 10 years Review (2004-2013)
Industries in Sri Lanka 10 years Review (2004-2013)
 
Foreign trade export import bank of india
Foreign trade export import bank of indiaForeign trade export import bank of india
Foreign trade export import bank of india
 
Future Watch: Asia trade deals
Future Watch: Asia trade dealsFuture Watch: Asia trade deals
Future Watch: Asia trade deals
 
China trade planning commision
China trade planning commisionChina trade planning commision
China trade planning commision
 
Vietnam Market Outlook 2021
Vietnam Market Outlook 2021Vietnam Market Outlook 2021
Vietnam Market Outlook 2021
 
AMRO(ASEAN+3 MACROECONOMIC RESEARCH OFFICE) AND MYANMAR
AMRO(ASEAN+3 MACROECONOMIC RESEARCH OFFICE) AND MYANMARAMRO(ASEAN+3 MACROECONOMIC RESEARCH OFFICE) AND MYANMAR
AMRO(ASEAN+3 MACROECONOMIC RESEARCH OFFICE) AND MYANMAR
 
Chinese Markets for Textile Chemicals
Chinese Markets for Textile ChemicalsChinese Markets for Textile Chemicals
Chinese Markets for Textile Chemicals
 
10_Trade & Poverty Link_Garment
10_Trade & Poverty Link_Garment10_Trade & Poverty Link_Garment
10_Trade & Poverty Link_Garment
 
#Know What India Exports# By SN Panigrahi
#Know What India Exports# By SN Panigrahi#Know What India Exports# By SN Panigrahi
#Know What India Exports# By SN Panigrahi
 
Top import & export of India
Top import & export of IndiaTop import & export of India
Top import & export of India
 
2020 TIO2 MARKET REVIEW & 2021 OUTLOOK
2020 TIO2 MARKET REVIEW & 2021 OUTLOOK2020 TIO2 MARKET REVIEW & 2021 OUTLOOK
2020 TIO2 MARKET REVIEW & 2021 OUTLOOK
 
Bangladesh us$100-bn-export-potential
Bangladesh us$100-bn-export-potentialBangladesh us$100-bn-export-potential
Bangladesh us$100-bn-export-potential
 
TiO2 China Monthly Report 201103 .pdf
TiO2 China Monthly Report 201103 .pdfTiO2 China Monthly Report 201103 .pdf
TiO2 China Monthly Report 201103 .pdf
 
India's import export
India's import exportIndia's import export
India's import export
 
How are factory owners coping with the covid 19 effect on cancellation of RMG...
How are factory owners coping with the covid 19 effect on cancellation of RMG...How are factory owners coping with the covid 19 effect on cancellation of RMG...
How are factory owners coping with the covid 19 effect on cancellation of RMG...
 

Viewers also liked

Have we created a 2 legged problem
Have we created a 2 legged problemHave we created a 2 legged problem
Have we created a 2 legged problemMINNIE WARD
 
Eng8 adjectival prepositional phrase
Eng8 adjectival prepositional phraseEng8 adjectival prepositional phrase
Eng8 adjectival prepositional phrase
Tine Lachica
 
Детский Каталог Фаберлик
Детский Каталог ФаберликДетский Каталог Фаберлик
Детский Каталог Фаберлик
Elena Pobedash
 
THE RON CLARK STORY
THE RON CLARK STORY THE RON CLARK STORY
THE RON CLARK STORY
Shieny Mae Alberio
 
131669407 photoshop-mejorar-calidad-fotos-imagenes-baja-resolucion-26775-comp...
131669407 photoshop-mejorar-calidad-fotos-imagenes-baja-resolucion-26775-comp...131669407 photoshop-mejorar-calidad-fotos-imagenes-baja-resolucion-26775-comp...
131669407 photoshop-mejorar-calidad-fotos-imagenes-baja-resolucion-26775-comp...
Darwin Valle
 
национальный костюм северных коми
национальный костюм северных коминациональный костюм северных коми
национальный костюм северных коми
katpere
 
Diagrama actividad 1. conociendo las garantías individuales
Diagrama actividad 1. conociendo las garantías individualesDiagrama actividad 1. conociendo las garantías individuales
Diagrama actividad 1. conociendo las garantías individuales
Jaime Víctor Hernández Ballinas
 

Viewers also liked (8)

Have we created a 2 legged problem
Have we created a 2 legged problemHave we created a 2 legged problem
Have we created a 2 legged problem
 
humberstone_review
humberstone_reviewhumberstone_review
humberstone_review
 
Eng8 adjectival prepositional phrase
Eng8 adjectival prepositional phraseEng8 adjectival prepositional phrase
Eng8 adjectival prepositional phrase
 
Детский Каталог Фаберлик
Детский Каталог ФаберликДетский Каталог Фаберлик
Детский Каталог Фаберлик
 
THE RON CLARK STORY
THE RON CLARK STORY THE RON CLARK STORY
THE RON CLARK STORY
 
131669407 photoshop-mejorar-calidad-fotos-imagenes-baja-resolucion-26775-comp...
131669407 photoshop-mejorar-calidad-fotos-imagenes-baja-resolucion-26775-comp...131669407 photoshop-mejorar-calidad-fotos-imagenes-baja-resolucion-26775-comp...
131669407 photoshop-mejorar-calidad-fotos-imagenes-baja-resolucion-26775-comp...
 
национальный костюм северных коми
национальный костюм северных коминациональный костюм северных коми
национальный костюм северных коми
 
Diagrama actividad 1. conociendo las garantías individuales
Diagrama actividad 1. conociendo las garantías individualesDiagrama actividad 1. conociendo las garantías individuales
Diagrama actividad 1. conociendo las garantías individuales
 

Similar to Development of textile production with an overview of the export shifting

Textile industry of pakistan at cross roads
Textile industry of pakistan at cross roadsTextile industry of pakistan at cross roads
Textile industry of pakistan at cross roads
Muhammad Mushtaq Mangat
 
Indian Textile Industry
Indian Textile IndustryIndian Textile Industry
Indian Textile Industry
Anuj Diwakar
 
Textile and clothing exports from south asia countries 1980 2012
Textile and clothing exports from south asia countries 1980 2012Textile and clothing exports from south asia countries 1980 2012
Textile and clothing exports from south asia countries 1980 2012
Muhammad Mushtaq Mangat
 
Textile and clothing exports from south asia countries 1980 2012
Textile and clothing exports from south asia countries 1980 2012Textile and clothing exports from south asia countries 1980 2012
Textile and clothing exports from south asia countries 1980 2012
Muhammad Mushtaq Mangat
 
Technical barriers to Vietnam leather footwear exported to the European union...
Technical barriers to Vietnam leather footwear exported to the European union...Technical barriers to Vietnam leather footwear exported to the European union...
Technical barriers to Vietnam leather footwear exported to the European union...
tailieufileword .com
 
Presentation Busse Geneva
Presentation Busse GenevaPresentation Busse Geneva
Presentation Busse GenevaFNian
 
The Lithuanian Economy - No 7, October 4, 2011
The Lithuanian Economy - No 7, October 4,  2011The Lithuanian Economy - No 7, October 4,  2011
The Lithuanian Economy - No 7, October 4, 2011
Swedbank
 
Assessing the evolution of the international trading system and enhancing its...
Assessing the evolution of the international trading system and enhancing its...Assessing the evolution of the international trading system and enhancing its...
Assessing the evolution of the international trading system and enhancing its...
Ira Tobing
 
Thesis (Zhang Yi)
Thesis (Zhang Yi)Thesis (Zhang Yi)
Thesis (Zhang Yi)Yi Zhang
 
Ethiopian exports growth characteristics, dynamics and survival berihu-asse...
Ethiopian exports   growth characteristics, dynamics and survival berihu-asse...Ethiopian exports   growth characteristics, dynamics and survival berihu-asse...
Ethiopian exports growth characteristics, dynamics and survival berihu-asse...
Berihu Assefa Gebrehiwot
 
IB.docx
IB.docxIB.docx
An Economic Inquiry into Ethiopian Exports: Pattern, characteristics, Dynamic...
An Economic Inquiry into Ethiopian Exports: Pattern, characteristics, Dynamic...An Economic Inquiry into Ethiopian Exports: Pattern, characteristics, Dynamic...
An Economic Inquiry into Ethiopian Exports: Pattern, characteristics, Dynamic...
essp2
 
Werner stengg report 2001
Werner stengg report 2001Werner stengg report 2001
Werner stengg report 2001
Utkan Uluçay, MSc., CDDP
 
Changing Latvia in the Changing Euro Area
Changing Latvia in the Changing Euro AreaChanging Latvia in the Changing Euro Area
Changing Latvia in the Changing Euro Area
Latvijas Banka
 
Greek economy 2014
Greek economy 2014Greek economy 2014
Greek economy 2014
Fotis Routsis
 
2014.05.20_OECD-ECLAC-PSE Forum_dosi
2014.05.20_OECD-ECLAC-PSE Forum_dosi2014.05.20_OECD-ECLAC-PSE Forum_dosi
2014.05.20_OECD-ECLAC-PSE Forum_dosi
OECD_Inclusivegrowth
 
The Impact of Economic Partnership Agreement on Customs Revenues and Challeng...
The Impact of Economic Partnership Agreement on Customs Revenues and Challeng...The Impact of Economic Partnership Agreement on Customs Revenues and Challeng...
The Impact of Economic Partnership Agreement on Customs Revenues and Challeng...
International Centre for Tax and Development - ICTD
 

Similar to Development of textile production with an overview of the export shifting (20)

Textile industry of pakistan at cross roads
Textile industry of pakistan at cross roadsTextile industry of pakistan at cross roads
Textile industry of pakistan at cross roads
 
Indian Textile Industry
Indian Textile IndustryIndian Textile Industry
Indian Textile Industry
 
Textile and clothing exports from south asia countries 1980 2012
Textile and clothing exports from south asia countries 1980 2012Textile and clothing exports from south asia countries 1980 2012
Textile and clothing exports from south asia countries 1980 2012
 
Textile and clothing exports from south asia countries 1980 2012
Textile and clothing exports from south asia countries 1980 2012Textile and clothing exports from south asia countries 1980 2012
Textile and clothing exports from south asia countries 1980 2012
 
Technical barriers to Vietnam leather footwear exported to the European union...
Technical barriers to Vietnam leather footwear exported to the European union...Technical barriers to Vietnam leather footwear exported to the European union...
Technical barriers to Vietnam leather footwear exported to the European union...
 
Presentation Busse Geneva
Presentation Busse GenevaPresentation Busse Geneva
Presentation Busse Geneva
 
The Lithuanian Economy - No 7, October 4, 2011
The Lithuanian Economy - No 7, October 4,  2011The Lithuanian Economy - No 7, October 4,  2011
The Lithuanian Economy - No 7, October 4, 2011
 
Assessing the evolution of the international trading system and enhancing its...
Assessing the evolution of the international trading system and enhancing its...Assessing the evolution of the international trading system and enhancing its...
Assessing the evolution of the international trading system and enhancing its...
 
Thesis (Zhang Yi)
Thesis (Zhang Yi)Thesis (Zhang Yi)
Thesis (Zhang Yi)
 
Ethiopian exports growth characteristics, dynamics and survival berihu-asse...
Ethiopian exports   growth characteristics, dynamics and survival berihu-asse...Ethiopian exports   growth characteristics, dynamics and survival berihu-asse...
Ethiopian exports growth characteristics, dynamics and survival berihu-asse...
 
IB.docx
IB.docxIB.docx
IB.docx
 
An Economic Inquiry into Ethiopian Exports: Pattern, characteristics, Dynamic...
An Economic Inquiry into Ethiopian Exports: Pattern, characteristics, Dynamic...An Economic Inquiry into Ethiopian Exports: Pattern, characteristics, Dynamic...
An Economic Inquiry into Ethiopian Exports: Pattern, characteristics, Dynamic...
 
Werner stengg report 2001
Werner stengg report 2001Werner stengg report 2001
Werner stengg report 2001
 
Changing Latvia in the Changing Euro Area
Changing Latvia in the Changing Euro AreaChanging Latvia in the Changing Euro Area
Changing Latvia in the Changing Euro Area
 
7688
76887688
7688
 
Greek economy 2014
Greek economy 2014Greek economy 2014
Greek economy 2014
 
P&p of gmt industry
P&p of gmt industryP&p of gmt industry
P&p of gmt industry
 
OTN - Private Sector Trade Note - Vol 2 2013
OTN - Private Sector Trade Note - Vol 2 2013OTN - Private Sector Trade Note - Vol 2 2013
OTN - Private Sector Trade Note - Vol 2 2013
 
2014.05.20_OECD-ECLAC-PSE Forum_dosi
2014.05.20_OECD-ECLAC-PSE Forum_dosi2014.05.20_OECD-ECLAC-PSE Forum_dosi
2014.05.20_OECD-ECLAC-PSE Forum_dosi
 
The Impact of Economic Partnership Agreement on Customs Revenues and Challeng...
The Impact of Economic Partnership Agreement on Customs Revenues and Challeng...The Impact of Economic Partnership Agreement on Customs Revenues and Challeng...
The Impact of Economic Partnership Agreement on Customs Revenues and Challeng...
 

Recently uploaded

Global Interconnection Group Joint Venture[960] (1).pdf
Global Interconnection Group Joint Venture[960] (1).pdfGlobal Interconnection Group Joint Venture[960] (1).pdf
Global Interconnection Group Joint Venture[960] (1).pdf
Henry Tapper
 
Project File Report BBA 6th semester.pdf
Project File Report BBA 6th semester.pdfProject File Report BBA 6th semester.pdf
Project File Report BBA 6th semester.pdf
RajPriye
 
What are the main advantages of using HR recruiter services.pdf
What are the main advantages of using HR recruiter services.pdfWhat are the main advantages of using HR recruiter services.pdf
What are the main advantages of using HR recruiter services.pdf
HumanResourceDimensi1
 
CADAVER AS OUR FIRST TEACHER anatomt in your.pptx
CADAVER AS OUR FIRST TEACHER anatomt in your.pptxCADAVER AS OUR FIRST TEACHER anatomt in your.pptx
CADAVER AS OUR FIRST TEACHER anatomt in your.pptx
fakeloginn69
 
Set off and carry forward of losses and assessment of individuals.pptx
Set off and carry forward of losses and assessment of individuals.pptxSet off and carry forward of losses and assessment of individuals.pptx
Set off and carry forward of losses and assessment of individuals.pptx
HARSHITHV26
 
Memorandum Of Association Constitution of Company.ppt
Memorandum Of Association Constitution of Company.pptMemorandum Of Association Constitution of Company.ppt
Memorandum Of Association Constitution of Company.ppt
seri bangash
 
Discover the innovative and creative projects that highlight my journey throu...
Discover the innovative and creative projects that highlight my journey throu...Discover the innovative and creative projects that highlight my journey throu...
Discover the innovative and creative projects that highlight my journey throu...
dylandmeas
 
Maksym Vyshnivetskyi: PMO Quality Management (UA)
Maksym Vyshnivetskyi: PMO Quality Management (UA)Maksym Vyshnivetskyi: PMO Quality Management (UA)
Maksym Vyshnivetskyi: PMO Quality Management (UA)
Lviv Startup Club
 
April 2024 Nostalgia Products Newsletter
April 2024 Nostalgia Products NewsletterApril 2024 Nostalgia Products Newsletter
April 2024 Nostalgia Products Newsletter
NathanBaughman3
 
Role of Remote Sensing and Monitoring in Mining
Role of Remote Sensing and Monitoring in MiningRole of Remote Sensing and Monitoring in Mining
Role of Remote Sensing and Monitoring in Mining
Naaraayani Minerals Pvt.Ltd
 
3.0 Project 2_ Developing My Brand Identity Kit.pptx
3.0 Project 2_ Developing My Brand Identity Kit.pptx3.0 Project 2_ Developing My Brand Identity Kit.pptx
3.0 Project 2_ Developing My Brand Identity Kit.pptx
tanyjahb
 
The-McKinsey-7S-Framework. strategic management
The-McKinsey-7S-Framework. strategic managementThe-McKinsey-7S-Framework. strategic management
The-McKinsey-7S-Framework. strategic management
Bojamma2
 
Improving profitability for small business
Improving profitability for small businessImproving profitability for small business
Improving profitability for small business
Ben Wann
 
Search Disrupted Google’s Leaked Documents Rock the SEO World.pdf
Search Disrupted Google’s Leaked Documents Rock the SEO World.pdfSearch Disrupted Google’s Leaked Documents Rock the SEO World.pdf
Search Disrupted Google’s Leaked Documents Rock the SEO World.pdf
Arihant Webtech Pvt. Ltd
 
20240425_ TJ Communications Credentials_compressed.pdf
20240425_ TJ Communications Credentials_compressed.pdf20240425_ TJ Communications Credentials_compressed.pdf
20240425_ TJ Communications Credentials_compressed.pdf
tjcomstrang
 
RMD24 | Debunking the non-endemic revenue myth Marvin Vacquier Droop | First ...
RMD24 | Debunking the non-endemic revenue myth Marvin Vacquier Droop | First ...RMD24 | Debunking the non-endemic revenue myth Marvin Vacquier Droop | First ...
RMD24 | Debunking the non-endemic revenue myth Marvin Vacquier Droop | First ...
BBPMedia1
 
Affordable Stationery Printing Services in Jaipur | Navpack n Print
Affordable Stationery Printing Services in Jaipur | Navpack n PrintAffordable Stationery Printing Services in Jaipur | Navpack n Print
Affordable Stationery Printing Services in Jaipur | Navpack n Print
Navpack & Print
 
Buy Verified PayPal Account | Buy Google 5 Star Reviews
Buy Verified PayPal Account | Buy Google 5 Star ReviewsBuy Verified PayPal Account | Buy Google 5 Star Reviews
Buy Verified PayPal Account | Buy Google 5 Star Reviews
usawebmarket
 
Filing Your Delaware Franchise Tax A Detailed Guide
Filing Your Delaware Franchise Tax A Detailed GuideFiling Your Delaware Franchise Tax A Detailed Guide
Filing Your Delaware Franchise Tax A Detailed Guide
YourLegal Accounting
 
anas about venice for grade 6f about venice
anas about venice for grade 6f about veniceanas about venice for grade 6f about venice
anas about venice for grade 6f about venice
anasabutalha2013
 

Recently uploaded (20)

Global Interconnection Group Joint Venture[960] (1).pdf
Global Interconnection Group Joint Venture[960] (1).pdfGlobal Interconnection Group Joint Venture[960] (1).pdf
Global Interconnection Group Joint Venture[960] (1).pdf
 
Project File Report BBA 6th semester.pdf
Project File Report BBA 6th semester.pdfProject File Report BBA 6th semester.pdf
Project File Report BBA 6th semester.pdf
 
What are the main advantages of using HR recruiter services.pdf
What are the main advantages of using HR recruiter services.pdfWhat are the main advantages of using HR recruiter services.pdf
What are the main advantages of using HR recruiter services.pdf
 
CADAVER AS OUR FIRST TEACHER anatomt in your.pptx
CADAVER AS OUR FIRST TEACHER anatomt in your.pptxCADAVER AS OUR FIRST TEACHER anatomt in your.pptx
CADAVER AS OUR FIRST TEACHER anatomt in your.pptx
 
Set off and carry forward of losses and assessment of individuals.pptx
Set off and carry forward of losses and assessment of individuals.pptxSet off and carry forward of losses and assessment of individuals.pptx
Set off and carry forward of losses and assessment of individuals.pptx
 
Memorandum Of Association Constitution of Company.ppt
Memorandum Of Association Constitution of Company.pptMemorandum Of Association Constitution of Company.ppt
Memorandum Of Association Constitution of Company.ppt
 
Discover the innovative and creative projects that highlight my journey throu...
Discover the innovative and creative projects that highlight my journey throu...Discover the innovative and creative projects that highlight my journey throu...
Discover the innovative and creative projects that highlight my journey throu...
 
Maksym Vyshnivetskyi: PMO Quality Management (UA)
Maksym Vyshnivetskyi: PMO Quality Management (UA)Maksym Vyshnivetskyi: PMO Quality Management (UA)
Maksym Vyshnivetskyi: PMO Quality Management (UA)
 
April 2024 Nostalgia Products Newsletter
April 2024 Nostalgia Products NewsletterApril 2024 Nostalgia Products Newsletter
April 2024 Nostalgia Products Newsletter
 
Role of Remote Sensing and Monitoring in Mining
Role of Remote Sensing and Monitoring in MiningRole of Remote Sensing and Monitoring in Mining
Role of Remote Sensing and Monitoring in Mining
 
3.0 Project 2_ Developing My Brand Identity Kit.pptx
3.0 Project 2_ Developing My Brand Identity Kit.pptx3.0 Project 2_ Developing My Brand Identity Kit.pptx
3.0 Project 2_ Developing My Brand Identity Kit.pptx
 
The-McKinsey-7S-Framework. strategic management
The-McKinsey-7S-Framework. strategic managementThe-McKinsey-7S-Framework. strategic management
The-McKinsey-7S-Framework. strategic management
 
Improving profitability for small business
Improving profitability for small businessImproving profitability for small business
Improving profitability for small business
 
Search Disrupted Google’s Leaked Documents Rock the SEO World.pdf
Search Disrupted Google’s Leaked Documents Rock the SEO World.pdfSearch Disrupted Google’s Leaked Documents Rock the SEO World.pdf
Search Disrupted Google’s Leaked Documents Rock the SEO World.pdf
 
20240425_ TJ Communications Credentials_compressed.pdf
20240425_ TJ Communications Credentials_compressed.pdf20240425_ TJ Communications Credentials_compressed.pdf
20240425_ TJ Communications Credentials_compressed.pdf
 
RMD24 | Debunking the non-endemic revenue myth Marvin Vacquier Droop | First ...
RMD24 | Debunking the non-endemic revenue myth Marvin Vacquier Droop | First ...RMD24 | Debunking the non-endemic revenue myth Marvin Vacquier Droop | First ...
RMD24 | Debunking the non-endemic revenue myth Marvin Vacquier Droop | First ...
 
Affordable Stationery Printing Services in Jaipur | Navpack n Print
Affordable Stationery Printing Services in Jaipur | Navpack n PrintAffordable Stationery Printing Services in Jaipur | Navpack n Print
Affordable Stationery Printing Services in Jaipur | Navpack n Print
 
Buy Verified PayPal Account | Buy Google 5 Star Reviews
Buy Verified PayPal Account | Buy Google 5 Star ReviewsBuy Verified PayPal Account | Buy Google 5 Star Reviews
Buy Verified PayPal Account | Buy Google 5 Star Reviews
 
Filing Your Delaware Franchise Tax A Detailed Guide
Filing Your Delaware Franchise Tax A Detailed GuideFiling Your Delaware Franchise Tax A Detailed Guide
Filing Your Delaware Franchise Tax A Detailed Guide
 
anas about venice for grade 6f about venice
anas about venice for grade 6f about veniceanas about venice for grade 6f about venice
anas about venice for grade 6f about venice
 

Development of textile production with an overview of the export shifting

  • 1. Olga Loghinovici 22 november 2015 Studentnr.: r0610996 1 Development of textile production with an overview of the export shifting The textile industry (T/C) is one of the most globalised industries which plays an important role in the world trade. For some economies, for instance Pakistan (CIA, 2015) and Indonesia (CIA, 2015), it represents the most crucial sector for export earnings. In the last two decades, the global trade has sustained fundamental changes which have caused significant movements in textile exports. One of them was the approval for the Agreement of Textile and Clothing (ATC) from WTO members on January 1 1995. This led to a 10 year transitional program, which liberalised the global textile trade, due to elimination of all textile and apparel product quotas. 2005 was the year of a new start. From then on, textile and clothing were governed by the general rules and disciplines embodied in the multilateral trading system. (WTO, 2015) Another significant change in the global trade was the economic crisis from 2008 until 2009. This caused a worldwide recession with not just high budget deficits and unstainable debts, but also considerable decreases in textile exports. (Young, 2014) The following sections of this paper will describe the development and significant movements of the textile sectors in Europe and the World, where export tables and related graphics will illustrate the changes in more detail. At the end, a conclusion will summarize the economy analysis will finish up the context. Overview of European textile exports from 1995-2014 The textile industry is a varied and diverse industry which comprises a substantial number of processes from the transformation of raw material into the production of end results like industrial or hi-tech synthetic textile products. Hence, the textile sector consists of various subdivisions. For the purposes of the following analysis, the Harmonized Coding System (HS) is used which is a standardized system of names and numeral indications to classified traded products. Textile and textile articles are listed under the HS numbers 50 through 63. These include inter alia raw materials, articles of apparel, and also textile coverings.(Table 2) For the overview of the European exports all 28 members of the European Union (EU-28) and their export trade values between 1995 and 2014 were considered first. Next, a change in percentage from 1995 to 2014 was calculated, and all EU member states with less than 50% change rate and less than $1 Billion USD trade value were eliminated for a closer inspection of significant developments. Italy and Germany were excluded of the elimination, because both countries are the two main exporters of the European textile sector over this period of time. Looking at the 2014 exports of textile products among the individual EU members, these two countries alone are responsible for almost half (40.3%) of the EU total (Table 1). Compared to 1995, it shows a moderate increase in percentage.
  • 2. Olga Loghinovici 22 november 2015 Studentnr.: r0610996 2 In the following table are all countries listed which remain after the elimination. Table 1: Significant EU members with related export trade value in Billion USD COUNTRY 1995 2000 2005 2008 2010 2014 GROWTH % Bulgaria 2.47 2.01 2.55 2.07 0.83 -66.4% Czech Republic 1.86 1.77 3.31 4.22 3.57 4.25 +56.2% Denmark 2.06 2.59 3.83 5.37 4.71 5.65 +63.5% Germany 23.00 18.60 27.00 34.90 32.90 36.40 +36.8% Italy 26.30 24.60 32.90 40.20 31.90 37.00 +28.9% Lithuania 0.39 0.71 1.12 1.30 1.24 1.76 +77.8% Netherlands 6.20 4.89 8.14 11.40 10.90 15.20 +59.2% Poland 2.83 2.65 3.79 5.63 5.02 7.01 +59.6% Romania 1.57 2.51 5.26 5.10 4.05 5.17 +69.6% Slovakia 0.59 0.78 1.34 1.79 1.64 2.09 +71.8% Spain 3.79 5.04 8.30 11.80 11.30 16.80 +77.4% Sweden 1.08 1.26 1.76 2.35 2.18 2.77 +61.0% EU TOTAL 129.91 119.10 162.44 189.88 161.66 182.06 +28.6% (Comtrade, 2015) To see which countries demonstrate a considerable development, the following line chart is illustrated. (Figure 1) Figure 1: European member state developments from 1995-2014 (Own illustration) Between 1995 and 2005, the development of European exports has been especially successful for Lithuania (with an increase of 77.8%) and Spain (with an increase of 77.4%), although Lithuania’s value is less important for Europe overall.1 Spain, in contrast, has developed as the third largest textile exporter (9.2%) in Europe since the year 2000. (Table 1) 1 Shares in textile trade over the years less than 1% in the EU total 0 5 10 15 20 25 30 35 40 45 1995 2000 2005 2008 2010 2014 Bulgaria Czech Republic Denmark Germany Italy Lithuania Netherlands Poland Romania Slovakia Spain Sweden
  • 3. Olga Loghinovici 22 november 2015 Studentnr.: r0610996 3 On one hand, investigating the line diagram of European members, it is possible to assume that Spain took advantage of the quota-free trade from 2005. On the other, Spain received a motivational boost rather than a significant loss after the financial crisis between 2008 and 2009. After both events, the Spanish economy demonstrated a greater increase. (Figure 1) Slovakia and Romania have also reached additional outstanding developments (Figure 1). Even if Slovakia shows a significant increase in textile exports, with a share of about 1%, it does not play an important role of Europe’s total exports. Furthermore, due to ongoing corruptions, high corporate taxes, high energy costs, and other factors, Slovakia still has a non-attractive market for Europe. (CIA, 2015) Looking to the export developments of Romania, it is clear to see that this country had a strong increasing textile industry from the years 1995 to 2005 (Figure 1). The year 2005 is a turning point of the Romanian success. From this year on, Romania’s exports have gradually decreased, because of falling production, the liberalisation of textile trade and the financial crisis. (Tudor, 2012) As shown in Table 1, Bulgaria is the country where the textile exports have witnessed a strong decline of over 60% in the period from 1995 to 2005. This decline is most significant, which can be assumed as a cause, after the approval of the ATC in 2005. However, the exports of Bulgaria, with a share of less than 1% on Europe’s total, are insignificant for the European trade. After analysing the development of European textile exports, this next section is concentrating on the World textile exports between the years 1995 to 2014. Overview of World textile exports from 1995-2014 For the World overview of textile exports, all countries with a trade value over $10 Billion USD from 1995 to 2014 are chosen. The following table lists all significant countries and their trade values. Table 4: Significant textile countries of the World with related export trade value in Billion USD Country 1995 2000 2005 2008 2010 2014 Growth % China 39.30 44.90 107.60 179.70 199.50 287.50 86.3% EU-28 2 29.00 41.10 53.40 45.20 57.80 49.8% India 8.11 11.10 17.03 22.70 27.10 38.60 79.0% Turkey 8.31 10.00 18.90 23.10 21.80 29.40 71.7% USA 18.60 21.90 21.90 22.60 23.60 26.20 29.0% Bangladesh 4.58 2.49 7.68 13.20 16.70 21.42 78.6% Korea 17.80 18.20 13.70 13.10 13.70 15.70 -11.8% Pakistan 10.30 10.60 11.60 13.80 25.4% Indonesia 6.06 8.20 8.60 10.10 11.20 12.70 52.3% Viet Nam 2.10 5.31 10.20 13.30 21.53 90.2% Mexico 4.41 11.30 9.56 6.86 6.27 6.96 36.6% (Comtrade, 2015) 2 Just Extra-EU trade considered
  • 4. Olga Loghinovici 22 november 2015 Studentnr.: r0610996 4 In the table, it is clear to see that China is the biggest export and manufacturing economy of the World. Over $200 Billion USD were circulated global in 2014. As second and third country, Germany and India are registered. The next figure presents developments of the significant textile countries in a line diagram. Figure 2: Textile countries with related development flows3 (Own illustration) China is not just the largest textile economy, it has also shown one of the most significant developments over the years. Chinese textile exports grew by 86% from 1995 to 2014 without any cutbacks. Significant to see (Figure 2) is the sharp rise between 2000 and 2008 which is a result of China’s WTO entry in late 2001 and the gradually removal of textile quotas (Lu, 2012). The economic crisis moderated Chinese export increases, but this has not led to any losses. (Table 4) Vietnam is the economy which has shown the greatest export development with an immense increase of 90.2%. This change has mostly resulted from the WTO entry in 2007 and the affiliation to Trans-Pacific Partnership in 2010. Both approvals have led to a free textile trade. (CIA, 2015) India, with a constant growth rate of 79%, presents a further considerable growth. Textiles and textile products are the largest export groups and a meaningful generator of employment within this economy. With the abolition of textile quotas and the liberalization of investments, India has created an international brand economy with markets of the USA and EU as main importer (Kar, 2015). Furthermore is to say, 3 For a better overview, China was excluded of the line diagram 0 10 20 30 40 50 60 70 1995 2000 2005 2008 2010 2014 EU-28 India Turkey USA Bangladesh Korea Pakistan Indonesia Vietnam Mexico
  • 5. Olga Loghinovici 22 november 2015 Studentnr.: r0610996 5 that India has not shown losses in the development process over the years. (Figure 2) Additional significant export increases have shown Bangladesh. This country has reached a growth rate of 78.6% since the year 2000. The data for Bangladesh is available just until the year 2011. In the recent years, the textile sector has gone through a series of factory accidents that have killed over 1,000 workers and strikes that closed down most of the economic activities (CIA, 2015). These happenings could have influenced the textile sector significantly and it is possible to assume that the growth rate could take a turn for the worst in the future. Turkey has shown similar developments as Bangladesh. Since 1995, Turkey presents a constant growth with a moderate cutback during the economic crisis, which has not resulted in a considerable deficit. (Figure 2) There is just one economy, Korea, which has revealed a negative growth rate over the years (Figure 2). Before the Korean textile industry has been challenged by the reduction of trade quotas, this country has demonstrated a constant increase of textile exports. Korea is one developing country which has not stayed resistant against the new and strong competitiveness (like China and Europe). (Truett & Truett, 2011) Conclusion It is significant to see that the world countries have all been influenced by the 10 year transitional program from the WTO since 1995. The final implementation of the Agreement for Textile and Clothing in 2005 has liberalised the global textile trade with quota eliminations. All in all, the approval of the ATC has generated both ‘winners’ and ‘losers’. Most of the Asian countries show considerable growth rates. China and Vietnam are the two economies which have the greatest increase from 1995 to 2014, followed by India, Bangladesh and Turkey. Of these countries, Vietnam can be assumed as a new and future important production area due to their fast and significant growth. Bangladesh could also count as a prospective manufacturing area, but because of the recent negative incidents, a declining growth rate is expected. Korea has shown the most significant decrease in textile exporting which is why this country is on top of the ‘losers’ category. In conclusion, it is to say, that the production of this country is decreasing and hence shifting away. Europe has presented a positive growth rate between 1995 and 2014. But this continent had a deep cutback during the economic crisis. Without this occurrence, Europe could have had a better textile export increase. Within Europe, Germany and Italy are the main exporters of textiles. These have shown a gradual increase parallel to the rise of the EU total textile exports since 1995. This means that both countries were, and still are, the most important
  • 6. Olga Loghinovici 22 november 2015 Studentnr.: r0610996 6 production areas for Europe. Spain is also a significant EU member in development, which explains a shift in the European textile production. This country has shown an incredible rise over the years. In 2014, Spain was the third largest textile exporter and a very important production place of the European Union. Another significant change was shown in Romania. In conclusion of this development, it is possible to say that Romania was an essential textile exporter and manufacturing base up until 2005. After this year, because of a decrease in exports, there followed a shifting away of production. To put everything in a nutshell, international textile productions are increasingly shifting to the Asian economies, most importantly to China, Vietnam, Turkey, India, and within Europe they are shifting to Spain. A considerable shifting away of production has shown from Romania, Korea and possibly from Bangladesh.
  • 7. Olga Loghinovici 22 november 2015 Studentnr.: r0610996 7 Appendix - Tables Table 2: Harmonized coding system of textile and textile articles (Comtrade, 2015) HS Code Name of Subdivision 50 Silk 51 Wool, animal hair, horsehair yarn and fabric thereof 52 Cotton 53 Vegetable textile fibres nes, paper yarn, woven fabric 54 Man-made filaments 55 Man-made staple fibres 56 Wadding, felt, nonwovens, yarns, twine, cordage, etc. 57 Carpets and other textile floor coverings 58 Special woven or tufted fabric, lace, tapestry etc. 59 Impregnated, coated or laminated textile fabric 60 Knitted or crocheted fabric 61 Articles of apparel, accessories, knit or crochet 62 Articles of apparel, accessories, not knit or crochet 63 Other made textile articles, sets, worn clothing etc. Table 3: EU-28 with related export trade value in Billion USD (Comtrade, 2015) COUNTRY 1995 2000 2005 2008 2010 2014 GROWTH % Austria 5.51 4.63 5.61 4.39 2.94 3.11 -43.6% Belgium 15.70 14.30 17.80 14.10 10.20 -35.0% Bulgaria 2.47 2.01 2.55 2.07 0.83 -66.4% Croatia 0.96 0.58 0.72 0.65 0.54 0.78 -18.7% Cyprus 0.02 0.02 0.02 0.02 0.07 0.17 +88.2% Czech Republic 1.86 1.77 3.31 4.22 3.57 4.25 +56.2% Denmark 2.06 2.59 3.83 5.37 4.71 5.65 +63.5% Estonia 0.25 0.39 0.57 0.69 0.51 0.62 +59.7% Finland 0.69 0.56 0.71 0.94 0.63 0.72 +42.0% France 13.40 11.90 15.10 18.40 15.10 16.60 +18.1% Germany 23.00 18.60 27.00 34.90 32.90 36.40 +36.8% Greece 2.59 1.93 2.34 2.39 1.94 1.59 -38.6% Hungary 1.30 1.56 1.96 1.78 1.38 1.75 +25.7% Ireland 1.24 0.82 0.76 0.62 0.80 0.69 -44.4% Italy 26.30 24.60 32.90 40.20 31.90 37.00 +28.9% Latvia 0.18 0.26 0.48 0.51 0.39 0.56 +67.9% Lithuania 0.39 0.71 1.12 1.30 1.24 1.76 +77.8% Luxembourg 0.41 0.69 0.81 0.82 0.74 +44.6% Malta 0.18 0.16 0.17 0.14 0.08 0.06 -66.7% Netherlands 6.20 4.89 8.14 11.40 10.90 15.20 +59.2% Poland 2.83 2.65 3.79 5.63 5.02 7.01 +59.6% Portugal 5.47 4.54 5.07 6.00 5.10 6.14 +10.9% Romania 1.57 2.51 5.26 5.10 4.05 5.17 +69.6% Slovakia 0.59 0.78 1.34 1.79 1.64 2.09 +71.8% Slovenia 0.95 0.63 0.84 1.01 0.82 0.93 -21.0% Spain 3.79 5.04 8.30 11.80 11.30 16.80 +77.4% Sweden 1.08 1.26 1.76 2.35 2.18 2.77 +61.0% UK 9.33 9.00 10.30 11.30 10.10 13.50 +30.9% EU TOTAL 129.91 119.10 162.44 189.88 161.66 182.06 +28.6% Table 2 shows all EU-28 member states and their trade values within the EU and to the world summed up in 1995, 2000 and 2005, due to the ATC. As well as year 2008, 2010 and 2014, due to the financial crisis and recovery process.