SlideShare a Scribd company logo
1 of 1
Download to read offline
Table	1	displays	the	number	and	distribu3on	of	variants	with	at	least	
200	total	reads.	Of	the	67K	variants,	nearly	63K	were	SNPs	and	4K	were	
indels.	The	vast	majority	of	the	SNPs	were	bi-allelic,	with	930	tri-allelic	
and	 9	 tetra-allelic	 SNPs	 in	 the	 dataset.	 Genome-wide	 coverage	 was	
evenly	 distributed:	 the	 fewest	 variants	 were	 discovered	 on	
Chromosome	12,	with	this	number	s3ll	over	3000.	


			The	number	of	SNPs	declined	rapidly	as	the	minimum	average	depth	
per	sample	was	raised,	from	14K	SNPs	with	at	least	20X	per	sample	to	
only	3300	SNPs	with	at	least	50X.	These	results,	which	correspond	to	an	
approximately	48-plex	run,	were	compared	against	the	results	based	on	
a	 single	 lane	 (i.e.,	 96-plex).	 With	 only	 one	 lane,	 around	 600	 variants	
were	 discovered	 with	 an	 average	 depth	 per	 sample	 of	 at	 least	 50X	
(Figure	2).	This	means	that	reducing	the	mul3plex	level	by	a	factor	of	
two	increased	the	number	of	useful	variants	for	genotyping	by	a	factor	
of	six.		


		The	accuracy	of	three	marker	imputa3on	methods	was	compared	
using	SNP	array	data:	k-nearest	neighbors	(kNN),	Random	Forest	
(RF),	and	a	polyploid	HMM	algorithm.		The	first	two	do	not	rely	on	
a	gene3c	or	physical	map,	while	the	HMM	algorithm	does.		For	all	
three	 methods,	 the	 error	 rate	 increased	 with	 minor	 allele	
frequency,	as	expected	(Figure	3).		The	best	method	proved	to	be	
RF	(19%	error	on	average),	followed	by	HMM	(46%),	and	then	kNN	
(54%).	 We	 had	 expected	 the	 HMM	 method	 to	 outperform	 the	
other	 two	 because	 it	 exploits	 map	 informa3on,	 but	 further	
research	is	needed	to	realize	this	goal.	


INTRODUCTION	
			Genotyping-by-sequencing	(GBS)	is	being	widely	used	in	diploid	
crops	 as	 an	 efficient	 technology	 for	 iden3fying	 genome-wide	
markers	to	assist	breeding.	Both	genome-wide	associa3on	studies	
and	genomic	selec3on	have	benefited	from	the	availability	of	GBS	
markers	 (Morris	 et	 al.	 2012;	 Poland	 et	 al.	 2012).	 One	 of	 the	
challenges	with	GBS	is	how	to	handle	missing	data,	but	for	diploids	
there	 are	 many	 accurate	 and	 accessible	 op3ons	 for	 marker	
imputa3on	(Rutkoski	et	al.	2013;	Swarts	et	al.	2014).		
	 	 	For	autotetraploid	crops,	such	as	potato	(Solanum	tuberosum),	
the	cost	effec3veness	of	GBS	is	less	certain	due	to	the	higher	read	
depths	 (50–60X)	 needed	 to	 accurately	 differen3ate	 the	 three	
heterozygous	genotypes.	There	is	also	less	informa3on	published	
about	imputa3on	methods	and	accuracy.	Our	objec3ves	were	to	
(1)	 develop	 a	 bioinforma3cs	 pipeline	 for	 GBS	 variant	 discovery,	
genotype	calling,	and	imputa3on	in	autotetraploids,	(2)	apply	the	
pipeline	to	a	panel	of	elite	potato	breeding	lines	and	varie3es	from	
across	North	America,	and	(3)	interpret	the	results	in	the	context	
of	a	compe3ng	marker	technology:	the	potato	Infinium	SNP	array	
(Douches	et	al.	2014).	
	
MATERIALS	AND	METHODS	
	 	 	 Ninety-one	 elite	 tetraploid	 russet	 potato	 lines	 were	 selected	
from	 the	 Na3onal	 Fry	 Processing	 Trial	 (NFPT)	 for	 GBS.	 Based	 on	
the	 results	 of	 an	 enzyme	 op3miza3on	 study,	 the	 methyla3on-
insensi3ve,	6	bp	restric3on	enzyme	EcoT22I	was	used	for	the	DNA	
diges3on.	 DNA	 fragments	 were	 barcoded	 and	 pooled	 into	 one	
library	 at	 the	 Cornell	 Biotech	 Center,	 following	 the	 protocol	 of	
Elshire	et	al.	(2011).		The	library	was	sequenced	on	two	lanes	of	an	
Illumina	 HiSeq2000,	 producing	 100	 bp	 single-end	 reads.	 A	
bioinforma3cs	 pipeline	 was	 developed	 to	 demul3plex	 (Cutadapt,	
Mar3n	2011)	and	align	(BWA	mem,	Li	2010)	reads	to	the	potato	
reference	genome	(v4.03,	Sharma	et	al.	2013),	and	then	variants	
were	called	using	the	Genome	Analysis	Toolkit	(GATK,	McKenna,	et	
al.	 2010),	 without	 removing	 duplicates.	 BAM	 and	 VCF	 files	 were	
analyzed	using	bedtools	and	VCFtools,	respec3vely.	
	 	 	 Infinium	 SNP	 array	 data	 for	 88	 of	 the	 91	 lines	 from	 the	 GBS	
study,	plus	73	addi3onal	NFPT	lines	(total	N	=	161),	were	used	to	
test	 the	 accuracy	 of	 three	 imputa3on	 methods:	 k-Nearest	
Neighbors	 (kNN),	 Random	 Forest	 (RF,	 Breiman	 2001;	 Liaw	 and	
Wiener	2002),	and	a	polyploid	Hidden	Markov	Model	(HMM,	Su	et	
al.	 2008).	 For	 all	 three	 methods,	 the	 imputed	 values	 were	
categorical	rather	than	numeric.	The	SNP	dataset	contained	2277	
markers	 with	 tetraploid	 genotype	 calls,	 minor	 allele	 frequency	 ≥	
0.1,	and	frac3on	of	missing	calls	≤	0.05.	For	each	marker	tested,	30	
randomly	 chosen	 samples	 were	 masked,	 imputed,	 and	 then	
compared	to	the	true	genotypes	to	calculate	the	percent	error.	
	
RESULTS	AND	DISCUSSION	
	 	 	 The	 number	 of	 SNPs	 and	 number	 of	 aligned	 base	 pairs	 were	
determined	at	progressively	higher	minimum	depth	(Figure	1).	The	
ra3o	 of	 these	 two	 quan33es,	 which	 equals	 the	 genomic	 SNP	
density,	declined	rapidly	as	depth	increased	from	one,	reaching	a	
quasi-constant	 value	 of	 1	 SNP	 per	 42	 bp	 above	 100X	 per	 SNP.		
Using	 exome	 capture	 with	 a	 panel	 of	 83	 European	 tetraploid	
varie3es,	Uitdewilligen	et	al.	(2013)	reported	intron	and	exon	SNP	
densi3es	of	1	SNP	per	15	and	24	bp,	respec3vely.		
Schuyler	D.	Smith,	Jeffrey	B.	Endelman	
Department	of	Hor3culture,	University	of	Wisconsin,	Madison,	WI,	USA	
Development	and	applica<on	of	a	bioinforma<cs	pipeline	for		
genotyping-by-sequencing	(GBS)	of	autotetraploid	potato	
References	
Breiman. 2001. Machine Learning. 45:5-32.
Douches et al. 2014. Potato Research.
Elshire et al. 2011. PLoS One. (6)5.
Fragoso et al. 2016. Genetics. (203)2:
Li et al. 2010. Bioinformatics. 26(5):589-595.
Liaw and Wiener. 2002. R News. 2(3):18-22.
Martin. 2011. EMBnet.journal. 17(1):10-12.
McKenna et al. 2010. Genome. Res. 20:1297-1303.
Morris et al. 2012. Nat. Ass. Sci. 110(2):453-458.
Poland et al. 2012. Plant Genome. 5(3):103-113.
Rutkoski et al. 2013. G3. (3)3:427-439.
Sharma et al. 2013. G3. 3(11):2031-2047.
Spindel et al. 2013. Theor. Appl. Genet. 126:2699-2716
Su et al. 2008. Bioinformatics. 24(7):972-978.
Swarts et al. 2014. The Plant Genome. (7)3:1-12.
Uitdewilligen et al. 2013. PLoS One. 8(5).
	
	
Figure	1.	Es3ma3ng	genomic	SNP	density.		Above	100X	across	the	popula3on,	the	
number	of	aligned	base	pairs	per	SNP	is	approximately	constant	at	42.		
Figure	2.	Effect	of	GBS	mul3plexing	on	variant	discovery.	The	red	and	blue	curves	show	
the	number	of	variants	vs.	depth	when	using	a	single	Illumina	lane	(i.e.,	96-plex).		The	
purple	curve	is	the	sum	of	the	red	and	blue	curves,	which	should	be	compared	with	the	
combined	analysis	of	both	lanes	(i.e.,	48-plex)	in	black.	
Table	1.	Variant	sta3s3cs	and	the	distribu3on	across	chromosomes,	with	a	minimum	
popula3on	depth	of	200X.	
Whole	Genome	 Chromosome	
Variants	 1	 2	 3	 4	 5	 6	 7	 8	 9	 10	 11	 12	
Bi-Allelic	SNPs	 61,992	 7566	 4037	 5459		 7143	 5654	 4054	 5812	 5321	 5956	 3690	 4448	 2843	
Tri-Allelic	 930	 150	 59	 81	 136	 86	 51	 106	 82	 98	 34	 6	 41	
Tetra-Allelic	 9		 -				 -				 3		 1		 1		 1		 1		 -				 1		 -				 -				 1		
Total	SNPS	 62,931	 7716	 4096	 5546	 7281	 5742	 4107	 5920	 5403	 6056	 3724	 4454	 2886	
Indels	 4,069	 499	 319	 418	 396	 385	 296	 380	 315	 335	 245	 305	 176	
Total	 67,000	 8215	 4415	 5964	 7677	 6127	 4403	 6300	 5718	 6391	 3969	 4759	 3062	
Thousands	of	Variants	
Error	Rate	
kNN	 HMM	 RF	
Figure	3.	Comparison	of	the	error	rate	for	three	marker	imputa3on	methods.	(kNN	
=	k-Nearest	Neighbors,	HMM	=	Hidden	Markov	Model,	RF	=	Random	Forest)	
Minimum	Average	Depth	per	Sample	
CONCLUSIONS	
			GBS	was	originally	developed	for	inbred	lines,	where	only	a	single	
read	 is	 needed	 to	 infer	 the	 genotype	 of	 a	 sample	 (Elshire	 et	 al.	
2011).		For	crops	such	as	maize,	barley,	and	rice,	it	is	now	prac3cal	
to	 include	 384	 samples	 in	 one	 library	 (Spindel	 et	 al.	 2013).	 For	
autotetraploid	crops,	such	as	potato,	the	op3mal	mul3plex	level	is	
less	 clear.	 Lower	 mul3plexing	 improves	 the	 number	 of	 variants	
with	high	read	depth,	which	is	needed	to	accurately	differen3ate	
between	the	three	heterozygous	states,	but	the	addi3onal	cost	per	
sample	 means	 fewer	 genotyped	 individuals	 at	 a	 fixed	 budget.		
From	the	binomial	distribu3on,	we	expect	a	duplex	call	error	rate	
of	 10%	 at	 50–60X.	 Uitdewilligen	 et	 al.	 (2013)	 suggested	 an	 even	
higher	threshold	of	60–80X.	Even	at	48-plex,	only	3300	SNPs	had	an	
average	depth	per	sample	of	at	least	50X,	which	is	less	than	the	
number	of	SNPs	(≈5000)	with	high	quality	tetraploid	calls	on	the	
potato	 Infinium	 array	 (Douches	 et	 al.	 2014;	 Schmitz	 Carley	 et	 al.	
unpublished).	 Given	 that	 our	 GBS	 cost	 per	 sample	 at	 48-plex	 is	
comparable	to	the	array,	at	present	there	is	linle	incen3ve	to	use	
GBS	for	rou3ne	use	in	the	University	of	Wisconsin	potato	breeding	
program.	This	conclusion	is	predicated	on	our	use	of	the	EcoT22I	
enzyme	 and	 current	 sequencing	 technology.	 Improvements	 in	
either	aspect,	or	the	availability	of	a	polyploid	HMM	for	genotype	
calling	 (analogous	 to	 the	 diploid	 method	 of	 Fragoso	 et	 al.	 2016),	
could	make	GBS	more	cost-effec3ve	for	tetraploid	potato.	
Minimum	total	depth	
Acknowledgments	
We	 thank	 the	 breeders	 involved	 in	 the	 Na3onal	 Fry	 Processing	 Trial	
(NFPT)	for	contribu3ng	germplasm,	as	well	as	the	financial	sponsors	of	
the	NFPT.	Primary	funding	for	this	project	was	provided	by	USDA-NIFA-
AFRI	Grant	No.	2014-67013-22418.

More Related Content

Similar to Schuyler icqg poster2016

Ashg poster sp_compressed
Ashg poster sp_compressedAshg poster sp_compressed
Ashg poster sp_compressedAmy Cullinan
 
2014-11-17 Taylor Broad Poster FINAL
2014-11-17 Taylor Broad Poster FINAL2014-11-17 Taylor Broad Poster FINAL
2014-11-17 Taylor Broad Poster FINALMichael Cuoco
 
MASSIVELY PARELLEL SIGNATURE SEQUENCING
MASSIVELY PARELLEL SIGNATURE SEQUENCINGMASSIVELY PARELLEL SIGNATURE SEQUENCING
MASSIVELY PARELLEL SIGNATURE SEQUENCINGAashish Patel
 
ASHG 2015 - Redundant Annotations in Tertiary Analysis
ASHG 2015 - Redundant Annotations in Tertiary AnalysisASHG 2015 - Redundant Annotations in Tertiary Analysis
ASHG 2015 - Redundant Annotations in Tertiary AnalysisJames Warren
 
Microbial Phylogenomics (EVE161) Class 17: Genomes from Uncultured
Microbial Phylogenomics (EVE161) Class 17: Genomes from UnculturedMicrobial Phylogenomics (EVE161) Class 17: Genomes from Uncultured
Microbial Phylogenomics (EVE161) Class 17: Genomes from UnculturedJonathan Eisen
 
Unilag workshop complex genome analysis
Unilag workshop   complex genome analysisUnilag workshop   complex genome analysis
Unilag workshop complex genome analysisDr. Olusoji Adewumi
 
Lecture2 nucleic acid (1)
Lecture2 nucleic acid (1)Lecture2 nucleic acid (1)
Lecture2 nucleic acid (1)SourabhKumar240
 
Useful.ppt
Useful.pptUseful.ppt
Useful.pptaaaa bbb
 
DNA Sequencing - DNA sequencing is like reading the instructions inside a cell
DNA Sequencing -  DNA sequencing is like reading the instructions inside a cellDNA Sequencing -  DNA sequencing is like reading the instructions inside a cell
DNA Sequencing - DNA sequencing is like reading the instructions inside a cellAmitSamadhiya1
 
DNA Sequencing: History, methods and NGS
DNA Sequencing: History, methods and NGSDNA Sequencing: History, methods and NGS
DNA Sequencing: History, methods and NGS4RTPCRAnand
 
Concept of genome mapping
Concept of genome mappingConcept of genome mapping
Concept of genome mappingTenzin t
 
cytogenomics tools and techniques and chromosome sorting.pptx
cytogenomics tools and techniques and chromosome sorting.pptxcytogenomics tools and techniques and chromosome sorting.pptx
cytogenomics tools and techniques and chromosome sorting.pptxPABOLU TEJASREE
 
Construction of human gene map through map integration- from genetic map to p...
Construction of human gene map through map integration- from genetic map to p...Construction of human gene map through map integration- from genetic map to p...
Construction of human gene map through map integration- from genetic map to p...Central University Of Kerala
 
Human Genome Project
Human Genome ProjectHuman Genome Project
Human Genome ProjectSachin Rawat
 
Microarray Statistics
Microarray StatisticsMicroarray Statistics
Microarray StatisticsA Roy
 

Similar to Schuyler icqg poster2016 (20)

Ashg poster sp_compressed
Ashg poster sp_compressedAshg poster sp_compressed
Ashg poster sp_compressed
 
2014-11-17 Taylor Broad Poster FINAL
2014-11-17 Taylor Broad Poster FINAL2014-11-17 Taylor Broad Poster FINAL
2014-11-17 Taylor Broad Poster FINAL
 
MASSIVELY PARELLEL SIGNATURE SEQUENCING
MASSIVELY PARELLEL SIGNATURE SEQUENCINGMASSIVELY PARELLEL SIGNATURE SEQUENCING
MASSIVELY PARELLEL SIGNATURE SEQUENCING
 
ASHG 2015 - Redundant Annotations in Tertiary Analysis
ASHG 2015 - Redundant Annotations in Tertiary AnalysisASHG 2015 - Redundant Annotations in Tertiary Analysis
ASHG 2015 - Redundant Annotations in Tertiary Analysis
 
Microbial Phylogenomics (EVE161) Class 17: Genomes from Uncultured
Microbial Phylogenomics (EVE161) Class 17: Genomes from UnculturedMicrobial Phylogenomics (EVE161) Class 17: Genomes from Uncultured
Microbial Phylogenomics (EVE161) Class 17: Genomes from Uncultured
 
Unilag workshop complex genome analysis
Unilag workshop   complex genome analysisUnilag workshop   complex genome analysis
Unilag workshop complex genome analysis
 
Lecture2 nucleic acid (1)
Lecture2 nucleic acid (1)Lecture2 nucleic acid (1)
Lecture2 nucleic acid (1)
 
Microarray Analysis
Microarray AnalysisMicroarray Analysis
Microarray Analysis
 
Useful.ppt
Useful.pptUseful.ppt
Useful.ppt
 
DNA Sequencing - DNA sequencing is like reading the instructions inside a cell
DNA Sequencing -  DNA sequencing is like reading the instructions inside a cellDNA Sequencing -  DNA sequencing is like reading the instructions inside a cell
DNA Sequencing - DNA sequencing is like reading the instructions inside a cell
 
DNA Sequencing: History, methods and NGS
DNA Sequencing: History, methods and NGSDNA Sequencing: History, methods and NGS
DNA Sequencing: History, methods and NGS
 
Genetic mapping
Genetic mappingGenetic mapping
Genetic mapping
 
Concept of genome mapping
Concept of genome mappingConcept of genome mapping
Concept of genome mapping
 
DNA sequencing
DNA sequencing  DNA sequencing
DNA sequencing
 
cytogenomics tools and techniques and chromosome sorting.pptx
cytogenomics tools and techniques and chromosome sorting.pptxcytogenomics tools and techniques and chromosome sorting.pptx
cytogenomics tools and techniques and chromosome sorting.pptx
 
Construction of human gene map through map integration- from genetic map to p...
Construction of human gene map through map integration- from genetic map to p...Construction of human gene map through map integration- from genetic map to p...
Construction of human gene map through map integration- from genetic map to p...
 
Human Genome Project
Human Genome ProjectHuman Genome Project
Human Genome Project
 
dot plot analysis
dot plot analysisdot plot analysis
dot plot analysis
 
Genome Mapping
Genome MappingGenome Mapping
Genome Mapping
 
Microarray Statistics
Microarray StatisticsMicroarray Statistics
Microarray Statistics
 

Recently uploaded

Cultivation of KODO MILLET . made by Ghanshyam pptx
Cultivation of KODO MILLET . made by Ghanshyam pptxCultivation of KODO MILLET . made by Ghanshyam pptx
Cultivation of KODO MILLET . made by Ghanshyam pptxpradhanghanshyam7136
 
STERILITY TESTING OF PHARMACEUTICALS ppt by DR.C.P.PRINCE
STERILITY TESTING OF PHARMACEUTICALS ppt by DR.C.P.PRINCESTERILITY TESTING OF PHARMACEUTICALS ppt by DR.C.P.PRINCE
STERILITY TESTING OF PHARMACEUTICALS ppt by DR.C.P.PRINCEPRINCE C P
 
Broad bean, Lima Bean, Jack bean, Ullucus.pptx
Broad bean, Lima Bean, Jack bean, Ullucus.pptxBroad bean, Lima Bean, Jack bean, Ullucus.pptx
Broad bean, Lima Bean, Jack bean, Ullucus.pptxjana861314
 
SOLUBLE PATTERN RECOGNITION RECEPTORS.pptx
SOLUBLE PATTERN RECOGNITION RECEPTORS.pptxSOLUBLE PATTERN RECOGNITION RECEPTORS.pptx
SOLUBLE PATTERN RECOGNITION RECEPTORS.pptxkessiyaTpeter
 
Chromatin Structure | EUCHROMATIN | HETEROCHROMATIN
Chromatin Structure | EUCHROMATIN | HETEROCHROMATINChromatin Structure | EUCHROMATIN | HETEROCHROMATIN
Chromatin Structure | EUCHROMATIN | HETEROCHROMATINsankalpkumarsahoo174
 
PossibleEoarcheanRecordsoftheGeomagneticFieldPreservedintheIsuaSupracrustalBe...
PossibleEoarcheanRecordsoftheGeomagneticFieldPreservedintheIsuaSupracrustalBe...PossibleEoarcheanRecordsoftheGeomagneticFieldPreservedintheIsuaSupracrustalBe...
PossibleEoarcheanRecordsoftheGeomagneticFieldPreservedintheIsuaSupracrustalBe...Sérgio Sacani
 
Orientation, design and principles of polyhouse
Orientation, design and principles of polyhouseOrientation, design and principles of polyhouse
Orientation, design and principles of polyhousejana861314
 
Chemistry 4th semester series (krishna).pdf
Chemistry 4th semester series (krishna).pdfChemistry 4th semester series (krishna).pdf
Chemistry 4th semester series (krishna).pdfSumit Kumar yadav
 
Pests of cotton_Borer_Pests_Binomics_Dr.UPR.pdf
Pests of cotton_Borer_Pests_Binomics_Dr.UPR.pdfPests of cotton_Borer_Pests_Binomics_Dr.UPR.pdf
Pests of cotton_Borer_Pests_Binomics_Dr.UPR.pdfPirithiRaju
 
GFP in rDNA Technology (Biotechnology).pptx
GFP in rDNA Technology (Biotechnology).pptxGFP in rDNA Technology (Biotechnology).pptx
GFP in rDNA Technology (Biotechnology).pptxAleenaTreesaSaji
 
Botany 4th semester file By Sumit Kumar yadav.pdf
Botany 4th semester file By Sumit Kumar yadav.pdfBotany 4th semester file By Sumit Kumar yadav.pdf
Botany 4th semester file By Sumit Kumar yadav.pdfSumit Kumar yadav
 
GBSN - Microbiology (Unit 1)
GBSN - Microbiology (Unit 1)GBSN - Microbiology (Unit 1)
GBSN - Microbiology (Unit 1)Areesha Ahmad
 
Hubble Asteroid Hunter III. Physical properties of newly found asteroids
Hubble Asteroid Hunter III. Physical properties of newly found asteroidsHubble Asteroid Hunter III. Physical properties of newly found asteroids
Hubble Asteroid Hunter III. Physical properties of newly found asteroidsSérgio Sacani
 
Raman spectroscopy.pptx M Pharm, M Sc, Advanced Spectral Analysis
Raman spectroscopy.pptx M Pharm, M Sc, Advanced Spectral AnalysisRaman spectroscopy.pptx M Pharm, M Sc, Advanced Spectral Analysis
Raman spectroscopy.pptx M Pharm, M Sc, Advanced Spectral AnalysisDiwakar Mishra
 
DIFFERENCE IN BACK CROSS AND TEST CROSS
DIFFERENCE IN  BACK CROSS AND TEST CROSSDIFFERENCE IN  BACK CROSS AND TEST CROSS
DIFFERENCE IN BACK CROSS AND TEST CROSSLeenakshiTyagi
 
Formation of low mass protostars and their circumstellar disks
Formation of low mass protostars and their circumstellar disksFormation of low mass protostars and their circumstellar disks
Formation of low mass protostars and their circumstellar disksSérgio Sacani
 
Discovery of an Accretion Streamer and a Slow Wide-angle Outflow around FUOri...
Discovery of an Accretion Streamer and a Slow Wide-angle Outflow around FUOri...Discovery of an Accretion Streamer and a Slow Wide-angle Outflow around FUOri...
Discovery of an Accretion Streamer and a Slow Wide-angle Outflow around FUOri...Sérgio Sacani
 
VIRUSES structure and classification ppt by Dr.Prince C P
VIRUSES structure and classification ppt by Dr.Prince C PVIRUSES structure and classification ppt by Dr.Prince C P
VIRUSES structure and classification ppt by Dr.Prince C PPRINCE C P
 

Recently uploaded (20)

Cultivation of KODO MILLET . made by Ghanshyam pptx
Cultivation of KODO MILLET . made by Ghanshyam pptxCultivation of KODO MILLET . made by Ghanshyam pptx
Cultivation of KODO MILLET . made by Ghanshyam pptx
 
STERILITY TESTING OF PHARMACEUTICALS ppt by DR.C.P.PRINCE
STERILITY TESTING OF PHARMACEUTICALS ppt by DR.C.P.PRINCESTERILITY TESTING OF PHARMACEUTICALS ppt by DR.C.P.PRINCE
STERILITY TESTING OF PHARMACEUTICALS ppt by DR.C.P.PRINCE
 
Broad bean, Lima Bean, Jack bean, Ullucus.pptx
Broad bean, Lima Bean, Jack bean, Ullucus.pptxBroad bean, Lima Bean, Jack bean, Ullucus.pptx
Broad bean, Lima Bean, Jack bean, Ullucus.pptx
 
SOLUBLE PATTERN RECOGNITION RECEPTORS.pptx
SOLUBLE PATTERN RECOGNITION RECEPTORS.pptxSOLUBLE PATTERN RECOGNITION RECEPTORS.pptx
SOLUBLE PATTERN RECOGNITION RECEPTORS.pptx
 
Chromatin Structure | EUCHROMATIN | HETEROCHROMATIN
Chromatin Structure | EUCHROMATIN | HETEROCHROMATINChromatin Structure | EUCHROMATIN | HETEROCHROMATIN
Chromatin Structure | EUCHROMATIN | HETEROCHROMATIN
 
PossibleEoarcheanRecordsoftheGeomagneticFieldPreservedintheIsuaSupracrustalBe...
PossibleEoarcheanRecordsoftheGeomagneticFieldPreservedintheIsuaSupracrustalBe...PossibleEoarcheanRecordsoftheGeomagneticFieldPreservedintheIsuaSupracrustalBe...
PossibleEoarcheanRecordsoftheGeomagneticFieldPreservedintheIsuaSupracrustalBe...
 
Orientation, design and principles of polyhouse
Orientation, design and principles of polyhouseOrientation, design and principles of polyhouse
Orientation, design and principles of polyhouse
 
The Philosophy of Science
The Philosophy of ScienceThe Philosophy of Science
The Philosophy of Science
 
Chemistry 4th semester series (krishna).pdf
Chemistry 4th semester series (krishna).pdfChemistry 4th semester series (krishna).pdf
Chemistry 4th semester series (krishna).pdf
 
Pests of cotton_Borer_Pests_Binomics_Dr.UPR.pdf
Pests of cotton_Borer_Pests_Binomics_Dr.UPR.pdfPests of cotton_Borer_Pests_Binomics_Dr.UPR.pdf
Pests of cotton_Borer_Pests_Binomics_Dr.UPR.pdf
 
GFP in rDNA Technology (Biotechnology).pptx
GFP in rDNA Technology (Biotechnology).pptxGFP in rDNA Technology (Biotechnology).pptx
GFP in rDNA Technology (Biotechnology).pptx
 
Botany 4th semester file By Sumit Kumar yadav.pdf
Botany 4th semester file By Sumit Kumar yadav.pdfBotany 4th semester file By Sumit Kumar yadav.pdf
Botany 4th semester file By Sumit Kumar yadav.pdf
 
GBSN - Microbiology (Unit 1)
GBSN - Microbiology (Unit 1)GBSN - Microbiology (Unit 1)
GBSN - Microbiology (Unit 1)
 
Hubble Asteroid Hunter III. Physical properties of newly found asteroids
Hubble Asteroid Hunter III. Physical properties of newly found asteroidsHubble Asteroid Hunter III. Physical properties of newly found asteroids
Hubble Asteroid Hunter III. Physical properties of newly found asteroids
 
Raman spectroscopy.pptx M Pharm, M Sc, Advanced Spectral Analysis
Raman spectroscopy.pptx M Pharm, M Sc, Advanced Spectral AnalysisRaman spectroscopy.pptx M Pharm, M Sc, Advanced Spectral Analysis
Raman spectroscopy.pptx M Pharm, M Sc, Advanced Spectral Analysis
 
DIFFERENCE IN BACK CROSS AND TEST CROSS
DIFFERENCE IN  BACK CROSS AND TEST CROSSDIFFERENCE IN  BACK CROSS AND TEST CROSS
DIFFERENCE IN BACK CROSS AND TEST CROSS
 
Formation of low mass protostars and their circumstellar disks
Formation of low mass protostars and their circumstellar disksFormation of low mass protostars and their circumstellar disks
Formation of low mass protostars and their circumstellar disks
 
Discovery of an Accretion Streamer and a Slow Wide-angle Outflow around FUOri...
Discovery of an Accretion Streamer and a Slow Wide-angle Outflow around FUOri...Discovery of an Accretion Streamer and a Slow Wide-angle Outflow around FUOri...
Discovery of an Accretion Streamer and a Slow Wide-angle Outflow around FUOri...
 
Engler and Prantl system of classification in plant taxonomy
Engler and Prantl system of classification in plant taxonomyEngler and Prantl system of classification in plant taxonomy
Engler and Prantl system of classification in plant taxonomy
 
VIRUSES structure and classification ppt by Dr.Prince C P
VIRUSES structure and classification ppt by Dr.Prince C PVIRUSES structure and classification ppt by Dr.Prince C P
VIRUSES structure and classification ppt by Dr.Prince C P
 

Schuyler icqg poster2016

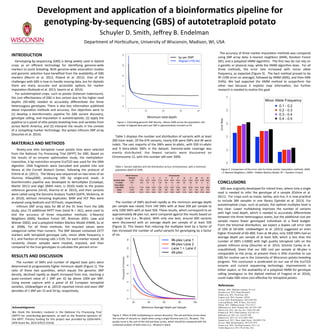
  • 1. Table 1 displays the number and distribu3on of variants with at least 200 total reads. Of the 67K variants, nearly 63K were SNPs and 4K were indels. The vast majority of the SNPs were bi-allelic, with 930 tri-allelic and 9 tetra-allelic SNPs in the dataset. Genome-wide coverage was evenly distributed: the fewest variants were discovered on Chromosome 12, with this number s3ll over 3000. The number of SNPs declined rapidly as the minimum average depth per sample was raised, from 14K SNPs with at least 20X per sample to only 3300 SNPs with at least 50X. These results, which correspond to an approximately 48-plex run, were compared against the results based on a single lane (i.e., 96-plex). With only one lane, around 600 variants were discovered with an average depth per sample of at least 50X (Figure 2). This means that reducing the mul3plex level by a factor of two increased the number of useful variants for genotyping by a factor of six. The accuracy of three marker imputa3on methods was compared using SNP array data: k-nearest neighbors (kNN), Random Forest (RF), and a polyploid HMM algorithm. The first two do not rely on a gene3c or physical map, while the HMM algorithm does. For all three methods, the error rate increased with minor allele frequency, as expected (Figure 3). The best method proved to be RF (19% error on average), followed by HMM (46%), and then kNN (54%). We had expected the HMM method to outperform the other two because it exploits map informa3on, but further research is needed to realize this goal. INTRODUCTION Genotyping-by-sequencing (GBS) is being widely used in diploid crops as an efficient technology for iden3fying genome-wide markers to assist breeding. Both genome-wide associa3on studies and genomic selec3on have benefited from the availability of GBS markers (Morris et al. 2012; Poland et al. 2012). One of the challenges with GBS is how to handle missing data, but for diploids there are many accurate and accessible op3ons for marker imputa3on (Rutkoski et al. 2013; Swarts et al. 2014). For autotetraploid crops, such as potato (Solanum tuberosum), the cost effec3veness of GBS is less certain due to the higher read depths (50–60X) needed to accurately differen3ate the three heterozygous genotypes. There is also less informa3on published about imputa3on methods and accuracy. Our objec3ves were to (1) develop a bioinforma3cs pipeline for GBS variant discovery, genotype calling, and imputa3on in autotetraploids, (2) apply the pipeline to a panel of elite potato breeding lines and varie3es from across North America, and (3) interpret the results in the context of a compe3ng marker technology: the potato Infinium SNP array (Douches et al. 2014). MATERIALS AND METHODS Ninety-one elite tetraploid russet potato lines were selected from the Na3onal Fry Processing Trial (NFPT) for GBS. Based on the results of an enzyme op3miza3on study, the methyla3on- insensi3ve, 6 bp restric3on enzyme EcoT22I was used for the DNA diges3on. DNA fragments were barcoded and pooled into one library at the Cornell Biotech Center, following the protocol of Elshire et al. (2011). The library was sequenced on two lanes of an Illumina HiSeq2000, producing 100 bp single-end reads. A bioinforma3cs pipeline was developed to demul3plex (Cutadapt, Mar3n 2011) and align (BWA mem, Li 2010) reads to the potato reference genome (v4.03, Sharma et al. 2013), and then variants were called using the Genome Analysis Toolkit (GATK, McKenna, et al. 2010), without removing duplicates. BAM and VCF files were analyzed using bedtools and VCFtools, respec3vely. Infinium SNP array data for 88 of the 91 lines from the GBS study, plus 73 addi3onal NFPT lines (total N = 161), were used to test the accuracy of three imputa3on methods: k-Nearest Neighbors (kNN), Random Forest (RF, Breiman 2001; Liaw and Wiener 2002), and a polyploid Hidden Markov Model (HMM, Su et al. 2008). For all three methods, the imputed values were categorical rather than numeric. The SNP dataset contained 2277 markers with tetraploid genotype calls, minor allele frequency ≥ 0.1, and frac3on of missing calls ≤ 0.05. For each marker tested, 30 randomly chosen samples were masked, imputed, and then compared to the true genotypes to calculate the percent error. RESULTS AND DISCUSSION The number of SNPs and number of aligned base pairs were determined at progressively higher minimum depth (Figure 1). The ra3o of these two quan33es, which equals the genomic SNP density, declined rapidly as depth increased from one, reaching a quasi-constant value of 1 SNP per 42 bp above 100X per SNP. Using exome capture with a panel of 83 European tetraploid varie3es, Uitdewilligen et al. (2013) reported intron and exon SNP densi3es of 1 SNP per 15 and 24 bp, respec3vely. Schuyler D. Smith, Jeffrey B. Endelman Department of Hor3culture, University of Wisconsin, Madison, WI, USA Development and applica<on of a bioinforma<cs pipeline for genotyping-by-sequencing (GBS) of autotetraploid potato References Breiman. 2001. Machine Learning. 45:5-32. Douches et al. 2014. Potato Research. Elshire et al. 2011. PLoS One. (6)5. Fragoso et al. 2016. Genetics. (203)2: Li et al. 2010. Bioinformatics. 26(5):589-595. Liaw and Wiener. 2002. R News. 2(3):18-22. Martin. 2011. EMBnet.journal. 17(1):10-12. McKenna et al. 2010. Genome. Res. 20:1297-1303. Morris et al. 2012. Nat. Ass. Sci. 110(2):453-458. Poland et al. 2012. Plant Genome. 5(3):103-113. Rutkoski et al. 2013. G3. (3)3:427-439. Sharma et al. 2013. G3. 3(11):2031-2047. Spindel et al. 2013. Theor. Appl. Genet. 126:2699-2716 Su et al. 2008. Bioinformatics. 24(7):972-978. Swarts et al. 2014. The Plant Genome. (7)3:1-12. Uitdewilligen et al. 2013. PLoS One. 8(5). Figure 1. Es3ma3ng genomic SNP density. Above 100X across the popula3on, the number of aligned base pairs per SNP is approximately constant at 42. Figure 2. Effect of GBS mul3plexing on variant discovery. The red and blue curves show the number of variants vs. depth when using a single Illumina lane (i.e., 96-plex). The purple curve is the sum of the red and blue curves, which should be compared with the combined analysis of both lanes (i.e., 48-plex) in black. Table 1. Variant sta3s3cs and the distribu3on across chromosomes, with a minimum popula3on depth of 200X. Whole Genome Chromosome Variants 1 2 3 4 5 6 7 8 9 10 11 12 Bi-Allelic SNPs 61,992 7566 4037 5459 7143 5654 4054 5812 5321 5956 3690 4448 2843 Tri-Allelic 930 150 59 81 136 86 51 106 82 98 34 6 41 Tetra-Allelic 9 - - 3 1 1 1 1 - 1 - - 1 Total SNPS 62,931 7716 4096 5546 7281 5742 4107 5920 5403 6056 3724 4454 2886 Indels 4,069 499 319 418 396 385 296 380 315 335 245 305 176 Total 67,000 8215 4415 5964 7677 6127 4403 6300 5718 6391 3969 4759 3062 Thousands of Variants Error Rate kNN HMM RF Figure 3. Comparison of the error rate for three marker imputa3on methods. (kNN = k-Nearest Neighbors, HMM = Hidden Markov Model, RF = Random Forest) Minimum Average Depth per Sample CONCLUSIONS GBS was originally developed for inbred lines, where only a single read is needed to infer the genotype of a sample (Elshire et al. 2011). For crops such as maize, barley, and rice, it is now prac3cal to include 384 samples in one library (Spindel et al. 2013). For autotetraploid crops, such as potato, the op3mal mul3plex level is less clear. Lower mul3plexing improves the number of variants with high read depth, which is needed to accurately differen3ate between the three heterozygous states, but the addi3onal cost per sample means fewer genotyped individuals at a fixed budget. From the binomial distribu3on, we expect a duplex call error rate of 10% at 50–60X. Uitdewilligen et al. (2013) suggested an even higher threshold of 60–80X. Even at 48-plex, only 3300 SNPs had an average depth per sample of at least 50X, which is less than the number of SNPs (≈5000) with high quality tetraploid calls on the potato Infinium array (Douches et al. 2014; Schmitz Carley et al. unpublished). Given that our GBS cost per sample at 48-plex is comparable to the array, at present there is linle incen3ve to use GBS for rou3ne use in the University of Wisconsin potato breeding program. This conclusion is predicated on our use of the EcoT22I enzyme and current sequencing technology. Improvements in either aspect, or the availability of a polyploid HMM for genotype calling (analogous to the diploid method of Fragoso et al. 2016), could make GBS more cost-effec3ve for tetraploid potato. Minimum total depth Acknowledgments We thank the breeders involved in the Na3onal Fry Processing Trial (NFPT) for contribu3ng germplasm, as well as the financial sponsors of the NFPT. Primary funding for this project was provided by USDA-NIFA- AFRI Grant No. 2014-67013-22418.