SlideShare a Scribd company logo
1 of 233
Appendix 1
Final Project Overview and Timeline
Final Project Overview
The final project for XACC 280 is a 1,750 to 2,050-word (about
3 pages, double spaced) paper in which you provide a
comprehensive analysis of the financial health of McDonald’s
Corporation and whether or not you would invest in
McDonald’s Corporation based on the information provided for
2009 and 2010 in their 2010 Annual Financial Report. The
paper, with in-text citations and references, must follow APA
formatting guidelines. NOTE: The word count does NOT
include the charts and calculations at the end of your paper.
Papers need to include: a cover page, section titles, in-text
citations, reference page. Your papers should also be edited to
remove spelling errors/word errors (using defiantly instead of
definitely for example), paragraph breaks (not one long
paragraph), double-spaced, good sentence structure and clearly
stated and well supported (with sources) points.
The final project is designed so you can apply the concepts and
skills learned in this course to a real-life financial accounting
analysis. It incorporates your foundational knowledge—
resulting from completion of Discussion questions, Check
Points, Exercises, and Assignments—into a paper that describes
your financial analyses and conclusion. When navigating each
week, keep your final project in mind to help you to prepare and
gather needed information.
The paper will include the following (do NOT include
calculations within the paper, only the results should be stated
and discussed). All calculations should be formatted and
included after the concluding paragraph (see below):
Before you begin writing, complete and review all of your
calculations first since you will need the results to include in
the writing of your paper.
· An introductory paragraph with:
· A statement of the purpose of your paper.
· A synopsis of what readers can expect to find in the paper. It
is best to write this after writing the rest of the paper.
· Your explanation of your calculated results in words of at
least two Vertical analyses for McDonald’s Corporation.
· Your explanation in words of at least two Horizontal analyses
for McDonald’s Corporation.
· Your explanation in words of at least two of each of the Ratio
analyses for McDonald’s Corporation, including a test of:
· Explain in words your calculated results of the two ratio tests
of Liquidity.
· Explain in words your calculated results of the two ratio tests
of Solvency.
· Explain in words your calculated results of the two ratio tests
of Profitability.
· NOTE: ONLY USE THE RATIOS PROVIDED IN OUR TEXT
(pg 716 – Illustration 15-27), NOT AS A RESULT OF
GOOGLE SEARCHES.
· Describe and clearly explain at least two strengths in different
areas for McDonald’s Corporation other than using the revenue
or net income information.
· Incorporate the data and other information you used to
determine each area of strength.
· Describe and clearly explain at least two areas of improvement
that McDonald’s Corporation should make to improve its
financial health. There can be other nonfinancial areas that fast
food stores can improve, but be sure to clearly link these areas
to how they would improve McDonald’s financial health.
· Incorporate the data and other information you used to
determine each area of improvement.
· If you had money to invest in a company, describe whether or
not you would invest in McDonald’s Corporation stock and
clearly explain your reasons. State at least two reasons
(different from your list of strengths above). Support those
reasons with factual information and include the source(s).
Your opinion is important, but your opinion should be
supported with factual information either from the Annual
Report, articles about McDonald’s Corporation or even
comparative data from another fast food chain (include the
source). (Resist the urge to say you would not invest because
you would use the money for something else or that you do not
understand investing). All responses must be in the context of
McDonald’s financial position in order to earn credit.)
· A concluding paragraph that summarizes your paper. This
should be a separate paragraph at the end of your paper.
· After your conclusion in a separate section, include your
calculations for all of the analyses and ratios.
· Vertical - You can use your calculations from the Week 7
Check Point, providing you show your work.
· Horizontal - You can use your calculations from the Week 7
Check Point, providing you show your work.
· Liquidity - You can use the Current Ratios you computed in
the Week 7 Check Point and select another ratio from that
section on pg 716. Show your work.
· Solvency - Use the two ratios on pg 716 in that section and
show your work.
· Profitability - Use at least two ratios from that section on pg
716 and show your work.
· After your calculations, then include the list of your
references.
Final Project Timeline
You should budget your time wisely and work on your project
throughout the course. As outlined below, you will receive the
information in the course to assist you in creating your final
project. If you fulfill the requirements of the course activities
(including reading the chapters, asking questions, practicing,
participating in discussion and completing the assigned work)
and use the feedback provided by the instructor, you will be on
the right track to successfully complete your project.
· Suggested in Week One: After you complete the chapter
reading for Week 1, you will have some notions about what
each of the four financial statements can tell you about a
company. Although not part of the assignments for this week,
you can look at the McDonald’s Corporation 2010 Annual
report (in the link at the bottom of this page) to identify the
financial statements. List for yourself the page numbers and
information you think might be important to your analysis later
on.
· Suggested in Week Six: After you view the two PhxKlips™
Financial Statements and Income Statements for the Exercise,
reexamine the 2010 Annual Report for McDonald’s Corporation
to locate the financial statements that provide data for your
analysis in the final project. Add this to your notes from Week
One.
In completing the comprehensive Application in Week Six, you
develop financial statements from raw data. Make sure you can
trace how data is derived on a financial statement, and its
meaning.
· Due in Week Seven: In participating in the discussion and
reading the chapters in Week Seven, you select ratios that you
think are the most important. You use vertical, horizontal, or
ratio analyses to assess the financial health of McDonald’s
Corporation. Take notes from the discussions and the chapter
reading to prepare you to use the tools of analysis you will
employ in the final project. This is a great time to ask questions
about the ratios and analysis so that you understand the meaning
behind the numbers you calculate because this will be included
in your paper.
The Check Point in Week Seven requires that you perform
rudimentary vertical, horizontal and one of the ratio analyses on
McDonald’s Corporation, the company you will analyze in your
final project. You can use the ratios you develop here as the
basis for your financial analysis in the project in addition to
including the others that are required. You can select additional
data you would analyze. It is suggested that you begin the
analyses for the final project now.
· Suggested in Week Eight: Continue working through the
analyses you started in Week Seven and begin to finalize the
rest of the required ratios on solvency and profitability and the
second one for liquidity. Make sure you know where to get the
numbers for your ratios from the annual report and that you
understand what format the answers need to be shown.
· Due in Week Nine: Submit your final project. Submit one
Word file with the calculations included, keeping in mind that
the word count does NOT include the calculations.
Link to McDonald’s Corporation 2010 Annual Report
http://www.aboutmcdonalds.com/content/dam/AboutMcDonalds/
Investors/C-%5Cfakepath%5Cinvestors-2010-annual-report.pdf
You can also access by doing the following:
Go to www.mcdonalds.com
Go to Our Story, then to Corporate Information, then to
Investors, then to Annual Reports
Click on the link for the 2010 Annual Report
XACC 280
2010 Annual Report
McDonald’s Corporation
One McDonald’s Plaza
Oak Brook, IL 60523
www.aboutmcdonalds.com
2010 Highlights:
Global
Comparable Sales
Growth
5.0%
Earnings
Per Share
Growth
11%
Average Number of
Customers Served
Every Day
64 Million
Jim Skinner
Vice Chairman and CEO
3-Year Compound Annual Total Return
(2008–2010)
S&P 500
DJIA
12.7%MCD
-1.6%
-2.9%
Operating Income
(In billions)
$6.4
$6.8
$7.5
’08
’09
’10
To Our Valued Shareholders:
It’s been said the real secret to
success is sustaining it … and
that’s what McDonald’s did in 2010.
We began the year determined to build on our momentum
and strengthen our brand around the world. So with the
business environment still challenging — and with many
others forced to hold their ground — we pushed ahead.
We dug for deeper consumer insights, aligned our strate-
gies, and strengthened the pillars of our business, from our
menu and restaurants to our value and convenience.
The result was another banner year for McDonald’s. Global
comparable sales increased 5% in 2010 — our eighth
consecutive year of same store sales growth. Operating
income grew 9% and we continued to gain market share
around the world. In addition, we returned $5.1 billion to
shareholders through share repurchases and dividends
paid, and we provided a 27% return to investors for the
year, ranking us third among the companies comprising the
Dow Jones Industrial Average.
Our success remains global, with all areas of the world
contributing significantly to our results. In the U.S., comparable
sales increased 3.8%, while guest count growth reached
all-time highs. A record number of customers visited our
restaurants and drive-thrus across the U.S., even as overall
dining-out traffic remained flat. Europe grew comparable
sales by 4.4% and also increased guest counts — serving
200 million more customers than the year before. Asia/
Pacific, Middle East and Africa continued to make a strong
impact to our overall results with higher guest counts and
6% comparable sales growth.
We achieved all of this through our Plan to Win, which has
served as our strategic blueprint for the past eight years. The
plan focuses on the core drivers of our business — People,
Products, Place, Price, and Promotion, or the five “P’s.” I often
say the opportunity within each “P” is enormous — and we
intend to go after it. To that end, we continue to focus on the
right priorities to keep our brand relevant and meet the evolv-
ing needs of our customers. This approach has served us
remarkably well and will continue to do so in 2011 and beyond.
McDonald’s Corporation Annual Report 2010 1
Our results could not have been achieved without the
performance of our highly talented management team.
They are focused, aligned, and committed to raising the bar
in everything we do. President and Chief Operating Officer
Don Thompson and our senior leadership operate with
tremendous insight and a keen sense for how to drive
continued growth. In addition, our exceptional Board
of Directors provides strong corporate governance and
knowledgeable perspectives as we continue to deliver
shareholder value.
Meanwhile, the entire McDonald’s System is thriving.
Our world-class franchisees continue to invest in their
restaurants and their people in order to elevate the entire
customer experience, resulting in significant increases
in cash flow. Our suppliers perform what I like to call the
McDonald’s Daily Miracle — providing 32,000 restaurants an
assured supply of safe, high-quality products at competitive
prices, with ever improving efficiency. Lastly, our highly
experienced company employees worked smarter to propel
our business forward.
With the powerful alignment of our System and the Plan to
Win as the foundation, we will continue our winning formula:
building on the basics as we further modernize and differenti-
ate the brand.
As always, running better restaurants is our number one
priority. We will improve operations excellence around the
world through new technology, better training, and service
enhancements that will make it easier for our managers
and crew to quickly and accurately serve the customer.
At the same time, our brand is more contemporary and
convenient and provides great value with menus that feature
all of our iconic favorites — from our Big Mac sandwiches to
French fries — along with local offerings and new products
that today’s consumers want. Whether it’s McWraps in Europe,
Angus Burgers in Australia, or McCafé specialty coffees and
smoothies in the U.S., we are strategically enhancing our menu
to appeal to more customers more often.
92
Consecutive months
of global comparable
sales increases through
December 2010
2 McDonald’s Corporation Annual Report 2010
We are moving ahead with the reimaging of our restaurant
interiors and exteriors to create an even more modern
and inviting dining atmosphere. Around the world, we are
re-invigorating our restaurants with local and relevant new
designs that keep the spirit of our brand alive and delight
our guests with a fresh look and contemporary appeal.
Of course, we must continue to lead in ways that positively
impact the trust in our brand. It starts with delivering
a great restaurant experience every time and extends to
a host of areas to which we are strongly committed —
from charitable giving and supporting the communities
we serve, to environmental stewardship and animal welfare.
In addition, we provide our customers with a variety of menu
options that address balance and choice. We will keep
listening to our customers, engaging our stakeholders,
and embracing the responsibility that comes with being
a socially responsible brand.
As McDonald’s Chief Executive Officer, I am immensely proud
of our performance and confident in our ability to continue
our growth. The secret to our success is staying focused on
the execution in our restaurants on behalf of our customers.
As always, thank you for your investment in McDonald’s.
I appreciate your support and look forward to sharing further
success with you.
Sincerely,
Jim Skinner
Vice Chairman and CEO
McDonald’s Corporation Annual Report 2010 3
Combined Operating Margin
27.4%
30.1%
31.0%
’08
’09
’10
Earnings Per Share
$3.76
$4.11
$4.58
’08
’09
’10
Dividends Paid
(In billions)
$1.8
$2.2
$2.4
’08
’09
’10
Dear Fellow Shareholders:
McDonald’s Corporation
achieved another year of strong
results in 2010, as we continued
to strengthen our connection
with customers around the world.
We maintained our momentum and increased sales amid
a still challenging environment for many. Working within the
framework of our proven Plan to Win strategy, McDonald’s
showed flexibility, decisiveness, and strong business
acumen in meeting the evolving needs of consumers and
staying in step with their lives.
Your Board of Directors believes this is a testament to the
strength of the McDonald’s System, what we refer to as our
“three-legged stool.” Under the leadership of Vice Chairman
and CEO Jim Skinner, all three legs of the stool — franchisees,
suppliers and employees — continue to be firmly aligned behind
the Plan to Win. This stability has been key to sustaining
McDonald’s successful performance and to achieving an
impressive eight years of increasing global comparable sales.
Jim continues to lead our company with tremendous skill
and a deep passion for the brand. His global leadership team,
with its deep insights into the operation of our three-legged
stool, gives us a true competitive advantage in our efforts
to evolve and elevate the McDonald’s customer experience.
The Board of Directors is pleased with McDonald’s
performance and its plans moving forward. We believe
the company has a clear vision — and the right people and
strategies in place —for building our business even further
and delivering profitable growth into the future.
As to our Board responsibilities, we remain committed to
overseeing the company’s direction and promoting strong
corporate governance principles and effective management
oversight. Our team of experienced and diverse directors
is eager to continue doing its part to help strengthen
McDonald’s and deliver shareholder value.
It is our honor and privilege to serve on behalf of you,
our shareholders, and we look forward to the days ahead
for this great brand.
Very truly yours,
Andy McKenna
Chairman
Andy McKenna
Chairman
4 McDonald’s Corporation Annual Report 2010
2010 Financial Report
7 6-year Summary
8 Stock Performance Graph
9 Management’s Discussion and Analysis of Financial
Condition and Results of Operations
26 Consolidated Statement of Income
27 Consolidated Balance Sheet
28 Consolidated Statement of Cash Flows
29 Consolidated Statement of Shareholders’ Equity
30 Notes to Consolidated Financial Statements
42 Quarterly Results (Unaudited)
43 Management’s Assessment of Internal Control over
Financial Reporting
44 Report of Independent Registered Public Accounting Firm
45 Report of Independent Registered Public Accounting Firm
on Internal Control over Financial Reporting
46 Executive Management & Business Unit Officers
47 Board of Directors
48 Investor Information
6 McDonald’s Corporation Annual Report 2010
6-Year Summary
Dollars in millions, except per share data 2010 2009 2008 2007
2006 2005
Company-operated sales $16,233 15,459 16,561 16,611 15,402
14,018
Franchised revenues $ 7,842 7,286 6,961 6,176 5,493 5,099
Total revenues $24,075 22,745 23,522 22,787 20,895 19,117
Operating income $ 7,473(1) 6,841(2) 6,443 3,879(5) 4,433(8)
3,984
Income from continuing operations $ 4,946(1) 4,551(2,3)
4,313(4) 2,335(5,6) 2,866(8) 2,578(10)
Net income $ 4,946(1) 4,551(2,3) 4,313(4)
2,395(5,6,7)3,544(8,9) 2,602(10)
Cash provided by operations $ 6,342 5,751 5,917 4,876 4,341
4,337
Cash used for investing activities $ 2,056 1,655 1,625 1,150
1,274 1,818
Capital expenditures $ 2,136 1,952 2,136 1,947 1,742 1,607
Cash used for (provided by) financing activities $ 3,729 4,421
4,115 3,996 5,460 (442)
Treasury stock repurchased(11) $ 2,648 2,854 3,981 3,949 3,719
1,228
Common stock cash dividends $ 2,408 2,235 1,823 1,766 1,217
842
Financial position at year end:
Total assets $31,975 30,225 28,462 29,392 28,974 29,989
Total debt $11,505 10,578 10,218 9,301 8,408 10,137
Total shareholders’ equity $14,634 14,034 13,383 15,280
15,458 15,146
Shares outstanding in millions 1,054 1,077 1,115 1,165 1,204
1,263
Per common share:
Income from continuing operations–diluted $ 4.58(1) 4.11(2,3)
3.76(4) 1.93(5,6) 2.29(8) 2.02(10)
Net income–diluted $ 4.58(1) 4.11(2,3) 3.76(4) 1.98(5,6,7)
2.83(8,9) 2.04(10)
Dividends declared $ 2.26 2.05 1.63 1.50 1.00 0.67
Market price at year end $ 76.76 62.44 62.19 58.91 44.33 33.72
Company-operated restaurants 6,399 6,262 6,502 6,906 8,166
8,173
Franchised restaurants 26,338 26,216 25,465 24,471 22,880
22,593
Total Systemwide restaurants 32,737 32,478 31,967 31,377
31,046 30,766
Franchised sales(12) $61,147 56,928 54,132 46,943 41,380
38,913
(1) Includes net pretax expense due to Impairment and other
charges (credits), net of $29.1 million ($24.6 million after tax
or $0.02 per share) primarily related to the Company’s share of
restaurant closing costs in McDonald’s Japan (a 50%-owned
affiliate) partially offset by income primarily related to the
resolution of certain liabilities retained in connection with the
2007 Latin America developmental license transaction.
(2) Includes net pretax income due to Impairment and other
charges (credits), net of $61.1 million ($91.4 million after tax
or $0.08 per share) primarily related to the resolution of certain
liabilities retained in connection with the 2007 Latin America
developmental license transaction.
(3) Includes income of $58.8 million ($0.05 per share) in Gain
on sale of investment related to the sale of the Company’s
minority ownership interest in Redbox Automated Retail, LLC.
(4) Includes income of $109.0 million ($0.09 per share) in Gain
on sale of investment from the sale of the Company’s minority
ownership interest in U.K.-based Pret A Manger.
(5) Includes pretax operating charges of $1.7 billion ($1.32 per
share) due to Impairment and other charges (credits), net
primarily as a result of the Company’s sale of its businesses in
18
Latin American and Caribbean markets to a developmental
licensee.
(6) Includes a tax benefit of $316.4 million ($0.26 per share)
resulting from the completion of an Internal Revenue Service
(IRS) examination of the Company’s 2003-2004 U.S. federal
tax returns.
(7) Includes income of $60.1 million ($0.05 per share) related
to discontinued operations primarily from the sale of the
Company’s investment in Boston Market.
(8) Includes pretax operating charges of $134 million ($98
million after tax or $0.08 per share) due to Impairment and
other charges (credits), net.
(9) Includes income of $678 million ($0.54 per share) related to
discontinued operations primarily resulting from the disposal of
the Company’s investment in Chipotle.
(10) Includes a net tax benefit of $73 million ($0.05 per share)
comprised of $179 million ($0.14 per share) of income tax
benefit resulting from the completion of an IRS examination of
the
Company’s 2000-2002 U.S. tax returns, partly offset by $106
million ($0.09 per share) of incremental tax expense resulting
from the decision to repatriate certain foreign earnings
under the Homeland Investment Act (HIA).
(11) Represents treasury stock purchases as reflected in
Shareholders’ equity.
(12) While franchised sales are not recorded as revenues by the
Company, management believes they are important in
understanding the Company’s financial performance because
these
sales are the basis on which the Company calculates and records
franchised revenues and are indicative of the financial health of
the franchisee base.
McDonald’s Corporation Annual Report 2010 7
Stock performance graph
At least annually, we consider which companies comprise a
read-
ily identifiable investment peer group. McDonald’s is included
in
published restaurant indices; however, unlike most other compa-
nies included in these indices, which have no or limited
international operations, McDonald’s does business in more
than
100 countries and a substantial portion of our revenues and
income is generated outside the U.S. In addition, because of our
size, McDonald’s inclusion in those indices tends to skew the
results. Therefore, we believe that such a comparison is not
meaningful.
Our market capitalization, trading volume and importance in an
industry that is vital to the U.S. economy have resulted in
McDo-
nald’s inclusion in the Dow Jones Industrial Average (DJIA)
since
1985. Like McDonald’s, many DJIA companies generate mean-
ingful revenues and income outside the U.S. and some manage
global brands. Thus, we believe that the use of the DJIA compa-
nies as the group for comparison purposes is appropriate.
The following performance graph shows McDonald’s
cumulative
total shareholder returns (i.e., price appreciation and
reinvestment
of dividends) relative to the Standard & Poor’s 500 Stock Index
(S&P 500 Index) and to the DJIA companies for the five-year
period ended December 31, 2010. The graph assumes that the
value of an investment in McDonald’s common stock, the S&P
500 Index and the DJIA companies (including McDonald’s) was
$100 at December 31, 2005. For the DJIA companies, returns
are weighted for market capitalization as of the beginning of
each period indicated. These returns may vary from those of the
Dow Jones Industrial Average Index, which is not weighted by
market capitalization, and may be composed of different compa-
nies during the period under consideration.
COMPARISON OF CUMULATIVE FIVE YEAR TOTAL
RETURN
Dec '05 '06 '07 '08 '10'09
McDonald's Corporation
S&P 500 Index
Dow Jones Industrials
$0
$50
$100
$150
$200
$300
$250
100 135 183 199 207 263
100 116 122 77 97 112
100 119 130 88 108 123
Source: Capital IQ, a Standard & Poor’s business
8 McDonald’s Corporation Annual Report 2010
Management’s Discussion and Analysis of
Financial Condition and Results of Operations
Overview
DESCRIPTION OF THE BUSINESS
The Company franchises and operates McDonald’s restaurants.
Of the 32,737 restaurants in 117 countries at year-end 2010,
26,338 were franchised or licensed (including 19,279 franchised
to conventional franchisees, 3,485 licensed to developmental
licensees and 3,574 licensed to foreign affiliates (affiliates)—
primarily Japan) and 6,399 were operated by the Company.
Under our conventional franchise arrangement, franchisees pro-
vide a portion of the capital required by initially investing in
the
equipment, signs, seating and décor of their restaurant busi-
nesses, and by reinvesting in the business over time. The
Company owns the land and building or secures long-term
leases
for both Company-operated and conventional franchised restau-
rant sites. This maintains long-term occupancy rights, helps
control related costs and assists in alignment with franchisees.
In
certain circumstances, the Company participates in reinvestment
for conventional franchised restaurants. Under our
developmental
license arrangement, licensees provide capital for the entire
business, including the real estate interest, and the Company has
no capital invested. In addition, the Company has an equity
investment in a limited number of affiliates that invest in real
estate and operate and/or franchise restaurants within a market.
We view ourselves primarily as a franchisor and believe fran-
chising is important to delivering great, locally-relevant
customer
experiences and driving profitability. However, directly
operating
restaurants is paramount to being a credible franchisor and is
essential to providing Company personnel with restaurant oper-
ations experience. In our Company-operated restaurants, and in
collaboration with franchisees, we further develop and refine
operating standards, marketing concepts and product and pricing
strategies, so that only those that we believe are most beneficial
are introduced in the restaurants. We continually review, and as
appropriate adjust, our mix of Company-operated and franchised
(conventional franchised, developmental licensed and foreign
affiliated) restaurants to help optimize overall performance.
The Company’s revenues consist of sales by Company-
operated restaurants and fees from restaurants operated by
franchisees. Revenues from conventional franchised restaurants
include rent and royalties based on a percent of sales along with
minimum rent payments, and initial fees. Revenues from restau-
rants licensed to affiliates and developmental licensees include
a
royalty based on a percent of sales, and generally include initial
fees. Fees vary by type of site, amount of Company investment,
if
any, and local business conditions. These fees, along with occu-
pancy and operating rights, are stipulated in franchise/license
agreements that generally have 20-year terms.
The business is managed as distinct geographic segments.
Significant reportable segments include the United States
(U.S.),
Europe, and Asia/Pacific, Middle East and Africa (APMEA). In
addition, throughout this report we present “Other Countries &
Corporate” that includes operations in Canada and Latin
America,
as well as Corporate activities. The U.S., Europe and APMEA
segments account for 34%, 40% and 21% of total revenues,
respectively. The United Kingdom (U.K.), France and Germany,
collectively, account for over 50% of Europe’s revenues; and
China, Australia and Japan (a 50%-owned affiliate accounted
for
under the equity method), collectively, account for over 50% of
APMEA’s revenues. These six markets along with the U.S. and
Canada are referred to as “major markets” throughout this
report
and comprise approximately 70% of total revenues.
The Company continues to focus its management and finan-
cial resources on the McDonald’s restaurant business as we
believe significant opportunities remain for long-term growth.
Accordingly, in 2009, the Company sold its minority ownership
interest in Redbox Automated Retail, LLC (Redbox) for total
consideration of $140 million. In 2008, the Company sold its
minority ownership interest in U.K.-based Pret A Manger for
cash
proceeds of $229 million. In connection with both sales, the
Company recognized nonoperating gains.
In analyzing business trends, management considers a variety
of performance and financial measures, including comparable
sales and comparable guest count growth, Systemwide sales
growth and returns.
• Constant currency results exclude the effects of foreign cur-
rency translation and are calculated by translating current year
results at prior year average exchange rates. Management
reviews and analyzes business results in constant currencies
and bases certain incentive compensation plans on these
results because we believe this better represents the Compa-
ny’s underlying business trends.
• Comparable sales and comparable guest counts are key per-
formance indicators used within the retail industry and are
indicative of acceptance of the Company’s initiatives as well as
local economic and consumer trends. Increases or decreases
in comparable sales and comparable guest counts represent
the percent change in sales and transactions, respectively,
from the same period in the prior year for all restaurants in
operation at least thirteen months, including those temporarily
closed. Some of the reasons restaurants may be temporarily
closed include reimaging or remodeling, rebuilding, road con-
struction and natural disasters. Comparable sales exclude the
impact of currency translation. McDonald’s reports on a calen-
dar basis and therefore the comparability of the same month,
quarter and year with the corresponding period of the prior
year will be impacted by the mix of days. The number of week-
days and weekend days in a given timeframe can have a
positive or negative impact on comparable sales and guest
counts. The Company refers to these impacts as calendar
shift/trading day adjustments. In addition, the timing of
holidays
can impact comparable sales and guest counts. These impacts
vary geographically due to consumer spending patterns and
have the greatest effect on monthly comparable sales and
guest counts while the annual impacts are typically minimal. In
2008, there was an incremental full day of sales and guest
counts due to leap year.
• Systemwide sales include sales at all restaurants, whether
operated by the Company or by franchisees. While franchised
sales are not recorded as revenues by the Company, manage-
ment believes the information is important in understanding the
Company’s financial performance because these sales are the
basis on which the Company calculates and records franchised
revenues and are indicative of the financial health of the fran-
chisee base.
McDonald’s Corporation Annual Report 2010 9
• Return on incremental invested capital (ROIIC) is a measure
reviewed by management over one-year and three-year time
periods to evaluate the overall profitability of the business
units, the effectiveness of capital deployed and the future allo-
cation of capital. The return is calculated by dividing the
change in operating income plus depreciation and amortization
(numerator) by the adjusted cash used for investing activities
(denominator), primarily capital expenditures. The calculation
uses a constant average foreign exchange rate over the peri-
ods included in the calculation.
STRATEGIC DIRECTION AND FINANCIAL PERFORMANCE
The strength of the alignment among the Company, its franchi-
sees and suppliers (collectively referred to as the System) has
been key to McDonald’s success. This business model enables
McDonald’s to deliver consistent, locally-relevant restaurant
experiences to customers and be an integral part of the commun-
ities we serve. In addition, it facilitates our ability to identify,
implement and scale innovative ideas that meet customers’
changing needs and preferences.
McDonald’s customer-focused Plan to Win—which concen-
trates on being better, not just bigger—provides a common
framework for our global business yet allows for local
adaptation.
Through the execution of initiatives surrounding the five
elements
of our Plan to Win—People, Products, Place, Price and Promo-
tion—we have enhanced the restaurant experience for customers
worldwide and grown comparable sales and customer visits in
each of the last seven years. This Plan, combined with financial
discipline, has delivered strong results for our shareholders.
We have exceeded our long-term, constant currency financial
targets of average annual Systemwide sales growth of 3% to
5%; average annual operating income growth of 6% to 7%; and
annual returns on incremental invested capital in the high teens
every year since the Plan’s implementation in 2003, after
adjust-
ing for the loss in 2007 from the Latin America developmental
license transaction. Given the size and scope of our global busi-
ness, we believe these financial targets are realistic and
sustainable over time, keeping us focused on making the best
decisions for the long-term benefit of our System.
In 2010, we continued to enhance the customer experience
by remaining focused on the Company’s key global success fac-
tors of branded affordability, menu variety and beverage choice,
convenience including daypart expansion, ongoing restaurant
reinvestment and operations excellence. Initiatives around these
factors successfully resonated with consumers driving increases
in sales and customer visits despite challenging economies and
a
contracting Informal Eating Out (IEO) market in many
countries.
As a result, every area of the world contributed to 2010 global
comparable sales and guest counts, which increased 5.0% and
4.9%, respectively.
Growth in comparable sales is driven by the System’s ability
to optimize guest count growth, product mix shifts and menu
price changes. Pricing actions reflect local market conditions,
with a view to preserving and improving margins, while
continuing
to drive guest counts and market share gains. In general, the
goal
is to achieve a balanced contribution of price and guest counts
to
comparable sales growth.
In the U.S., we grew sales, guest counts, market share and
restaurant cash flow, with comparable sales increasing for the
8th consecutive year, rising 3.8% in 2010. These positive
results
were achieved despite a declining IEO market. This
performance
was attributed to several factors including core menu items like
Chicken McNuggets and burgers, everyday affordability and
value options, such as the Breakfast Dollar Menu, additions to
the
McCafé beverage line, new snack offerings and limited time
offerings such as the McRib sandwich. The national launch of
McCafé frappés and real-fruit smoothies provided a meaningful
extension to the McCafé line that was well-received by custom-
ers. Extending the snack wrap line with the Angus Snack Wraps
allowed customers to enjoy popular McDonald’s burgers in a
smaller, more portable fashion. Complementing these menu
offerings were our convenient locations, efficient drive-thru
serv-
ice and value-oriented local beverage promotions. We
broadened
our accessibility through greater 24 hour operations and offered
customers free Wi-Fi in over 12,000 restaurants. Modernizing
the
customer experience remained a focus with the extension of our
interior and exterior reimaging program to enhance the appear-
ance and functionality of our restaurants.
In Europe, comparable sales rose 4.4%, marking the 7th
consecutive year of comparable sales increases. Major contrib-
utors were France, the U.K., Russia and Germany. This
performance reflected Europe’s strategic priorities of upgrading
the customer and employee experience, increasing local rele-
vance, and building brand transparency. Initiatives surrounding
these platforms included leveraging our tiered menu featuring
everyday affordable prices, menu variety including limited-time
offerings, new dessert options, and reimaging almost 1,000 res-
taurants. We expanded our coffee business and have nearly
1,300 McCafé locations, which in Europe generally represent a
separate area inside the restaurant that serves specialty coffees,
indulgent desserts and light snacks. The expansion of self-order
kiosks in France, Germany and Spain and the roll out of the new
drive-thru customer order display system in over 3,000 restau-
rants enhanced service. In addition, we increased our
accessibility
and convenience with extended hours. We built upon the
momentum of portable menu offerings with the introduction of
McWraps—larger sized beef and chicken wraps in Germany,
and
P’tit Plaisir offerings in France. Finally, we continued building
customer trust in our brand through communications that
emphasized the quality and origin of McDonald’s food and our
sustainable business initiatives.
In APMEA, our momentum continued with nearly every coun-
try delivering positive comparable sales, led by Japan, Australia
and China. Comparable sales rose 6.0% through strategies
emphasizing value, core menu extensions, breakfast and con-
venience. Australia launched Family Dinner Boxes featuring
popular menu items bundled together at a discounted price
while
China and Japan concentrated on affordability with Value Lunch
platforms. New menu items such as a third Angus burger option
in Australia and the extension of the Spicy Wings line in China
were popular with consumers. Japan executed a successful
U.S.-themed burger promotion and a Chicken Festival
promotion
featuring several products. Our dessert strategy is introducing
consumers to the McDonald’s brand with products such as
McFlurries and dessert kiosks in China, where we have become
one of the largest retailers of ice cream. Our breakfast business
continues to develop and is now offered in approximately 75%
of
APMEA restaurants. In Japan, value breakfast items, including
the Sausage McMuffin and McGriddle, were rotated across sev-
eral months, while Australia launched new breakfast menu
items.
10 McDonald’s Corporation Annual Report 2010
Nearly two-thirds of APMEA restaurants are now offering some
form of extended hours and over 4,800 restaurants are open 24
hours. Delivery is offered in many APMEA markets and is now
in
approximately 1,600 restaurants, including nearly 400 in China.
We continue to offer value to our customers by utilizing a stra-
tegic menu pricing tool that optimizes price, product mix, and
promotions. This approach is complemented by a focus on
driving
operating efficiencies and effectively managing restaurant-level
food and paper costs by leveraging our scale, supply chain
infra-
structure and risk management practices. Our ability to execute
our strategies successfully in every area of the world, grow
comparable sales, leverage a low commodity cost environment
and control selling, general & administrative expenses resulted
in
consolidated combined operating margin (operating income as a
percent of total revenues) of 31.0% in 2010, an improvement of
0.9 percentage points over 2009.
In 2010, strong global sales and margin performance grew
cash from operations, which rose $591 million to $6.3 billion.
Our
substantial cash flow, strong credit rating and continued access
to credit provide us significant flexibility to fund capital
expenditures and debt repayments as well as return cash to
shareholders. Capital expenditures of approximately $2.1 billion
were invested in our business primarily to open and reimage
restaurants. Across the System, nearly 1,000 restaurants were
opened and nearly 1,800 existing locations were reimaged. We
returned $5.1 billion to shareholders consisting of $2.4 billion
in
dividends and nearly $2.7 billion in share repurchases.
Cash from operations continues to benefit from our heavily
franchised business model as the rent and royalty income
received from owner/operators provides a very stable revenue
stream that has relatively low costs. In addition, the franchise
business model is less capital intensive than the Company-
owned model. We believe locally-owned and operated
restaurants maximize brand performance and are at the core of
our competitive advantage, making McDonald’s not just a
global
brand, but also a locally relevant one.
HIGHLIGHTS FROM THE YEAR INCLUDED:
• Comparable sales grew 5.0% and guest counts rose 4.9%,
building on 2009 increases of 3.8% and 1.4%, respectively.
• Revenues increased 6% (5% in constant currencies).
• Company-operated margins improved to 19.6% and franchised
margins improved to 82.4%.
• Operating income increased 9% (9% in constant currencies).
• Earnings per share was $4.58, an increase of 11%.
• Cash provided by operations increased $591 million to $6.3
billion.
• The Company increased the quarterly cash dividend per share
11% to $0.61 for the fourth quarter–bringing our current
annual dividend rate to $2.44 per share.
• One-year ROIIC was 37.3% and three-year ROIIC was 38.3%
for the period ended December 31, 2010 (see reconciliation
on Page 25).
• The Company returned $5.1 billion to shareholders through
share repurchases and dividends paid.
OUTLOOK FOR 2011
We will continue to drive success in 2011 and beyond by
enhanc-
ing customer relevance across all elements of our Plan to Win—
People, Products, Place, Price and Promotion. Our global
System
continues to be energized by our ongoing momentum and sig-
nificant growth opportunities.
We continue to hold a strong competitive position in the
market place, and we intend to further differentiate our brand by
striving to become our customers’ favorite place and way to eat
and drink. We will continue growing market share by executing
our key strategies in the following areas: optimizing our menu,
modernizing the customer experience and broadening our
accessibility. These efforts will include increasing menu choice,
expanding destination beverages and desserts, enhancing our
food image, accelerating our interior and exterior reimaging
efforts and increasing the level and variety of conveniences pro-
vided to our customers. We will execute these priorities to
increase McDonald’s brand relevance while continuing to prac-
tice operational and financial discipline. Consequently, we are
confident we can again meet or exceed our long-term constant
currency financial targets.
In the U.S., our 2011 focus will include highlighting core
menu classics such as the Big Mac, Quarter Pounder with
Cheese and Chicken McNuggets, emphasizing the convenient
and affordable food offered every day, and encouraging the trial
of new products including Fruit & Maple Oatmeal and
additional
McCafé beverage offerings. We will continue offering value
across the menu through the Dollar Menu at breakfast and the
rest of the day. Opportunities around additional staffing at peak
hours and increasing restaurants that operate 24 hours per day
will broaden accessibility to our customers. In addition, our
plans
to elevate the brand experience encompass updating our
technology infrastructure with a new point-of-sale (POS)
system,
enhancing restaurant manager and crew retention and pro-
ductivity, and contemporizing the interiors and exteriors of
approximately 600 restaurants through reimaging.
Our business in Europe will continue to be guided by three
strategic priorities: increasing local relevance, upgrading the
customer and employee experience, and building brand trans-
parency. We will increase our local relevance by
complementing
our tiered menu with a variety of limited-time food events as
well
as new snack and dessert options. In 2011, we will reimage
approximately 850 restaurants as we progress towards our goal
of having 90% of our interiors and over 50% of our exteriors
reimaged by the end of 2012. Reimaging reinforces the quality
of
our brand while further differentiating us from the competition.
We will leverage service innovations with the deployment of
technologies such as the new POS system, self-order kiosks,
hand-held order devices and drive-thru customer order displays
to enhance the customer experience and help drive increased
transactions and labor efficiency. We believe there is an oppor-
tunity to further build brand transparency by raising customer
awareness about our food quality and product sourcing. In addi-
tion, we will communicate our efforts to preserve the
environment
through our sustainable business initiatives. Our European busi-
ness in 2011 faces some headwinds from government-initiated
austerity measures being implemented in many countries. While
we will closely monitor consumer reactions to these measures,
we remain confident that our business model will continue to
drive profitable growth.
In APMEA, we will continue our efforts to become our
customers’ first choice for eating out by focusing on menu
varie-
ty, value, restaurant experience and convenience. The markets
will continue to execute against a combination of core menu
McDonald’s Corporation Annual Report 2010 11
items, food events and limited-time offerings to present a bal-
anced mix of products to our customers. Value will continue to
be
a key growth driver as we reinforce the affordability of our
menu
to consumers and build on our successful Value Lunch
platforms.
We will invest in our business primarily by opening over 600
new
restaurants and reimaging over 500 existing restaurants while
elevating our focus on service and operations to drive efficien-
cies. In China, we will continue to build a foundation for long-
term
growth by increasing our base of restaurants by approximately
15% in 2011 toward our goal of nearly 2,000 restaurants by the
end of 2013. Convenience initiatives include expanding delivery
service across the region and building on the success of our
extended operating hours.
McDonald’s has an ongoing commitment to optimize our res-
taurant ownership structure. A heavily franchised, less capital-
intensive business model has favorable implications for the
strength and stability of our cash flow, the amount of capital we
invest and long-term returns.
We continue to maintain a strong culture of financial dis-
cipline by effectively managing all spending in order to
maximize
business performance. In making capital allocation decisions,
our
goal is to elevate the McDonald’s experience by driving sustain-
able growth in sales and market share while earning strong
returns. We remain committed to returning all of our free cash
flow (cash from operations less capital expenditures) to share-
holders over the long term via dividends and share repurchases.
McDonald’s does not provide specific guidance on diluted
earnings per share. The following information is provided to
assist
in analyzing the Company’s results:
• Changes in Systemwide sales are driven by comparable sales
and net restaurant unit expansion. The Company expects net
restaurant additions to add approximately 1.5 percentage
points to 2011 Systemwide sales growth (in constant
currencies), most of which will be due to the 541 net traditional
restaurants added in 2010.
• The Company does not generally provide specific guidance on
changes in comparable sales. However, as a perspective,
assuming no change in cost structure, a 1 percentage point
increase in comparable sales for either the U.S. or Europe
would increase annual diluted earnings per share by about
3 cents.
• With about 75% of McDonald’s grocery bill comprised of 10
different commodities, a basket of goods approach is the most
comprehensive way to look at the Company’s commodity costs.
For the full year 2011, the total basket of goods cost is
expected to increase 2-2.5% in the U.S. and to increase
3.5-4.5% in Europe as compared to 2010. Some volatility may
be experienced between quarters in the normal course of
business.
• The Company expects full-year 2011 selling, general &
admin-
istrative expenses to decrease 2-3%, in constant currencies,
partly due to higher incentive compensation in 2010 based on
performance. In addition, fluctuations will be experienced
between quarters due to certain items in 2010, such as the
Vancouver Winter Olympics in February and the biennial
Worldwide Owner/Operator Convention in April.
• Based on current interest and foreign currency exchange rates,
the Company expects interest expense for the full year 2011
to increase approximately 7% compared with 2010.
• A significant part of the Company’s operating income is gen-
erated outside the U.S., and about 40% of its total debt is
denominated in foreign currencies. Accordingly, earnings are
affected by changes in foreign currency exchange rates,
particularly the Euro, Australian Dollar, British Pound and
Canadian Dollar. Collectively, these currencies represent
approximately 65% of the Company’s operating income out-
side the U.S. If all four of these currencies moved by 10% in
the same direction, the Company’s annual diluted earnings per
share would change by about 20 cents.
• The Company expects the effective income tax rate for the full
year 2011 to be approximately 30% to 32%. Some volatility
may be experienced between the quarters resulting in a quar-
terly tax rate that is outside the annual range.
• The Company expects capital expenditures for 2011 to be
approximately $2.5 billion. About half of this amount will be
used to open new restaurants. The Company expects to open
about 1,100 restaurants including about 400 restaurants in
affiliated and developmental licensee markets, such as Japan
and Latin America, where the Company does not fund any
capital expenditures. The Company expects net additions of
about 750 traditional restaurants. The remaining capital will be
used for reinvestment in existing restaurants. Over half of this
reinvestment will be used to reimage approximately 2,200
locations worldwide, some of which will require no capital
investment from the Company.
12 McDonald’s Corporation Annual Report 2010
Consolidated Operating Results
Operating results
2010 2009 2008
Dollars in millions, except per share data Amount
Increase/
(decrease) Amount
Increase/
(decrease) Amount
Revenues
Sales by Company-operated restaurants $ 16,233 5% $ 15,459
(7)% $ 16,561
Revenues from franchised restaurants 7,842 8 7,286 5 6,961
Total revenues 24,075 6 22,745 (3) 23,522
Operating costs and expenses
Company-operated restaurant expenses 13,060 3 12,651 (7)
13,653
Franchised restaurants—occupancy expenses 1,378 6 1,302 6
1,230
Selling, general & administrative expenses 2,333 4 2,234 (5)
2,355
Impairment and other charges (credits), net 29 nm (61) nm 6
Other operating (income) expense, net (198) 11 (222) (35) (165)
Total operating costs and expenses 16,602 4 15,904 (7) 17,079
Operating income 7,473 9 6,841 6 6,443
Interest expense 451 (5) 473 (9) 523
Nonoperating (income) expense, net 22 nm (24) 69 (78)
Gain on sale of investment nm (95) 41 (160)
Income before provision for income taxes 7,000 8 6,487 5 6,158
Provision for income taxes 2,054 6 1,936 5 1,845
Net income $ 4,946 9% $ 4,551 6% $ 4,313
Earnings per common share—diluted $ 4.58 11% $ 4.11 9% $
3.76
Weighted-average common shares outstanding—diluted 1,080.3
1,107.4 1,146.0
nm Not meaningful.
IMPACT OF FOREIGN CURRENCY TRANSLATION ON
REPORTED
RESULTS
While changing foreign currencies affect reported results,
McDo-
nald’s mitigates exposures, where practical, by financing in
local
currencies, hedging certain foreign-denominated cash flows, and
purchasing goods and services in local currencies.
In 2010, foreign currency translation had a positive impact on
consolidated operating results driven by stronger global curren-
cies, primarily the Australian Dollar and Canadian Dollar,
partly
offset by the weaker Euro. In 2009, foreign currency translation
had a negative impact on consolidated operating results,
primarily
driven by the Euro, British Pound, Russian Ruble, Australian
Dol-
lar and Canadian Dollar. In 2008, foreign currency translation
had
a positive impact on consolidated operating results, driven by
the
stronger Euro and most other currencies, partly offset by the
weaker British Pound.
Impact of foreign currency translation on reported results
Reported amount Currency translation benefit/(cost)
In millions, except per share data 2010 2009 2008 2010 2009
2008
Revenues $24,075 $22,745 $23,522 $ 188 $(1,340) $ 441
Company-operated margins 3,173 2,807 2,908 35 (178) 63
Franchised margins 6,464 5,985 5,731 (14) (176) 120
Selling, general & administrative expenses 2,333 2,234 2,355
(12) 75 (21)
Operating income 7,473 6,841 6,443 13 (273) 163
Net income 4,946 4,551 4,313 13 (164) 103
Earnings per common share—diluted 4.58 4.11 3.76 0.01 (0.15)
0.09
NET INCOME AND DILUTED EARNINGS PER COMMON
SHARE
In 2010, net income and diluted earnings per common share
were $4.9 billion and $4.58. Results for the year included after
tax charges due to Impairment and other charges (credits), net
of
$25 million or $0.02 per share, primarily related to the Compa-
ny’s share of restaurant closing costs in McDonald’s Japan (a
50%-owned affiliate) in conjunction with the first quarter
strate-
gic review of the market’s restaurant portfolio, partly offset by
income related to the resolution of certain liabilities retained in
connection with the 2007 Latin America developmental license
transaction. Foreign currency translation had a positive impact
of
$0.01 per share on diluted earnings per share for the year.
In 2009, net income and diluted earnings per common share
were $4.6 billion and $4.11. Results benefited by after tax
income due to Impairment and other charges (credits), net of
$91 million or $0.08 per share, primarily due to the resolution
of
McDonald’s Corporation Annual Report 2010 13
certain liabilities retained in connection with the 2007 Latin
America developmental license transaction. Results also bene-
fited by an after tax gain of $59 million or $0.05 per share due
to
the sale of the Company’s minority ownership interest in
Redbox,
reflected in Gain on sale of investment. Results were negatively
impacted by $0.15 per share due to the effect of foreign cur-
rency translation.
In 2008, net income and diluted earnings per common share
were $4.3 billion and $3.76. Results benefited by a $109 million
or $0.09 per share after tax gain on the sale of the Company’s
minority ownership interest in Pret A Manger, reflected in Gain
on
sale of investment.
The Company repurchased 37.8 million shares of its stock for
nearly $2.7 billion in 2010 and 50.3 million shares of its stock
for
$2.9 billion in 2009, driving reductions of over 2% and 3% of
total shares outstanding, respectively, net of stock option
exercises.
REVENUES
The Company’s revenues consist of sales by Company-operated
restaurants and fees from restaurants operated by franchisees.
Revenues from conventional franchised restaurants include rent
and royalties based on a percent of sales along with minimum
rent payments, and initial fees. Revenues from franchised
restau-
rants that are licensed to affiliates and developmental licensees
include a royalty based on a percent of sales, and generally
include initial fees.
Over the past three years, the Company has continued to
optimize its restaurant ownership mix, cash flow and returns
through its refranchising strategy. The shift to a greater percent-
age of franchised restaurants negatively impacted consolidated
revenues as Company-operated sales shifted to franchised sales,
where the Company receives rent and/or royalties based on a
percent of sales.
In 2010, constant currency revenue growth was driven by
positive comparable sales. The impact of refranchising on con-
solidated revenues lessened because the number of Company-
operated restaurants sold to franchisees has declined compared
with 2009 and 2008, in line with our overall strategy. In 2009,
constant currency revenue growth was driven by positive com-
parable sales and expansion, partly offset by the impact of
refranchising in certain of the Company’s major markets.
Revenues
Amount Increase/(decrease)
Increase/(decrease)
excluding currency
translation
Dollars in millions 2010 2009 2008 2010 2009 2010 2009
Company-operated sales:
U.S. $ 4,229 $ 4,295 $ 4,636 (2)% (7)% (2)% (7)%
Europe 6,932 6,721 7,424 3 (9) 5 3
APMEA 4,297 3,714 3,660 16 1 9 5
Other Countries & Corporate 775 729 841 6 (13) (3) (7)
Total $16,233 $15,459 $16,561 5% (7)% 4% 0%
Franchised revenues:
U.S. $ 3,883 $ 3,649 $ 3,442 6% 6% 6% 6%
Europe 2,637 2,553 2,499 3 2 8 10
APMEA 769 623 571 23 9 11 12
Other Countries & Corporate 553 461 449 20 3 16 9
Total $ 7,842 $ 7,286 $ 6,961 8% 5% 8% 8%
Total revenues:
U.S. $ 8,112 $ 7,944 $ 8,078 2% (2)% 2% (2)%
Europe 9,569 9,274 9,923 3 (7) 6 5
APMEA 5,066 4,337 4,231 17 3 9 6
Other Countries & Corporate 1,328 1,190 1,290 12 (8) 4 (2)
Total $24,075 $22,745 $23,522 6% (3)% 5% 2%
In the U.S., revenues in 2010 and 2009 were positively
impacted by the ongoing appeal of our iconic core products and
the success of new products, as well as continued focus on
everyday value and convenience. New products introduced in
2010 included McCafé frappés and smoothies as well as the
Angus Snack Wraps, while new products introduced in 2009
included McCafé premium coffees and the Angus Third
Pounder.
Refranchising activity negatively impacted revenue growth in
both
years.
Europe’s constant currency increases in revenues in 2010
and 2009 were primarily driven by comparable sales increases
in
the U.K., France and Russia (which is entirely Company-
operated) as well as expansion in Russia. These increases were
partly offset by the impact of refranchising activity, primarily
in the
U.K. in 2010 and the U.K. and Germany in 2009.
In APMEA, the constant currency increase in revenues in
2010 was primarily driven by comparable sales increases in
China, Australia and most other markets. The 2009 increase was
primarily driven by comparable sales increases in Australia and
most other Asian markets, partly offset by negative comparable
sales in China. In addition, expansion in China contributed to
the
increases in both years.
14 McDonald’s Corporation Annual Report 2010
The following tables present comparable sales and Systemwide
sales increases/(decreases):
Comparable sales increases
2010 2009 2008
U.S. 3.8% 2.6% 4.0%
Europe 4.4 5.2 8.5
APMEA 6.0 3.4 9.0
Other Countries & Corporate 11.3 5.5 13.0
Total 5.0% 3.8% 6.9%
On a consolidated basis, comparable guest counts increased
4.9%, 1.4% and 3.1% in 2010, 2009 and 2008, respectively.
Systemwide sales increases/(decreases)
Excluding currency
translation
2010 2009 2010 2009
U.S. 4% 3% 4% 3%
Europe 3 (2) 7 7
APMEA 15 8 7 7
Other Countries &
Corporate 13 13 7
Total 7% 2% 6% 6%
Franchised sales are not recorded as revenues by the Company,
but are the basis on which the Company calculates and records
franchised revenues and are indicative of the health of the
franchisee base. The following table presents Franchised sales
and the
related increases:
Franchised Sales
Amount Increase
Increase excluding
currency translation
Dollars in millions 2010 2009 2008 2010 2009 2010 2009
U.S. $28,166 $26,737 $25,351 5% 5% 5% 5%
Europe 15,049 14,573 14,282 3 2 8 10
APMEA 11,373 9,871 8,895 15 11 7 8
Other Countries & Corporate 6,559 5,747 5,604 14 3 15 9
Total $61,147 $56,928 $54,132 7% 5% 7% 7%
RESTAURANT MARGINS
• Franchised margins
Franchised margin dollars represent revenues from franchised
restaurants less the Company’s occupancy costs (rent and
depreciation) associated with those sites. Franchised margin
dollars represented about two-thirds of the combined restaurant
margins in 2010, 2009 and 2008. Franchised margin dollars
increased $479 million or 8% (8% in constant currencies) in
2010 and $254 million or 4% (7% in constant currencies) in
2009. Positive comparable sales were the primary driver of the
constant currency growth in franchise margin dollars in both
years. Refranchising activity also contributed to the constant
currency growth in franchise margin dollars in 2009 and to a
lesser extent in 2010.
Franchised margins
In millions 2010 2009 2008
U.S. $3,239 $3,031 $2,867
Europe 2,063 1,998 1,965
APMEA 686 559 511
Other Countries & Corporate 476 397 388
Total $6,464 $5,985 $5,731
Percent of revenues
U.S. 83.4% 83.1% 83.3%
Europe 78.2 78.3 78.6
APMEA 89.3 89.6 89.6
Other Countries & Corporate 86.0 86.1 86.4
Total 82.4% 82.1% 82.3%
In the U.S., the franchised margin percent increase in 2010
was primarily due to positive comparable sales. The 2009
decrease was due to additional depreciation primarily related to
the Company’s investment in the beverage initiative, partly
offset
by positive comparable sales.
Europe’s franchised margin percent decreased in 2010 and
2009 as positive comparable sales were more than offset by
higher occupancy expenses, the cost of strategic brand and sales
building initiatives and the refranchising strategy.
In APMEA, the franchised margin percent decrease in 2010
was primarily driven by foreign currency translation, mostly
due to
the stronger Australian dollar.
The franchised margin percent in APMEA and Other Coun-
tries & Corporate is higher relative to the U.S. and Europe due
to
a larger proportion of developmental licensed and/or affiliated
restaurants where the Company receives royalty income with no
corresponding occupancy costs.
• Company-operated margins
Company-operated margin dollars represent sales by Company-
operated restaurants less the operating costs of these
restaurants. Company-operated margin dollars increased $366
million or 13% (12% in constant currencies) in 2010 and
decreased $101 million or 3% (increased 3% in constant
currencies) in 2009. Positive comparable sales and lower com-
modity costs were the primary drivers of the constant currency
growth in Company-operated margin dollars and percent in
2010. Positive comparable sales, partly offset by higher
commod-
ity costs, drove growth in constant currency Company-operated
margin dollars and percent in 2009. In addition, refranchising
activity negatively impacted Company-operated margin dollars,
but benefited Company-operated margin percent in 2009 and to
a lesser extent in 2010.
McDonald’s Corporation Annual Report 2010 15
Company-operated margins
In millions 2010 2009 2008
U.S. $ 902 $ 832 $ 856
Europe 1,373 1,240 1,340
APMEA 764 624 584
Other Countries & Corporate 134 111 128
Total $3,173 $2,807 $2,908
Percent of sales
U.S. 21.3% 19.4% 18.5%
Europe 19.8 18.4 18.0
APMEA 17.8 16.8 15.9
Other Countries & Corporate 17.2 15.2 15.3
Total 19.6% 18.2% 17.6%
In the U.S., the Company-operated margin percent increased
in 2010 due to lower commodity costs and positive comparable
sales, partly offset by higher labor costs. The margin percent
increased in 2009 due to positive comparable sales, partly offset
by additional depreciation related to the beverage initiative and
higher commodity costs. Refranchising had a positive impact on
both periods.
Europe’s Company-operated margin percent increased in
2010 primarily due to positive comparable sales and lower
commodity costs, partly offset by higher labor costs. The
margin
percent increased in 2009 primarily due to positive comparable
sales, partly offset by higher commodity and labor costs. In
2009,
local inflation and the impact of weaker currencies on the cost
of
certain imported products drove higher costs, primarily in
Russia,
and negatively impacted the Company-operated margin percent.
In APMEA, the Company-operated margin percent increased
in 2010 primarily due to positive comparable sales and lower
commodity costs, partly offset by higher occupancy & other
costs
and increased labor costs. The margin percent increased in 2009
due to positive comparable sales, partly offset by higher labor
costs.
• Supplemental information regarding Company-
operated restaurants
We continually review our restaurant ownership mix with a goal
of
improving local relevance, profits and returns. In most cases,
franchising is the best way to achieve these goals, but as pre-
viously stated, Company-operated restaurants are also important
to our success.
We report results for Company-operated restaurants based
on their sales, less costs directly incurred by that business
includ-
ing occupancy costs. We report the results for franchised
restaurants based on franchised revenues, less associated occu-
pancy costs. For this reason and because we manage our
business based on geographic segments and not on the basis of
our ownership structure, we do not specifically allocate selling,
general & administrative expenses and other operating (income)
expenses to Company-operated or franchised restaurants. Other
operating items that relate to the Company-operated restaurants
generally include gains/losses on sales of restaurant businesses
and write-offs of equipment and leasehold improvements.
We believe the following information about Company-
operated restaurants in our most significant markets provides an
additional perspective on this business. Management
responsible
for our Company-operated restaurants in these markets analyzes
the Company-operated business on this basis to assess its per-
formance. Management of the Company also considers this
information when evaluating restaurant ownership mix, subject
to
other relevant considerations.
The following table seeks to illustrate the two components of
our Company-operated margins. The first of these relates
exclusively to restaurant operations, which we refer to as “Store
operating margin.” The second relates to the value of our brand
and the real estate interest we retain for which we charge rent
and royalties. We refer to this component as “Brand/real estate
margin.” Both Company-operated and conventional franchised
restaurants are charged rent and royalties, although rent and
royalties for Company-operated restaurants are eliminated in
consolidation. Rent and royalties for both restaurant ownership
types are based on a percentage of sales, and the actual rent
percentage varies depending on the level of McDonald’s invest-
ment in the restaurant. Royalty rates may also vary by market.
As shown in the following table, in disaggregating the compo-
nents of our Company-operated margins, certain costs
with respect to Company-operated restaurants are reflected in
Brand/real estate margin. Those costs consist of rent payable by
McDonald’s to third parties on leased sites and depreciation for
buildings and leasehold improvements and constitute a portion
of
occupancy & other operating expenses recorded in the Con-
solidated statement of income. Store operating margins reflect
rent and royalty expenses, and those amounts are accounted for
as income in calculating Brand/real estate margin.
While we believe that the following information provides a
perspective in evaluating our Company-operated business, it is
not intended as a measure of our operating performance or as an
alternative to operating income or restaurant margins as
reported
by the Company in accordance with accounting principles gen-
erally accepted in the U.S. In particular, as noted previously, we
do not allocate selling, general & administrative expenses to our
Company-operated business. However, we believe that a range
of $40,000 to $50,000 per restaurant, on average, is a typical
range of costs to support this business in the U.S. The actual
costs in markets outside the U.S. will vary depending on local
circumstances and the organizational structure of the market.
These costs reflect the indirect services we believe are neces-
sary to provide the appropriate support of the restaurant.
16 McDonald’s Corporation Annual Report 2010
U.S. Europe
Dollars in millions 2010 2009 2008 2010 2009 2008
As reported
Number of Company-operated restaurants at year end 1,550
1,578 1,782 2,005 2,001 2,024
Sales by Company-operated restaurants $4,229 $4,295 $4,636 $
6,932 $ 6,721 $ 7,424
Company-operated margin $ 902 $ 832 $ 856 $ 1,373 $ 1,240 $
1,340
Store operating margin
Company-operated margin $ 902 $ 832 $ 856 $ 1,373 $ 1,240 $
1,340
Plus:
Outside rent expense(1) 60 65 74 223 222 254
Depreciation—buildings & leasehold improvements(1) 65 70 70
105 100 110
Less:
Rent & royalties(2) (619) (634) (684) (1,335) (1,306) (1,435)
Store operating margin $ 408 $ 333 $ 316 $ 366 $ 256 $ 269
Brand/real estate margin
Rent & royalties(2) $ 619 $ 634 $ 684 $ 1,335 $ 1,306 $ 1,435
Less:
Outside rent expense(1) (60) (65) (74) (223) (222) (254)
Depreciation—buildings & leasehold improvements(1) (65) (70)
(70) (105) (100) (110)
Brand/real estate margin $ 494 $ 499 $ 540 $ 1,007 $ 984 $
1,071
(1) Represents certain costs recorded as occupancy & other
operating expenses in the Consolidated statement of income –
rent payable by McDonald’s to third parties on leased sites and
depreciation for buildings and leasehold improvements. This
adjustment is made to reflect these occupancy costs in
Brand/real estate margin. The relative percentage of sites that
are
owned versus leased varies by country.
(2) Reflects average Company–operated rent and royalties (as a
percentage of 2010 sales: U.S. – 14.6% and Europe – 19.3%).
This adjustment is made to reflect expense in Store
operating margin and income in Brand/real estate margin.
Countries within Europe have varying economic profiles and a
wide range of rent and royalty rates as a percentage of sales.
SELLING, GENERAL & ADMINISTRATIVE EXPENSES
Consolidated selling, general & administrative expenses
increased 4% (4% in constant currencies) in 2010 and decreased
5% (2% in
constant currencies) in 2009. The Vancouver Winter Olympics
in February and the Company’s biennial Worldwide
Owner/Operator
Convention in April contributed to the increase in 2010. The
2009 expenses decreased partly due to costs in 2008 related to
the Beijing
Summer Olympics and the Company’s biennial Worldwide
Owner/Operator Convention.
Selling, general & administrative expenses
Amount Increase/(decrease)
Increase/(decrease)
excluding currency
translation
Dollars in millions 2010 2009 2008 2010 2009 2010 2009
U.S. $ 781 $ 751 $ 745 4% 1% 4% 1%
Europe 653 655 714 (8) 2
APMEA 306 276 300 10 (8) 4 (5)
Other Countries & Corporate(1) 593 552 596 7 (7) 5 (7)
Total $2,333 $2,234 $2,355 4% (5)% 4% (2)%
(1) Included in Other Countries & Corporate are home office
support costs in areas such as facilities, finance, human
resources, information technology, legal, marketing, restaurant
oper-
ations, supply chain and training.
Selling, general & administrative expenses as a percent of
revenues were 9.7% in 2010 compared with 9.8% in 2009 and
10.0% in
2008. Selling, general & administrative expenses as a percent of
Systemwide sales were 3.0% in 2010 compared with 3.1% in
2009
and 3.3% in 2008. Management believes that analyzing selling,
general & administrative expenses as a percent of Systemwide
sales, as
well as revenues, is meaningful because these costs are incurred
to support Systemwide restaurants.
McDonald’s Corporation Annual Report 2010 17
IMPAIRMENT AND OTHER CHARGES (CREDITS), NET
The Company recorded impairment and other charges (credits),
net of $29 million in 2010, ($61) million in 2009 and $6 million
in 2008. Management does not include these items when review-
ing business performance trends because we do not believe
these items are indicative of expected ongoing results.
Impairment and other charges (credits), net
In millions, except per share data 2010 2009 2008
Europe $ 1 $ 4 $ 6
APMEA 49
Other Countries & Corporate (21) (65)
Total $ 29 $ (61) $ 6
After tax(1) $ 25 $ (91) $ 4
Earnings per common share – diluted $0.02 $(0.08) $0.01
(1) Certain items were not tax effected.
In 2010, the Company recorded expense of $29 million pri-
marily related to its share of restaurant closing costs in
McDonald’s Japan in conjunction with the first quarter strategic
review of the market’s restaurant portfolio, partly offset by
income
related to the resolution of certain liabilities retained in con-
nection with the 2007 Latin America developmental license
transaction.
In 2009, the Company recorded income of $61 million
related primarily to the resolution of certain liabilities retained
in
connection with the 2007 Latin America developmental license
transaction. The Company also recognized a tax benefit in 2009
in connection with this income, mainly related to the release of
a
tax valuation allowance.
OTHER OPERATING (INCOME) EXPENSE, NET
Other operating (income) expense, net
In millions 2010 2009 2008
Gains on sales of restaurant
businesses $ (79) $(113) $(126)
Equity in earnings of
unconsolidated affiliates (164) (168) (111)
Asset dispositions and other
expense 45 59 72
Total $(198) $(222) $(165)
• Gains on sales of restaurant businesses
Gains on sales of restaurant businesses include gains from sales
of Company-operated restaurants as well as gains from
exercises of purchase options by franchisees with business
facili-
ties lease arrangements (arrangements where the Company
leases the businesses, including equipment, to franchisees who
generally have options to purchase the businesses). The Compa-
ny’s purchases and sales of businesses with its franchisees are
aimed at achieving an optimal ownership mix in each market.
Resulting gains or losses are recorded in operating income
because the transactions are a recurring part of our business.
The Company realized lower gains on sales of restaurant busi-
nesses in 2010 compared with 2009 and 2008 primarily as a
result of selling less Company-operated restaurants to franchi-
sees.
• Equity in earnings of unconsolidated affiliates
Unconsolidated affiliates and partnerships are businesses in
which the Company actively participates, but does not control.
The Company records equity in earnings from these entities
representing McDonald’s share of results. For foreign affiliated
markets – primarily Japan – results are reported after interest
expense and income taxes. McDonald’s share of results for part-
nerships in certain consolidated markets such as the U.S. is
reported before income taxes. These partnership restaurants are
operated under conventional franchise arrangements and, there-
fore, are classified as conventional franchised restaurants.
Results in 2010 reflected a reduction in the number of uncon-
solidated affiliate restaurants worldwide partly offset by
improved
operating performance in Japan. Results in 2009 also reflected
improved operating performance in Japan and benefited from
the
stronger Japanese Yen.
• Asset dispositions and other expense
Asset dispositions and other expense consists of gains or losses
on excess property and other asset dispositions, provisions for
restaurant closings and uncollectible receivables, asset write-
offs
due to restaurant reinvestment, and other miscellaneous income
and expenses.
18 McDonald’s Corporation Annual Report 2010
OPERATING INCOME
Operating income
Amount Increase/(decrease)
Increase/(decrease)
excluding currency
translation
Dollars in millions 2010 2009 2008 2010 2009 2010 2009
U.S. $3,446 $3,232 $3,060 7% 6% 7% 6%
Europe 2,797 2,588 2,608 8 (1) 12 8
APMEA 1,200 989 819 21 21 11 23
Other Countries & Corporate 30 32 (44) (6) nm (43) nm
Total $7,473 $6,841 $6,443 9% 6% 9% 10%
nm Not meaningful.
In the U.S., 2010 results increased due to higher combined res-
taurant margin dollars. Results for 2009 increased primarily due
to higher franchised margin dollars.
In Europe, results for 2010 and 2009 were driven by stronger
operating performance in France, Russia and the U.K.
In APMEA, 2010 results increased due to stronger results in
Australia and many other markets. The Company’s share of
impairment charges related to restaurant closings in Japan neg-
atively impacted the growth rate by 4 percentage points for the
year. Results for 2009 were driven primarily by strong results in
Australia and expansion in China.
In Other Countries & Corporate, results for 2010 and 2009
included income of $21 million and $65 million, respectively,
primarily related to the resolution of certain liabilities retained
in
connection with the 2007 Latin America developmental license
transaction.
• Combined operating margin
Combined operating margin is defined as operating income as a
percent of total revenues. Combined operating margin for 2010,
2009 and 2008 was 31.0%, 30.1% and 27.4%, respectively.
Impairment and other charges (credits), net negatively impacted
the combined operating margin by 0.2 percentage points in
2010, while positively impacting it by 0.3 percentage points in
2009.
INTEREST EXPENSE
Interest expense decreased in 2010 primarily due to lower aver-
age interest rates slightly offset by higher average debt
balances.
Interest expense decreased in 2009 primarily due to lower aver-
age interest rates, and to a lesser extent, weaker foreign
currencies, partly offset by higher average debt levels.
NONOPERATING (INCOME) EXPENSE, NET
Nonoperating (income) expense, net
In millions 2010 2009 2008
Interest income $(20) $(19) $(85)
Foreign currency and hedging
activity (2) (32) (5)
Other expense 44 27 12
Total $ 22 $(24) $(78)
Interest income consists primarily of interest earned on short-
term cash investments. Interest income decreased in 2009
primarily due to lower average interest rates. Foreign currency
and hedging activity primarily relates to net gains or losses on
certain hedges that reduce the exposure to variability on certain
intercompany foreign currency cash flow streams. Other
expense
primarily consists of amortization of debt issuance costs and
other nonoperating income and expenses.
GAIN ON SALE OF INVESTMENT
In 2009, the Company sold its minority ownership interest in
Redbox to Coinstar, Inc., the majority owner, for total consid-
eration of $140 million. As a result of the transaction, the
Company recognized a nonoperating pretax gain of $95 million
(after tax–$59 million or $0.05 per share).
In 2008, the Company sold its minority ownership interest in
U.K.-based Pret A Manger. In connection with the sale, the
Company received cash proceeds of $229 million and recog-
nized a nonoperating pretax gain of $160 million (after tax–
$109
million or $0.09 per share).
PROVISION FOR INCOME TAXES
In 2010, 2009 and 2008, the reported effective income tax rates
were 29.3%, 29.8% and 30.0%, respectively.
In 2010, the effective income tax rate decreased due to
higher tax benefits related to foreign operations.
In 2009, the effective income tax rate benefited by 0.7 per-
centage points primarily due to the resolution of certain
liabilities
retained in connection with the 2007 Latin America devel-
opmental license transaction.
Consolidated net deferred tax liabilities included tax assets,
net of valuation allowance, of $1.6 billion and $1.4 billion in
2010
and 2009, respectively. Substantially all of the net tax assets
arose in the U.S. and other profitable markets.
ACCOUNTING CHANGES
• Fair value measurements
In 2006, the Financial Accounting Standards Board (FASB)
issued guidance on fair value measurements, codified primarily
in
the Fair Value Measurements and Disclosures Topic of the
FASB
Accounting Standards Codification (ASC). This guidance
defines
fair value, establishes a framework for measuring fair value in
accordance with generally accepted accounting principles, and
expands disclosures about fair value measurements. This guid-
ance does not require any new fair value measurements; rather,
it
applies to other accounting pronouncements that require or
permit fair value measurements. The provisions of the guidance,
as issued, were effective January 1, 2008. However, in February
2008, the FASB deferred the effective date for one year for cer-
tain non-financial assets and non-financial liabilities, except
those
that are recognized or disclosed at fair value in the financial
McDonald’s Corporation Annual Report 2010 19
statements on a recurring basis (i.e., at least annually). The
Company adopted the required provisions related to debt and
derivatives as of January 1, 2008 and adopted the remaining
required provisions for non-financial assets and liabilities as of
January 1, 2009. The effect of adoption was not significant in
either period.
• Variable interest entities and consolidation
In June 2009, the FASB issued amendments to the guidance on
variable interest entities and consolidation, codified primarily
in
the Consolidation Topic of the FASB ASC. This guidance modi-
fies the method for determining whether an entity is a variable
interest entity as well as the methods permitted for determining
the primary beneficiary of a variable interest entity. In addition,
this guidance requires ongoing reassessments of whether a
company is the primary beneficiary of a variable interest entity
and enhanced disclosures related to a company’s involvement
with a variable interest entity. The Company adopted this guid-
ance as of January 1, 2010.
On an ongoing basis, the Company evaluates its business
relationships such as those with franchisees, joint venture part-
ners, developmental licensees, suppliers, and advertising
cooperatives to identify potential variable interest entities. Gen-
erally, these businesses qualify for a scope exception under the
consolidation guidance. The Company has concluded that con-
solidation of any such entities is not appropriate for the periods
presented. As a result, the adoption did not have any impact on
the Company’s consolidated financial statements.
Cash Flows
The Company generates significant cash from its operations and
has substantial credit availability and capacity to fund operating
and discretionary spending such as capital expenditures, debt
repayments, dividends and share repurchases.
Cash provided by operations totaled $6.3 billion and
exceeded capital expenditures by $4.2 billion in 2010, while
cash
provided by operations totaled $5.8 billion and exceeded capital
expenditures by $3.8 billion in 2009. In 2010, cash provided by
operations increased $591 million or 10% compared with 2009
primarily due to increased operating results. In 2009, cash pro-
vided by operations decreased $166 million or 3% compared
with 2008 despite increased operating results, primarily due to
higher income tax payments, higher noncash income items and
the receipt of $143 million in 2008 related to the completion of
an IRS examination.
Cash used for investing activities totaled $2.1 billion in 2010,
an increase of $401 million compared with 2009. This reflects
higher capital expenditures and lower proceeds from sales of
investments and restaurant businesses. Cash used for investing
activities totaled $1.7 billion in 2009, an increase of $31
million
compared with 2008. This reflects lower proceeds from sales of
investments, restaurant businesses and property, offset by lower
capital expenditures, primarily in the U.S.
Cash used for financing activities totaled $3.7 billion in 2010,
a decrease of $692 million compared with 2009, primarily due
to
higher net debt issuances, higher proceeds from stock option
exercises and lower treasury stock purchases, partly offset by an
increase in the common stock dividend. Cash used for financing
activities totaled $4.4 billion in 2009, an increase of $307
million
compared with 2008, primarily due to lower net debt issuances,
an increase in the common stock dividend and lower proceeds
from stock option exercises, partly offset by lower treasury
stock
purchases.
As a result of the above activity, the Company’s cash and
equivalents balance increased $591 million in 2010 to $2.4 bil-
lion, compared with a decrease of $267 million in 2009. In
addition to cash and equivalents on hand and cash provided by
operations, the Company can meet short-term funding needs
through its continued access to commercial paper borrowings
and line of credit agreements.
RESTAURANT DEVELOPMENT AND CAPITAL
EXPENDITURES
In 2010, the Company opened 957 traditional restaurants and
35 satellite restaurants (small, limited-menu restaurants for
which
the land and building are generally leased), and closed 406
tradi-
tional restaurants and 327 satellite restaurants. Of these
closures, there were over 400 in McDonald’s Japan due to the
strategic review of the market’s restaurant portfolio. In 2009,
the
Company opened 824 traditional restaurants and 44 satellite
restaurants and closed 215 traditional restaurants and 142 satel-
lite restaurants. The majority of restaurant openings and
closings
occurred in the major markets in both years. The Company
closes
restaurants for a variety of reasons, such as existing sales and
profit performance or loss of real estate tenure.
Systemwide restaurants at year end(1)
2010 2009 2008
U.S. 14,027 13,980 13,918
Europe 6,969 6,785 6,628
APMEA 8,424 8,488 8,255
Other Countries & Corporate 3,317 3,225 3,166
Total 32,737 32,478 31,967
(1) Includes satellite units at December 31, 2010, 2009 and
2008 as follows: U.S. –
1,112, 1,155, 1,169; Europe–239, 241, 226; APMEA (primarily
Japan)–1,010,
1,263, 1,379; Other Countries & Corporate–470, 464, 447.
Approximately 65% of Company-operated restaurants and
about 80% of franchised restaurants were located in the major
markets at the end of 2010. About 80% of the restaurants at
year-end 2010 were franchised.
Capital expenditures increased $183 million or 9% in 2010
primarily due to higher investment in new restaurants. Capital
expenditures decreased $184 million or 9% in 2009 primarily
due to fewer restaurant openings, lower reinvestment in existing
restaurants in the U.S. and the impact of foreign currency trans-
lation. In both years, capital expenditures reflected the
Company’s
commitment to grow sales at existing restaurants, including
reinvestment initiatives such as reimaging in many markets
around the world.
Capital expenditures invested in major markets, excluding
Japan, represented over 65% of the total in 2010, 2009 and
2008. Japan is accounted for under the equity method, and
accordingly its capital expenditures are not included in con-
solidated amounts.
Capital expenditures
In millions 2010 2009 2008
New restaurants $ 968 $ 809 $ 897
Existing restaurants 1,089 1,070 1,152
Other(1) 78 73 87
Total capital
expenditures $ 2,135 $ 1,952 $ 2,136
Total assets $31,975 $30,225 $28,462
(1) Primarily corporate equipment and other office-related
expenditures.
20 McDonald’s Corporation Annual Report 2010
New restaurant investments in all years were concentrated in
markets with acceptable returns or opportunities for long-term
growth. Average development costs vary widely by market
depending on the types of restaurants built and the real estate
and construction costs within each market. These costs, which
include land, buildings and equipment, are managed through the
use of optimally sized restaurants, construction and design effi-
ciencies, and leveraging best practices. Although the Company
is
not responsible for all costs for every restaurant opened, total
development costs (consisting of land, buildings and equipment)
for new traditional McDonald’s restaurants in the U.S. averaged
approximately $2.6 million in 2010.
The Company owned approximately 45% of the land and
about 70% of the buildings for restaurants in its consolidated
markets at year-end 2010 and 2009.
SHARE REPURCHASES AND DIVIDENDS
In 2010, the Company returned $5.1 billion to shareholders
through a combination of shares repurchased and dividends
paid.
Shares repurchased and dividends
In millions, except per share data 2010 2009 2008
Number of shares repurchased 37.8 50.3 69.7
Shares outstanding at year
end 1,054 1,077 1,115
Dividends declared per share $ 2.26 $ 2.05 $1.625
Dollar amount of shares
repurchased $2,649 $2,854 $3,981
Dividends paid 2,408 2,235 1,823
Total returned to
shareholders $5,057 $5,089 $5,804
In September 2009, the Company’s Board of Directors
approved a $10 billion share repurchase program with no speci-
fied expiration date. In 2009 and 2010 combined, approximately
45 million shares have been repurchased for $3.1 billion under
this program. This program replaced the $10 billion share
repurchase program that the Company’s Board of Directors
approved in September 2007.
The Company has paid dividends on its common stock for 35
consecutive years and has increased the dividend amount every
year. The 2010 full year dividend of $2.26 per share reflects the
quarterly dividend paid for each of the first three quarters of
$0.55 per share, with an increase to $0.61 per share paid in the
fourth quarter. This 11% increase in the quarterly dividend
equa-
tes to a $2.44 per share annual dividend rate and reflects the
Company’s confidence in the ongoing strength and reliability of
its cash flow. As in the past, future dividend amounts will be
con-
sidered after reviewing profitability expectations and financing
needs, and will be declared at the discretion of the Company’s
Board of Directors.
Financial Position and Capital Resources
TOTAL ASSETS AND RETURNS
Total assets increased $1.8 billion or 6% in 2010. Excluding the
effect of changes in foreign currency exchange rates, total
assets increased $1.7 billion in 2010. Over 70% of total assets
were in major markets at year-end 2010. Net property and
equipment increased $529 million in 2010 and represented
about 70% of total assets at year end. Excluding the effect of
changes in foreign currency exchange rates, net property and
equipment increased $719 million primarily due to capital
expenditures, partly offset by depreciation.
Operating income is used to compute return on average
assets, while net income is used to calculate return on average
common equity. Month-end balances are used to compute both
average assets and average common equity.
Returns on assets and equity
2010 2009 2008
Return on average assets 24.7% 23.4% 21.8%
Return on average common equity 35.3 34.0 30.6
In 2010, 2009 and 2008, return on average assets and
return on average common equity benefited from strong global
operating results. Operating income, as reported, does not
include interest income; however, cash balances are included in
average assets. The inclusion of cash balances in average assets
reduced return on average assets by 1.9 percentage points, 2.0
percentage points and 1.9 percentage points in 2010, 2009 and
2008, respectively.
FINANCING AND MARKET RISK
The Company generally borrows on a long-term basis and is
exposed to the impact of interest rate changes and foreign cur-
rency fluctuations. Debt obligations at December 31, 2010
totaled $11.5 billion, compared with $10.6 billion at
December 31, 2009. The net increase in 2010 was primarily due
to net issuances of $787 million and changes in exchange rates
on foreign currency denominated debt of $140 million.
Debt highlights(1)
2010 2009 2008
Fixed-rate debt as a percent of total
debt(2,3) 66% 68% 72%
Weighted-average annual interest
rate of total debt(3) 4.3 4.5 5.0
Foreign currency-denominated debt
as a percent of total debt(2) 41 43 45
Total debt as a percent of total
capitalization (total debt and total
shareholders’ equity)(2) 44 43 43
Cash provided by operations as a
percent of total debt(2) 55 55 59
(1) All percentages are as of December 31, except for the
weighted-average annual
interest rate, which is for the year.
(2) Based on debt obligations before the effect of fair value
hedging adjustments. This
effect is excluded as these adjustments have no impact on the
obligation at maturity.
See Debt financing note to the consolidated financial
statements.
(3) Includes the effect of interest rate exchange agreements.
Fitch, Standard & Poor’s and Moody’s currently rate, with a
stable outlook, the Company’s commercial paper F1, A-1 and
P-1, respectively; and its long-term debt A, A and A2,
respectively.
Certain of the Company’s debt obligations contain cross-
acceleration provisions and restrictions on Company and
subsidiary mortgages and the long-term debt of certain sub-
sidiaries. There are no provisions in the Company’s debt
obligations that would accelerate repayment of debt as a result
of
McDonald’s Corporation Annual Report 2010 21
a change in credit ratings or a material adverse change in the
Company’s business. Under existing authorization from the
Company’s Board of Directors, at December 31, 2010, the
Company has $3 billion of authority remaining to borrow funds,
including through (i) public or private offering of debt
securities;
(ii) direct borrowing from banks or other financial institutions;
and
(iii) other forms of indebtedness. In addition to registered debt
securities on a U.S. shelf registration statement and a Global
Medium-Term Notes program, the Company has $1.3 billion
available under committed line of credit agreements as well as
authority to issue commercial paper in the U.S. and Global
market
(see Debt financing note to the consolidated financial
statements). Debt maturing in 2011 is approximately $601 mil-
lion of long-term corporate debt. In 2011, the Company expects
to issue commercial paper and long-term debt to refinance this
maturing debt. The Company also has $595 million of foreign
currency bank line borrowings outstanding at year-end 2010.
The Company uses major capital markets, bank financings
and derivatives to meet its financing requirements and reduce
interest expense. The Company manages its debt portfolio in
response to changes in interest rates and foreign currency rates
by periodically retiring, redeeming and repurchasing debt,
termi-
nating exchange agreements and using derivatives. The
Company does not use derivatives with a level of complexity or
with a risk higher than the exposures to be hedged and does not
hold or issue derivatives for trading purposes. All exchange
agreements are over-the-counter instruments.
In managing the impact of interest rate changes and foreign
currency fluctuations, the Company uses interest rate exchange
agreements and finances in the currencies in which assets are
denominated. The Company uses foreign currency debt and
derivatives to hedge the foreign currency risk associated with
certain royalties, intercompany financings and long-term invest-
ments in foreign subsidiaries and affiliates. This reduces the
impact of fluctuating foreign currencies on cash flows and
shareholders’ equity. Total foreign currency-denominated debt
was $4.7 billion and $4.5 billion for the years ended
December 31, 2010 and 2009, respectively. In addition, where
practical, the Company’s restaurants purchase goods and serv-
ices in local currencies resulting in natural hedges. See
Summary
of significant accounting policies note to the consolidated
finan-
cial statements related to financial instruments and hedging
activities for additional information regarding the accounting
impact and use of derivatives.
The Company does not have significant exposure to any
individual counterparty and has master agreements that contain
netting arrangements. Certain of these agreements also require
each party to post collateral if credit ratings fall below, or
aggregate exposures exceed, certain contractual limits. At
December 31, 2010, neither the Company nor its counterparties
were required to post collateral on any derivative position, other
than on hedges of certain of the Company’s supplemental
benefit
plan liabilities where our counterparty was required to post
collateral on its liability position.
The Company’s net asset exposure is diversified among a
broad basket of currencies. The Company’s largest net asset
exposures (defined as foreign currency assets less foreign cur-
rency liabilities) at year end were as follows:
Foreign currency net asset exposures
In millions of U.S. Dollars 2010 2009
Euro $5,465 $5,151
Australian Dollars 2,075 1,460
Canadian Dollars 1,123 981
Russian Ruble 589 501
British Pounds Sterling 547 679
The Company prepared sensitivity analyses of its financial
instruments to determine the impact of hypothetical changes in
interest rates and foreign currency exchange rates on the
Company’s results of operations, cash flows and the fair value
of
its financial instruments. The interest rate analysis assumed a
one
percentage point adverse change in interest rates on all financial
instruments, but did not consider the effects of the reduced level
of economic activity that could exist in such an environment.
The
foreign currency rate analysis assumed that each foreign
currency
rate would change by 10% in the same direction relative to the
U.S. Dollar on all financial instruments; however, the analysis
did
not include the potential impact on revenues, local currency
prices
or the effect of fluctuating currencies on the Company’s antici-
pated foreign currency royalties and other payments received in
the U.S. Based on the results of these analyses of the
Company’s
financial instruments, neither a one percentage point adverse
change in interest rates from 2010 levels nor a 10% adverse
change in foreign currency rates from 2010 levels would materi-
ally affect the Company’s results of operations, cash flows or
the
fair value of its financial instruments.
22 McDonald’s Corporation Annual Report 2010
CONTRACTUAL OBLIGATIONS AND COMMITMENTS
The Company has long-term contractual obligations primarily in
the form of lease obligations (related to both Company-operated
and franchised restaurants) and debt obligations. In addition,
the
Company has long-term revenue and cash flow streams that
relate to its franchise arrangements. Cash provided by
operations
(including cash provided by these franchise arrangements) along
with the Company’s borrowing capacity and other sources of
cash will be used to satisfy the obligations. The following table
summarizes the Company’s contractual obligations and their
aggregate maturities as well as future minimum rent payments
due to the Company under existing franchise arrangements as of
December 31, 2010. See discussions of cash flows and financial
position and capital resources as well as the Notes to the con-
solidated financial statements for further details.
Contractual cash outflows Contractual cash inflows
In millions
Operating
leases
Debt
obligations(1)
Minimum rent under
franchise arrangements
2011 $ 1,200 $ 8 $ 2,349
Appendix 1Final Project Overview and TimelineFinal Project O.docx

More Related Content

Similar to Appendix 1Final Project Overview and TimelineFinal Project O.docx

For completing this assignment successfully, you must read careful.docx
For completing this assignment successfully, you must read careful.docxFor completing this assignment successfully, you must read careful.docx
For completing this assignment successfully, you must read careful.docxlmelaine
 
ACC 561 Education Specialist |tutorialrank.com
ACC 561 Education Specialist |tutorialrank.comACC 561 Education Specialist |tutorialrank.com
ACC 561 Education Specialist |tutorialrank.comladworkspaces
 
ACC 561 Education Specialist |tutorialrank.com
ACC 561 Education Specialist |tutorialrank.comACC 561 Education Specialist |tutorialrank.com
ACC 561 Education Specialist |tutorialrank.comladworkspaces
 
COVENTRY UNIVERSTYFaculty of Business Environment and Society.docx
COVENTRY UNIVERSTYFaculty of Business Environment and Society.docxCOVENTRY UNIVERSTYFaculty of Business Environment and Society.docx
COVENTRY UNIVERSTYFaculty of Business Environment and Society.docxvanesaburnand
 
Bus 599 week 10 project deliverable 6 – strayer new
Bus 599 week 10 project deliverable 6 – strayer newBus 599 week 10 project deliverable 6 – strayer new
Bus 599 week 10 project deliverable 6 – strayer newCarolMurray2018
 
Bus 599 week 10 project deliverable 6 – strayer new
Bus 599 week 10 project deliverable 6 – strayer newBus 599 week 10 project deliverable 6 – strayer new
Bus 599 week 10 project deliverable 6 – strayer newlynnruffin
 
Bus 599 week 10 project deliverable 6 – strayer new
Bus 599 week 10 project deliverable 6 – strayer newBus 599 week 10 project deliverable 6 – strayer new
Bus 599 week 10 project deliverable 6 – strayer newAmyBell2017
 
Acc 557 assignment 2 – strayer week 10
Acc 557 assignment 2 – strayer week 10Acc 557 assignment 2 – strayer week 10
Acc 557 assignment 2 – strayer week 10AmyBell2017
 
Acc 557 assignment 2 – strayer week 10
Acc 557 assignment 2 – strayer week 10Acc 557 assignment 2 – strayer week 10
Acc 557 assignment 2 – strayer week 10taynagant
 

Similar to Appendix 1Final Project Overview and TimelineFinal Project O.docx (9)

For completing this assignment successfully, you must read careful.docx
For completing this assignment successfully, you must read careful.docxFor completing this assignment successfully, you must read careful.docx
For completing this assignment successfully, you must read careful.docx
 
ACC 561 Education Specialist |tutorialrank.com
ACC 561 Education Specialist |tutorialrank.comACC 561 Education Specialist |tutorialrank.com
ACC 561 Education Specialist |tutorialrank.com
 
ACC 561 Education Specialist |tutorialrank.com
ACC 561 Education Specialist |tutorialrank.comACC 561 Education Specialist |tutorialrank.com
ACC 561 Education Specialist |tutorialrank.com
 
COVENTRY UNIVERSTYFaculty of Business Environment and Society.docx
COVENTRY UNIVERSTYFaculty of Business Environment and Society.docxCOVENTRY UNIVERSTYFaculty of Business Environment and Society.docx
COVENTRY UNIVERSTYFaculty of Business Environment and Society.docx
 
Bus 599 week 10 project deliverable 6 – strayer new
Bus 599 week 10 project deliverable 6 – strayer newBus 599 week 10 project deliverable 6 – strayer new
Bus 599 week 10 project deliverable 6 – strayer new
 
Bus 599 week 10 project deliverable 6 – strayer new
Bus 599 week 10 project deliverable 6 – strayer newBus 599 week 10 project deliverable 6 – strayer new
Bus 599 week 10 project deliverable 6 – strayer new
 
Bus 599 week 10 project deliverable 6 – strayer new
Bus 599 week 10 project deliverable 6 – strayer newBus 599 week 10 project deliverable 6 – strayer new
Bus 599 week 10 project deliverable 6 – strayer new
 
Acc 557 assignment 2 – strayer week 10
Acc 557 assignment 2 – strayer week 10Acc 557 assignment 2 – strayer week 10
Acc 557 assignment 2 – strayer week 10
 
Acc 557 assignment 2 – strayer week 10
Acc 557 assignment 2 – strayer week 10Acc 557 assignment 2 – strayer week 10
Acc 557 assignment 2 – strayer week 10
 

More from rossskuddershamus

As a human resources manager, you need to advise top leadership (CEO.docx
As a human resources manager, you need to advise top leadership (CEO.docxAs a human resources manager, you need to advise top leadership (CEO.docx
As a human resources manager, you need to advise top leadership (CEO.docxrossskuddershamus
 
As a homeowner, you have become more concerned about the energy is.docx
As a homeowner, you have become more concerned about the energy is.docxAs a homeowner, you have become more concerned about the energy is.docx
As a homeowner, you have become more concerned about the energy is.docxrossskuddershamus
 
As a healthcare professional, you will be working closely with o.docx
As a healthcare professional, you will be working closely with o.docxAs a healthcare professional, you will be working closely with o.docx
As a healthcare professional, you will be working closely with o.docxrossskuddershamus
 
As a future teacher exposed to the rising trend of blogs and adv.docx
As a future teacher exposed to the rising trend of blogs and adv.docxAs a future teacher exposed to the rising trend of blogs and adv.docx
As a future teacher exposed to the rising trend of blogs and adv.docxrossskuddershamus
 
As a fresh research intern, you are a part of the hypothetical.docx
As a fresh research intern, you are a part of the hypothetical.docxAs a fresh research intern, you are a part of the hypothetical.docx
As a fresh research intern, you are a part of the hypothetical.docxrossskuddershamus
 
As a fresh research intern, you are a part of the hypothetical Nat.docx
As a fresh research intern, you are a part of the hypothetical Nat.docxAs a fresh research intern, you are a part of the hypothetical Nat.docx
As a fresh research intern, you are a part of the hypothetical Nat.docxrossskuddershamus
 
As a former emergency department Registered Nurse for over seven.docx
As a former emergency department Registered Nurse for over seven.docxAs a former emergency department Registered Nurse for over seven.docx
As a former emergency department Registered Nurse for over seven.docxrossskuddershamus
 
As a doctorally prepared nurse, you are writing a Continuous Qua.docx
As a doctorally prepared nurse, you are writing a Continuous Qua.docxAs a doctorally prepared nurse, you are writing a Continuous Qua.docx
As a doctorally prepared nurse, you are writing a Continuous Qua.docxrossskuddershamus
 
As a consumer of information, do you generally look for objectivity .docx
As a consumer of information, do you generally look for objectivity .docxAs a consumer of information, do you generally look for objectivity .docx
As a consumer of information, do you generally look for objectivity .docxrossskuddershamus
 
As a center of intellectual life and learning, Timbuktua. had ver.docx
As a center of intellectual life and learning, Timbuktua. had ver.docxAs a center of intellectual life and learning, Timbuktua. had ver.docx
As a center of intellectual life and learning, Timbuktua. had ver.docxrossskuddershamus
 
ary AssignmentCertified medical administrative assistants (CMAAs) .docx
ary AssignmentCertified medical administrative assistants (CMAAs) .docxary AssignmentCertified medical administrative assistants (CMAAs) .docx
ary AssignmentCertified medical administrative assistants (CMAAs) .docxrossskuddershamus
 
As (or after) you read The Declaration of Independence, identify.docx
As (or after) you read The Declaration of Independence, identify.docxAs (or after) you read The Declaration of Independence, identify.docx
As (or after) you read The Declaration of Independence, identify.docxrossskuddershamus
 
ARTWORK Markus Linnenbrink HOWTOSURVIVE, 2012, epoxy resin .docx
ARTWORK Markus Linnenbrink HOWTOSURVIVE, 2012, epoxy resin  .docxARTWORK Markus Linnenbrink HOWTOSURVIVE, 2012, epoxy resin  .docx
ARTWORK Markus Linnenbrink HOWTOSURVIVE, 2012, epoxy resin .docxrossskuddershamus
 
AS 4678—2002www.standards.com.au © Standards Australia .docx
AS 4678—2002www.standards.com.au © Standards Australia .docxAS 4678—2002www.standards.com.au © Standards Australia .docx
AS 4678—2002www.standards.com.au © Standards Australia .docxrossskuddershamus
 
arugumentative essay on article given belowIn Parents Keep Chil.docx
arugumentative essay on article given belowIn Parents Keep Chil.docxarugumentative essay on article given belowIn Parents Keep Chil.docx
arugumentative essay on article given belowIn Parents Keep Chil.docxrossskuddershamus
 
artsArticleCircling Round Vitruvius, Linear Perspectiv.docx
artsArticleCircling Round Vitruvius, Linear Perspectiv.docxartsArticleCircling Round Vitruvius, Linear Perspectiv.docx
artsArticleCircling Round Vitruvius, Linear Perspectiv.docxrossskuddershamus
 
ARTS & NATURE MARKETING PROJECT OF SHEFFIELDYang yux.docx
ARTS & NATURE MARKETING PROJECT OF SHEFFIELDYang yux.docxARTS & NATURE MARKETING PROJECT OF SHEFFIELDYang yux.docx
ARTS & NATURE MARKETING PROJECT OF SHEFFIELDYang yux.docxrossskuddershamus
 
ARTIGO ORIGINALRevista Cient.docx
ARTIGO ORIGINALRevista Cient.docxARTIGO ORIGINALRevista Cient.docx
ARTIGO ORIGINALRevista Cient.docxrossskuddershamus
 
Artist Analysis Project – Due Week 61)Powerpoint project at le.docx
Artist Analysis Project – Due Week 61)Powerpoint project at le.docxArtist Analysis Project – Due Week 61)Powerpoint project at le.docx
Artist Analysis Project – Due Week 61)Powerpoint project at le.docxrossskuddershamus
 
Artist Research Paper RequirementsYou are to write a 3 page double.docx
Artist Research Paper RequirementsYou are to write a 3 page double.docxArtist Research Paper RequirementsYou are to write a 3 page double.docx
Artist Research Paper RequirementsYou are to write a 3 page double.docxrossskuddershamus
 

More from rossskuddershamus (20)

As a human resources manager, you need to advise top leadership (CEO.docx
As a human resources manager, you need to advise top leadership (CEO.docxAs a human resources manager, you need to advise top leadership (CEO.docx
As a human resources manager, you need to advise top leadership (CEO.docx
 
As a homeowner, you have become more concerned about the energy is.docx
As a homeowner, you have become more concerned about the energy is.docxAs a homeowner, you have become more concerned about the energy is.docx
As a homeowner, you have become more concerned about the energy is.docx
 
As a healthcare professional, you will be working closely with o.docx
As a healthcare professional, you will be working closely with o.docxAs a healthcare professional, you will be working closely with o.docx
As a healthcare professional, you will be working closely with o.docx
 
As a future teacher exposed to the rising trend of blogs and adv.docx
As a future teacher exposed to the rising trend of blogs and adv.docxAs a future teacher exposed to the rising trend of blogs and adv.docx
As a future teacher exposed to the rising trend of blogs and adv.docx
 
As a fresh research intern, you are a part of the hypothetical.docx
As a fresh research intern, you are a part of the hypothetical.docxAs a fresh research intern, you are a part of the hypothetical.docx
As a fresh research intern, you are a part of the hypothetical.docx
 
As a fresh research intern, you are a part of the hypothetical Nat.docx
As a fresh research intern, you are a part of the hypothetical Nat.docxAs a fresh research intern, you are a part of the hypothetical Nat.docx
As a fresh research intern, you are a part of the hypothetical Nat.docx
 
As a former emergency department Registered Nurse for over seven.docx
As a former emergency department Registered Nurse for over seven.docxAs a former emergency department Registered Nurse for over seven.docx
As a former emergency department Registered Nurse for over seven.docx
 
As a doctorally prepared nurse, you are writing a Continuous Qua.docx
As a doctorally prepared nurse, you are writing a Continuous Qua.docxAs a doctorally prepared nurse, you are writing a Continuous Qua.docx
As a doctorally prepared nurse, you are writing a Continuous Qua.docx
 
As a consumer of information, do you generally look for objectivity .docx
As a consumer of information, do you generally look for objectivity .docxAs a consumer of information, do you generally look for objectivity .docx
As a consumer of information, do you generally look for objectivity .docx
 
As a center of intellectual life and learning, Timbuktua. had ver.docx
As a center of intellectual life and learning, Timbuktua. had ver.docxAs a center of intellectual life and learning, Timbuktua. had ver.docx
As a center of intellectual life and learning, Timbuktua. had ver.docx
 
ary AssignmentCertified medical administrative assistants (CMAAs) .docx
ary AssignmentCertified medical administrative assistants (CMAAs) .docxary AssignmentCertified medical administrative assistants (CMAAs) .docx
ary AssignmentCertified medical administrative assistants (CMAAs) .docx
 
As (or after) you read The Declaration of Independence, identify.docx
As (or after) you read The Declaration of Independence, identify.docxAs (or after) you read The Declaration of Independence, identify.docx
As (or after) you read The Declaration of Independence, identify.docx
 
ARTWORK Markus Linnenbrink HOWTOSURVIVE, 2012, epoxy resin .docx
ARTWORK Markus Linnenbrink HOWTOSURVIVE, 2012, epoxy resin  .docxARTWORK Markus Linnenbrink HOWTOSURVIVE, 2012, epoxy resin  .docx
ARTWORK Markus Linnenbrink HOWTOSURVIVE, 2012, epoxy resin .docx
 
AS 4678—2002www.standards.com.au © Standards Australia .docx
AS 4678—2002www.standards.com.au © Standards Australia .docxAS 4678—2002www.standards.com.au © Standards Australia .docx
AS 4678—2002www.standards.com.au © Standards Australia .docx
 
arugumentative essay on article given belowIn Parents Keep Chil.docx
arugumentative essay on article given belowIn Parents Keep Chil.docxarugumentative essay on article given belowIn Parents Keep Chil.docx
arugumentative essay on article given belowIn Parents Keep Chil.docx
 
artsArticleCircling Round Vitruvius, Linear Perspectiv.docx
artsArticleCircling Round Vitruvius, Linear Perspectiv.docxartsArticleCircling Round Vitruvius, Linear Perspectiv.docx
artsArticleCircling Round Vitruvius, Linear Perspectiv.docx
 
ARTS & NATURE MARKETING PROJECT OF SHEFFIELDYang yux.docx
ARTS & NATURE MARKETING PROJECT OF SHEFFIELDYang yux.docxARTS & NATURE MARKETING PROJECT OF SHEFFIELDYang yux.docx
ARTS & NATURE MARKETING PROJECT OF SHEFFIELDYang yux.docx
 
ARTIGO ORIGINALRevista Cient.docx
ARTIGO ORIGINALRevista Cient.docxARTIGO ORIGINALRevista Cient.docx
ARTIGO ORIGINALRevista Cient.docx
 
Artist Analysis Project – Due Week 61)Powerpoint project at le.docx
Artist Analysis Project – Due Week 61)Powerpoint project at le.docxArtist Analysis Project – Due Week 61)Powerpoint project at le.docx
Artist Analysis Project – Due Week 61)Powerpoint project at le.docx
 
Artist Research Paper RequirementsYou are to write a 3 page double.docx
Artist Research Paper RequirementsYou are to write a 3 page double.docxArtist Research Paper RequirementsYou are to write a 3 page double.docx
Artist Research Paper RequirementsYou are to write a 3 page double.docx
 

Recently uploaded

Interactive Powerpoint_How to Master effective communication
Interactive Powerpoint_How to Master effective communicationInteractive Powerpoint_How to Master effective communication
Interactive Powerpoint_How to Master effective communicationnomboosow
 
Key note speaker Neum_Admir Softic_ENG.pdf
Key note speaker Neum_Admir Softic_ENG.pdfKey note speaker Neum_Admir Softic_ENG.pdf
Key note speaker Neum_Admir Softic_ENG.pdfAdmir Softic
 
Presentation by Andreas Schleicher Tackling the School Absenteeism Crisis 30 ...
Presentation by Andreas Schleicher Tackling the School Absenteeism Crisis 30 ...Presentation by Andreas Schleicher Tackling the School Absenteeism Crisis 30 ...
Presentation by Andreas Schleicher Tackling the School Absenteeism Crisis 30 ...EduSkills OECD
 
Measures of Central Tendency: Mean, Median and Mode
Measures of Central Tendency: Mean, Median and ModeMeasures of Central Tendency: Mean, Median and Mode
Measures of Central Tendency: Mean, Median and ModeThiyagu K
 
microwave assisted reaction. General introduction
microwave assisted reaction. General introductionmicrowave assisted reaction. General introduction
microwave assisted reaction. General introductionMaksud Ahmed
 
Advanced Views - Calendar View in Odoo 17
Advanced Views - Calendar View in Odoo 17Advanced Views - Calendar View in Odoo 17
Advanced Views - Calendar View in Odoo 17Celine George
 
Introduction to Nonprofit Accounting: The Basics
Introduction to Nonprofit Accounting: The BasicsIntroduction to Nonprofit Accounting: The Basics
Introduction to Nonprofit Accounting: The BasicsTechSoup
 
Q4-W6-Restating Informational Text Grade 3
Q4-W6-Restating Informational Text Grade 3Q4-W6-Restating Informational Text Grade 3
Q4-W6-Restating Informational Text Grade 3JemimahLaneBuaron
 
IGNOU MSCCFT and PGDCFT Exam Question Pattern: MCFT003 Counselling and Family...
IGNOU MSCCFT and PGDCFT Exam Question Pattern: MCFT003 Counselling and Family...IGNOU MSCCFT and PGDCFT Exam Question Pattern: MCFT003 Counselling and Family...
IGNOU MSCCFT and PGDCFT Exam Question Pattern: MCFT003 Counselling and Family...PsychoTech Services
 
Student login on Anyboli platform.helpin
Student login on Anyboli platform.helpinStudent login on Anyboli platform.helpin
Student login on Anyboli platform.helpinRaunakKeshri1
 
fourth grading exam for kindergarten in writing
fourth grading exam for kindergarten in writingfourth grading exam for kindergarten in writing
fourth grading exam for kindergarten in writingTeacherCyreneCayanan
 
Kisan Call Centre - To harness potential of ICT in Agriculture by answer farm...
Kisan Call Centre - To harness potential of ICT in Agriculture by answer farm...Kisan Call Centre - To harness potential of ICT in Agriculture by answer farm...
Kisan Call Centre - To harness potential of ICT in Agriculture by answer farm...Krashi Coaching
 
Nutritional Needs Presentation - HLTH 104
Nutritional Needs Presentation - HLTH 104Nutritional Needs Presentation - HLTH 104
Nutritional Needs Presentation - HLTH 104misteraugie
 
Unit-IV- Pharma. Marketing Channels.pptx
Unit-IV- Pharma. Marketing Channels.pptxUnit-IV- Pharma. Marketing Channels.pptx
Unit-IV- Pharma. Marketing Channels.pptxVishalSingh1417
 
The Most Excellent Way | 1 Corinthians 13
The Most Excellent Way | 1 Corinthians 13The Most Excellent Way | 1 Corinthians 13
The Most Excellent Way | 1 Corinthians 13Steve Thomason
 
A Critique of the Proposed National Education Policy Reform
A Critique of the Proposed National Education Policy ReformA Critique of the Proposed National Education Policy Reform
A Critique of the Proposed National Education Policy ReformChameera Dedduwage
 

Recently uploaded (20)

Mattingly "AI & Prompt Design: Structured Data, Assistants, & RAG"
Mattingly "AI & Prompt Design: Structured Data, Assistants, & RAG"Mattingly "AI & Prompt Design: Structured Data, Assistants, & RAG"
Mattingly "AI & Prompt Design: Structured Data, Assistants, & RAG"
 
Interactive Powerpoint_How to Master effective communication
Interactive Powerpoint_How to Master effective communicationInteractive Powerpoint_How to Master effective communication
Interactive Powerpoint_How to Master effective communication
 
Código Creativo y Arte de Software | Unidad 1
Código Creativo y Arte de Software | Unidad 1Código Creativo y Arte de Software | Unidad 1
Código Creativo y Arte de Software | Unidad 1
 
Key note speaker Neum_Admir Softic_ENG.pdf
Key note speaker Neum_Admir Softic_ENG.pdfKey note speaker Neum_Admir Softic_ENG.pdf
Key note speaker Neum_Admir Softic_ENG.pdf
 
Presentation by Andreas Schleicher Tackling the School Absenteeism Crisis 30 ...
Presentation by Andreas Schleicher Tackling the School Absenteeism Crisis 30 ...Presentation by Andreas Schleicher Tackling the School Absenteeism Crisis 30 ...
Presentation by Andreas Schleicher Tackling the School Absenteeism Crisis 30 ...
 
Measures of Central Tendency: Mean, Median and Mode
Measures of Central Tendency: Mean, Median and ModeMeasures of Central Tendency: Mean, Median and Mode
Measures of Central Tendency: Mean, Median and Mode
 
microwave assisted reaction. General introduction
microwave assisted reaction. General introductionmicrowave assisted reaction. General introduction
microwave assisted reaction. General introduction
 
Advanced Views - Calendar View in Odoo 17
Advanced Views - Calendar View in Odoo 17Advanced Views - Calendar View in Odoo 17
Advanced Views - Calendar View in Odoo 17
 
Introduction to Nonprofit Accounting: The Basics
Introduction to Nonprofit Accounting: The BasicsIntroduction to Nonprofit Accounting: The Basics
Introduction to Nonprofit Accounting: The Basics
 
Q4-W6-Restating Informational Text Grade 3
Q4-W6-Restating Informational Text Grade 3Q4-W6-Restating Informational Text Grade 3
Q4-W6-Restating Informational Text Grade 3
 
IGNOU MSCCFT and PGDCFT Exam Question Pattern: MCFT003 Counselling and Family...
IGNOU MSCCFT and PGDCFT Exam Question Pattern: MCFT003 Counselling and Family...IGNOU MSCCFT and PGDCFT Exam Question Pattern: MCFT003 Counselling and Family...
IGNOU MSCCFT and PGDCFT Exam Question Pattern: MCFT003 Counselling and Family...
 
Student login on Anyboli platform.helpin
Student login on Anyboli platform.helpinStudent login on Anyboli platform.helpin
Student login on Anyboli platform.helpin
 
fourth grading exam for kindergarten in writing
fourth grading exam for kindergarten in writingfourth grading exam for kindergarten in writing
fourth grading exam for kindergarten in writing
 
Kisan Call Centre - To harness potential of ICT in Agriculture by answer farm...
Kisan Call Centre - To harness potential of ICT in Agriculture by answer farm...Kisan Call Centre - To harness potential of ICT in Agriculture by answer farm...
Kisan Call Centre - To harness potential of ICT in Agriculture by answer farm...
 
Nutritional Needs Presentation - HLTH 104
Nutritional Needs Presentation - HLTH 104Nutritional Needs Presentation - HLTH 104
Nutritional Needs Presentation - HLTH 104
 
Advance Mobile Application Development class 07
Advance Mobile Application Development class 07Advance Mobile Application Development class 07
Advance Mobile Application Development class 07
 
Unit-IV- Pharma. Marketing Channels.pptx
Unit-IV- Pharma. Marketing Channels.pptxUnit-IV- Pharma. Marketing Channels.pptx
Unit-IV- Pharma. Marketing Channels.pptx
 
Mattingly "AI & Prompt Design: The Basics of Prompt Design"
Mattingly "AI & Prompt Design: The Basics of Prompt Design"Mattingly "AI & Prompt Design: The Basics of Prompt Design"
Mattingly "AI & Prompt Design: The Basics of Prompt Design"
 
The Most Excellent Way | 1 Corinthians 13
The Most Excellent Way | 1 Corinthians 13The Most Excellent Way | 1 Corinthians 13
The Most Excellent Way | 1 Corinthians 13
 
A Critique of the Proposed National Education Policy Reform
A Critique of the Proposed National Education Policy ReformA Critique of the Proposed National Education Policy Reform
A Critique of the Proposed National Education Policy Reform
 

Appendix 1Final Project Overview and TimelineFinal Project O.docx

  • 1. Appendix 1 Final Project Overview and Timeline Final Project Overview The final project for XACC 280 is a 1,750 to 2,050-word (about 3 pages, double spaced) paper in which you provide a comprehensive analysis of the financial health of McDonald’s Corporation and whether or not you would invest in McDonald’s Corporation based on the information provided for 2009 and 2010 in their 2010 Annual Financial Report. The paper, with in-text citations and references, must follow APA formatting guidelines. NOTE: The word count does NOT include the charts and calculations at the end of your paper. Papers need to include: a cover page, section titles, in-text citations, reference page. Your papers should also be edited to remove spelling errors/word errors (using defiantly instead of definitely for example), paragraph breaks (not one long paragraph), double-spaced, good sentence structure and clearly stated and well supported (with sources) points. The final project is designed so you can apply the concepts and skills learned in this course to a real-life financial accounting analysis. It incorporates your foundational knowledge— resulting from completion of Discussion questions, Check Points, Exercises, and Assignments—into a paper that describes your financial analyses and conclusion. When navigating each week, keep your final project in mind to help you to prepare and gather needed information. The paper will include the following (do NOT include calculations within the paper, only the results should be stated and discussed). All calculations should be formatted and included after the concluding paragraph (see below): Before you begin writing, complete and review all of your
  • 2. calculations first since you will need the results to include in the writing of your paper. · An introductory paragraph with: · A statement of the purpose of your paper. · A synopsis of what readers can expect to find in the paper. It is best to write this after writing the rest of the paper. · Your explanation of your calculated results in words of at least two Vertical analyses for McDonald’s Corporation. · Your explanation in words of at least two Horizontal analyses for McDonald’s Corporation. · Your explanation in words of at least two of each of the Ratio analyses for McDonald’s Corporation, including a test of: · Explain in words your calculated results of the two ratio tests of Liquidity. · Explain in words your calculated results of the two ratio tests of Solvency. · Explain in words your calculated results of the two ratio tests of Profitability. · NOTE: ONLY USE THE RATIOS PROVIDED IN OUR TEXT (pg 716 – Illustration 15-27), NOT AS A RESULT OF GOOGLE SEARCHES. · Describe and clearly explain at least two strengths in different areas for McDonald’s Corporation other than using the revenue or net income information. · Incorporate the data and other information you used to determine each area of strength. · Describe and clearly explain at least two areas of improvement that McDonald’s Corporation should make to improve its
  • 3. financial health. There can be other nonfinancial areas that fast food stores can improve, but be sure to clearly link these areas to how they would improve McDonald’s financial health. · Incorporate the data and other information you used to determine each area of improvement. · If you had money to invest in a company, describe whether or not you would invest in McDonald’s Corporation stock and clearly explain your reasons. State at least two reasons (different from your list of strengths above). Support those reasons with factual information and include the source(s). Your opinion is important, but your opinion should be supported with factual information either from the Annual Report, articles about McDonald’s Corporation or even comparative data from another fast food chain (include the source). (Resist the urge to say you would not invest because you would use the money for something else or that you do not understand investing). All responses must be in the context of McDonald’s financial position in order to earn credit.) · A concluding paragraph that summarizes your paper. This should be a separate paragraph at the end of your paper. · After your conclusion in a separate section, include your calculations for all of the analyses and ratios. · Vertical - You can use your calculations from the Week 7 Check Point, providing you show your work. · Horizontal - You can use your calculations from the Week 7 Check Point, providing you show your work. · Liquidity - You can use the Current Ratios you computed in the Week 7 Check Point and select another ratio from that section on pg 716. Show your work. · Solvency - Use the two ratios on pg 716 in that section and show your work. · Profitability - Use at least two ratios from that section on pg 716 and show your work. · After your calculations, then include the list of your references.
  • 4. Final Project Timeline You should budget your time wisely and work on your project throughout the course. As outlined below, you will receive the information in the course to assist you in creating your final project. If you fulfill the requirements of the course activities (including reading the chapters, asking questions, practicing, participating in discussion and completing the assigned work) and use the feedback provided by the instructor, you will be on the right track to successfully complete your project. · Suggested in Week One: After you complete the chapter reading for Week 1, you will have some notions about what each of the four financial statements can tell you about a company. Although not part of the assignments for this week, you can look at the McDonald’s Corporation 2010 Annual report (in the link at the bottom of this page) to identify the financial statements. List for yourself the page numbers and information you think might be important to your analysis later on. · Suggested in Week Six: After you view the two PhxKlips™ Financial Statements and Income Statements for the Exercise, reexamine the 2010 Annual Report for McDonald’s Corporation to locate the financial statements that provide data for your analysis in the final project. Add this to your notes from Week One. In completing the comprehensive Application in Week Six, you develop financial statements from raw data. Make sure you can trace how data is derived on a financial statement, and its meaning. · Due in Week Seven: In participating in the discussion and reading the chapters in Week Seven, you select ratios that you think are the most important. You use vertical, horizontal, or ratio analyses to assess the financial health of McDonald’s Corporation. Take notes from the discussions and the chapter reading to prepare you to use the tools of analysis you will
  • 5. employ in the final project. This is a great time to ask questions about the ratios and analysis so that you understand the meaning behind the numbers you calculate because this will be included in your paper. The Check Point in Week Seven requires that you perform rudimentary vertical, horizontal and one of the ratio analyses on McDonald’s Corporation, the company you will analyze in your final project. You can use the ratios you develop here as the basis for your financial analysis in the project in addition to including the others that are required. You can select additional data you would analyze. It is suggested that you begin the analyses for the final project now. · Suggested in Week Eight: Continue working through the analyses you started in Week Seven and begin to finalize the rest of the required ratios on solvency and profitability and the second one for liquidity. Make sure you know where to get the numbers for your ratios from the annual report and that you understand what format the answers need to be shown. · Due in Week Nine: Submit your final project. Submit one Word file with the calculations included, keeping in mind that the word count does NOT include the calculations. Link to McDonald’s Corporation 2010 Annual Report http://www.aboutmcdonalds.com/content/dam/AboutMcDonalds/ Investors/C-%5Cfakepath%5Cinvestors-2010-annual-report.pdf You can also access by doing the following: Go to www.mcdonalds.com Go to Our Story, then to Corporate Information, then to Investors, then to Annual Reports Click on the link for the 2010 Annual Report XACC 280
  • 6. 2010 Annual Report McDonald’s Corporation One McDonald’s Plaza Oak Brook, IL 60523 www.aboutmcdonalds.com 2010 Highlights: Global Comparable Sales Growth 5.0% Earnings Per Share Growth 11% Average Number of Customers Served Every Day 64 Million Jim Skinner Vice Chairman and CEO
  • 7. 3-Year Compound Annual Total Return (2008–2010) S&P 500 DJIA 12.7%MCD -1.6% -2.9% Operating Income (In billions) $6.4 $6.8 $7.5 ’08 ’09 ’10 To Our Valued Shareholders: It’s been said the real secret to success is sustaining it … and that’s what McDonald’s did in 2010. We began the year determined to build on our momentum and strengthen our brand around the world. So with the
  • 8. business environment still challenging — and with many others forced to hold their ground — we pushed ahead. We dug for deeper consumer insights, aligned our strate- gies, and strengthened the pillars of our business, from our menu and restaurants to our value and convenience. The result was another banner year for McDonald’s. Global comparable sales increased 5% in 2010 — our eighth consecutive year of same store sales growth. Operating income grew 9% and we continued to gain market share around the world. In addition, we returned $5.1 billion to shareholders through share repurchases and dividends paid, and we provided a 27% return to investors for the year, ranking us third among the companies comprising the Dow Jones Industrial Average. Our success remains global, with all areas of the world contributing significantly to our results. In the U.S., comparable sales increased 3.8%, while guest count growth reached all-time highs. A record number of customers visited our restaurants and drive-thrus across the U.S., even as overall dining-out traffic remained flat. Europe grew comparable sales by 4.4% and also increased guest counts — serving 200 million more customers than the year before. Asia/ Pacific, Middle East and Africa continued to make a strong impact to our overall results with higher guest counts and 6% comparable sales growth. We achieved all of this through our Plan to Win, which has served as our strategic blueprint for the past eight years. The plan focuses on the core drivers of our business — People, Products, Place, Price, and Promotion, or the five “P’s.” I often say the opportunity within each “P” is enormous — and we intend to go after it. To that end, we continue to focus on the right priorities to keep our brand relevant and meet the evolv- ing needs of our customers. This approach has served us
  • 9. remarkably well and will continue to do so in 2011 and beyond. McDonald’s Corporation Annual Report 2010 1 Our results could not have been achieved without the performance of our highly talented management team. They are focused, aligned, and committed to raising the bar in everything we do. President and Chief Operating Officer Don Thompson and our senior leadership operate with tremendous insight and a keen sense for how to drive continued growth. In addition, our exceptional Board of Directors provides strong corporate governance and knowledgeable perspectives as we continue to deliver shareholder value. Meanwhile, the entire McDonald’s System is thriving. Our world-class franchisees continue to invest in their restaurants and their people in order to elevate the entire customer experience, resulting in significant increases in cash flow. Our suppliers perform what I like to call the McDonald’s Daily Miracle — providing 32,000 restaurants an assured supply of safe, high-quality products at competitive prices, with ever improving efficiency. Lastly, our highly experienced company employees worked smarter to propel our business forward. With the powerful alignment of our System and the Plan to Win as the foundation, we will continue our winning formula: building on the basics as we further modernize and differenti- ate the brand. As always, running better restaurants is our number one priority. We will improve operations excellence around the world through new technology, better training, and service
  • 10. enhancements that will make it easier for our managers and crew to quickly and accurately serve the customer. At the same time, our brand is more contemporary and convenient and provides great value with menus that feature all of our iconic favorites — from our Big Mac sandwiches to French fries — along with local offerings and new products that today’s consumers want. Whether it’s McWraps in Europe, Angus Burgers in Australia, or McCafé specialty coffees and smoothies in the U.S., we are strategically enhancing our menu to appeal to more customers more often. 92 Consecutive months of global comparable sales increases through December 2010 2 McDonald’s Corporation Annual Report 2010 We are moving ahead with the reimaging of our restaurant interiors and exteriors to create an even more modern and inviting dining atmosphere. Around the world, we are re-invigorating our restaurants with local and relevant new designs that keep the spirit of our brand alive and delight our guests with a fresh look and contemporary appeal. Of course, we must continue to lead in ways that positively impact the trust in our brand. It starts with delivering a great restaurant experience every time and extends to a host of areas to which we are strongly committed — from charitable giving and supporting the communities we serve, to environmental stewardship and animal welfare. In addition, we provide our customers with a variety of menu
  • 11. options that address balance and choice. We will keep listening to our customers, engaging our stakeholders, and embracing the responsibility that comes with being a socially responsible brand. As McDonald’s Chief Executive Officer, I am immensely proud of our performance and confident in our ability to continue our growth. The secret to our success is staying focused on the execution in our restaurants on behalf of our customers. As always, thank you for your investment in McDonald’s. I appreciate your support and look forward to sharing further success with you. Sincerely, Jim Skinner Vice Chairman and CEO McDonald’s Corporation Annual Report 2010 3 Combined Operating Margin 27.4% 30.1% 31.0% ’08 ’09 ’10 Earnings Per Share
  • 12. $3.76 $4.11 $4.58 ’08 ’09 ’10 Dividends Paid (In billions) $1.8 $2.2 $2.4 ’08 ’09 ’10 Dear Fellow Shareholders: McDonald’s Corporation achieved another year of strong results in 2010, as we continued to strengthen our connection
  • 13. with customers around the world. We maintained our momentum and increased sales amid a still challenging environment for many. Working within the framework of our proven Plan to Win strategy, McDonald’s showed flexibility, decisiveness, and strong business acumen in meeting the evolving needs of consumers and staying in step with their lives. Your Board of Directors believes this is a testament to the strength of the McDonald’s System, what we refer to as our “three-legged stool.” Under the leadership of Vice Chairman and CEO Jim Skinner, all three legs of the stool — franchisees, suppliers and employees — continue to be firmly aligned behind the Plan to Win. This stability has been key to sustaining McDonald’s successful performance and to achieving an impressive eight years of increasing global comparable sales. Jim continues to lead our company with tremendous skill and a deep passion for the brand. His global leadership team, with its deep insights into the operation of our three-legged stool, gives us a true competitive advantage in our efforts to evolve and elevate the McDonald’s customer experience. The Board of Directors is pleased with McDonald’s performance and its plans moving forward. We believe the company has a clear vision — and the right people and strategies in place —for building our business even further and delivering profitable growth into the future. As to our Board responsibilities, we remain committed to overseeing the company’s direction and promoting strong corporate governance principles and effective management oversight. Our team of experienced and diverse directors is eager to continue doing its part to help strengthen McDonald’s and deliver shareholder value.
  • 14. It is our honor and privilege to serve on behalf of you, our shareholders, and we look forward to the days ahead for this great brand. Very truly yours, Andy McKenna Chairman Andy McKenna Chairman 4 McDonald’s Corporation Annual Report 2010 2010 Financial Report 2010 Financial Report 7 6-year Summary 8 Stock Performance Graph 9 Management’s Discussion and Analysis of Financial Condition and Results of Operations 26 Consolidated Statement of Income 27 Consolidated Balance Sheet 28 Consolidated Statement of Cash Flows 29 Consolidated Statement of Shareholders’ Equity 30 Notes to Consolidated Financial Statements 42 Quarterly Results (Unaudited) 43 Management’s Assessment of Internal Control over Financial Reporting
  • 15. 44 Report of Independent Registered Public Accounting Firm 45 Report of Independent Registered Public Accounting Firm on Internal Control over Financial Reporting 46 Executive Management & Business Unit Officers 47 Board of Directors 48 Investor Information 6 McDonald’s Corporation Annual Report 2010 6-Year Summary Dollars in millions, except per share data 2010 2009 2008 2007 2006 2005 Company-operated sales $16,233 15,459 16,561 16,611 15,402 14,018 Franchised revenues $ 7,842 7,286 6,961 6,176 5,493 5,099 Total revenues $24,075 22,745 23,522 22,787 20,895 19,117 Operating income $ 7,473(1) 6,841(2) 6,443 3,879(5) 4,433(8) 3,984 Income from continuing operations $ 4,946(1) 4,551(2,3) 4,313(4) 2,335(5,6) 2,866(8) 2,578(10) Net income $ 4,946(1) 4,551(2,3) 4,313(4) 2,395(5,6,7)3,544(8,9) 2,602(10) Cash provided by operations $ 6,342 5,751 5,917 4,876 4,341 4,337 Cash used for investing activities $ 2,056 1,655 1,625 1,150 1,274 1,818 Capital expenditures $ 2,136 1,952 2,136 1,947 1,742 1,607 Cash used for (provided by) financing activities $ 3,729 4,421 4,115 3,996 5,460 (442) Treasury stock repurchased(11) $ 2,648 2,854 3,981 3,949 3,719
  • 16. 1,228 Common stock cash dividends $ 2,408 2,235 1,823 1,766 1,217 842 Financial position at year end: Total assets $31,975 30,225 28,462 29,392 28,974 29,989 Total debt $11,505 10,578 10,218 9,301 8,408 10,137 Total shareholders’ equity $14,634 14,034 13,383 15,280 15,458 15,146 Shares outstanding in millions 1,054 1,077 1,115 1,165 1,204 1,263 Per common share: Income from continuing operations–diluted $ 4.58(1) 4.11(2,3) 3.76(4) 1.93(5,6) 2.29(8) 2.02(10) Net income–diluted $ 4.58(1) 4.11(2,3) 3.76(4) 1.98(5,6,7) 2.83(8,9) 2.04(10) Dividends declared $ 2.26 2.05 1.63 1.50 1.00 0.67 Market price at year end $ 76.76 62.44 62.19 58.91 44.33 33.72 Company-operated restaurants 6,399 6,262 6,502 6,906 8,166 8,173 Franchised restaurants 26,338 26,216 25,465 24,471 22,880 22,593 Total Systemwide restaurants 32,737 32,478 31,967 31,377 31,046 30,766 Franchised sales(12) $61,147 56,928 54,132 46,943 41,380 38,913 (1) Includes net pretax expense due to Impairment and other charges (credits), net of $29.1 million ($24.6 million after tax or $0.02 per share) primarily related to the Company’s share of restaurant closing costs in McDonald’s Japan (a 50%-owned affiliate) partially offset by income primarily related to the resolution of certain liabilities retained in connection with the 2007 Latin America developmental license transaction.
  • 17. (2) Includes net pretax income due to Impairment and other charges (credits), net of $61.1 million ($91.4 million after tax or $0.08 per share) primarily related to the resolution of certain liabilities retained in connection with the 2007 Latin America developmental license transaction. (3) Includes income of $58.8 million ($0.05 per share) in Gain on sale of investment related to the sale of the Company’s minority ownership interest in Redbox Automated Retail, LLC. (4) Includes income of $109.0 million ($0.09 per share) in Gain on sale of investment from the sale of the Company’s minority ownership interest in U.K.-based Pret A Manger. (5) Includes pretax operating charges of $1.7 billion ($1.32 per share) due to Impairment and other charges (credits), net primarily as a result of the Company’s sale of its businesses in 18 Latin American and Caribbean markets to a developmental licensee. (6) Includes a tax benefit of $316.4 million ($0.26 per share) resulting from the completion of an Internal Revenue Service (IRS) examination of the Company’s 2003-2004 U.S. federal tax returns. (7) Includes income of $60.1 million ($0.05 per share) related to discontinued operations primarily from the sale of the Company’s investment in Boston Market. (8) Includes pretax operating charges of $134 million ($98 million after tax or $0.08 per share) due to Impairment and other charges (credits), net. (9) Includes income of $678 million ($0.54 per share) related to discontinued operations primarily resulting from the disposal of
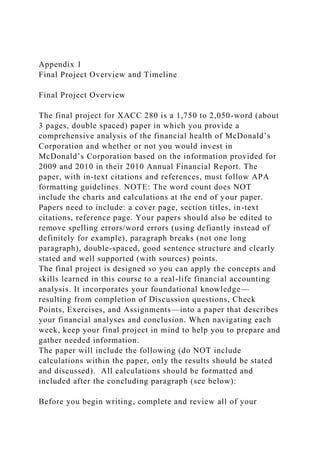
  • 18. the Company’s investment in Chipotle. (10) Includes a net tax benefit of $73 million ($0.05 per share) comprised of $179 million ($0.14 per share) of income tax benefit resulting from the completion of an IRS examination of the Company’s 2000-2002 U.S. tax returns, partly offset by $106 million ($0.09 per share) of incremental tax expense resulting from the decision to repatriate certain foreign earnings under the Homeland Investment Act (HIA). (11) Represents treasury stock purchases as reflected in Shareholders’ equity. (12) While franchised sales are not recorded as revenues by the Company, management believes they are important in understanding the Company’s financial performance because these sales are the basis on which the Company calculates and records franchised revenues and are indicative of the financial health of the franchisee base. McDonald’s Corporation Annual Report 2010 7 Stock performance graph At least annually, we consider which companies comprise a read- ily identifiable investment peer group. McDonald’s is included in published restaurant indices; however, unlike most other compa- nies included in these indices, which have no or limited international operations, McDonald’s does business in more than
  • 19. 100 countries and a substantial portion of our revenues and income is generated outside the U.S. In addition, because of our size, McDonald’s inclusion in those indices tends to skew the results. Therefore, we believe that such a comparison is not meaningful. Our market capitalization, trading volume and importance in an industry that is vital to the U.S. economy have resulted in McDo- nald’s inclusion in the Dow Jones Industrial Average (DJIA) since 1985. Like McDonald’s, many DJIA companies generate mean- ingful revenues and income outside the U.S. and some manage global brands. Thus, we believe that the use of the DJIA compa- nies as the group for comparison purposes is appropriate. The following performance graph shows McDonald’s cumulative total shareholder returns (i.e., price appreciation and reinvestment of dividends) relative to the Standard & Poor’s 500 Stock Index (S&P 500 Index) and to the DJIA companies for the five-year period ended December 31, 2010. The graph assumes that the value of an investment in McDonald’s common stock, the S&P 500 Index and the DJIA companies (including McDonald’s) was $100 at December 31, 2005. For the DJIA companies, returns are weighted for market capitalization as of the beginning of each period indicated. These returns may vary from those of the Dow Jones Industrial Average Index, which is not weighted by market capitalization, and may be composed of different compa- nies during the period under consideration. COMPARISON OF CUMULATIVE FIVE YEAR TOTAL RETURN
  • 20. Dec '05 '06 '07 '08 '10'09 McDonald's Corporation S&P 500 Index Dow Jones Industrials $0 $50 $100 $150 $200 $300 $250 100 135 183 199 207 263 100 116 122 77 97 112 100 119 130 88 108 123 Source: Capital IQ, a Standard & Poor’s business 8 McDonald’s Corporation Annual Report 2010 Management’s Discussion and Analysis of Financial Condition and Results of Operations Overview DESCRIPTION OF THE BUSINESS
  • 21. The Company franchises and operates McDonald’s restaurants. Of the 32,737 restaurants in 117 countries at year-end 2010, 26,338 were franchised or licensed (including 19,279 franchised to conventional franchisees, 3,485 licensed to developmental licensees and 3,574 licensed to foreign affiliates (affiliates)— primarily Japan) and 6,399 were operated by the Company. Under our conventional franchise arrangement, franchisees pro- vide a portion of the capital required by initially investing in the equipment, signs, seating and décor of their restaurant busi- nesses, and by reinvesting in the business over time. The Company owns the land and building or secures long-term leases for both Company-operated and conventional franchised restau- rant sites. This maintains long-term occupancy rights, helps control related costs and assists in alignment with franchisees. In certain circumstances, the Company participates in reinvestment for conventional franchised restaurants. Under our developmental license arrangement, licensees provide capital for the entire business, including the real estate interest, and the Company has no capital invested. In addition, the Company has an equity investment in a limited number of affiliates that invest in real estate and operate and/or franchise restaurants within a market. We view ourselves primarily as a franchisor and believe fran- chising is important to delivering great, locally-relevant customer experiences and driving profitability. However, directly operating restaurants is paramount to being a credible franchisor and is essential to providing Company personnel with restaurant oper- ations experience. In our Company-operated restaurants, and in collaboration with franchisees, we further develop and refine operating standards, marketing concepts and product and pricing
  • 22. strategies, so that only those that we believe are most beneficial are introduced in the restaurants. We continually review, and as appropriate adjust, our mix of Company-operated and franchised (conventional franchised, developmental licensed and foreign affiliated) restaurants to help optimize overall performance. The Company’s revenues consist of sales by Company- operated restaurants and fees from restaurants operated by franchisees. Revenues from conventional franchised restaurants include rent and royalties based on a percent of sales along with minimum rent payments, and initial fees. Revenues from restau- rants licensed to affiliates and developmental licensees include a royalty based on a percent of sales, and generally include initial fees. Fees vary by type of site, amount of Company investment, if any, and local business conditions. These fees, along with occu- pancy and operating rights, are stipulated in franchise/license agreements that generally have 20-year terms. The business is managed as distinct geographic segments. Significant reportable segments include the United States (U.S.), Europe, and Asia/Pacific, Middle East and Africa (APMEA). In addition, throughout this report we present “Other Countries & Corporate” that includes operations in Canada and Latin America, as well as Corporate activities. The U.S., Europe and APMEA segments account for 34%, 40% and 21% of total revenues, respectively. The United Kingdom (U.K.), France and Germany, collectively, account for over 50% of Europe’s revenues; and China, Australia and Japan (a 50%-owned affiliate accounted for under the equity method), collectively, account for over 50% of APMEA’s revenues. These six markets along with the U.S. and
  • 23. Canada are referred to as “major markets” throughout this report and comprise approximately 70% of total revenues. The Company continues to focus its management and finan- cial resources on the McDonald’s restaurant business as we believe significant opportunities remain for long-term growth. Accordingly, in 2009, the Company sold its minority ownership interest in Redbox Automated Retail, LLC (Redbox) for total consideration of $140 million. In 2008, the Company sold its minority ownership interest in U.K.-based Pret A Manger for cash proceeds of $229 million. In connection with both sales, the Company recognized nonoperating gains. In analyzing business trends, management considers a variety of performance and financial measures, including comparable sales and comparable guest count growth, Systemwide sales growth and returns. • Constant currency results exclude the effects of foreign cur- rency translation and are calculated by translating current year results at prior year average exchange rates. Management reviews and analyzes business results in constant currencies and bases certain incentive compensation plans on these results because we believe this better represents the Compa- ny’s underlying business trends. • Comparable sales and comparable guest counts are key per- formance indicators used within the retail industry and are indicative of acceptance of the Company’s initiatives as well as local economic and consumer trends. Increases or decreases in comparable sales and comparable guest counts represent the percent change in sales and transactions, respectively, from the same period in the prior year for all restaurants in operation at least thirteen months, including those temporarily
  • 24. closed. Some of the reasons restaurants may be temporarily closed include reimaging or remodeling, rebuilding, road con- struction and natural disasters. Comparable sales exclude the impact of currency translation. McDonald’s reports on a calen- dar basis and therefore the comparability of the same month, quarter and year with the corresponding period of the prior year will be impacted by the mix of days. The number of week- days and weekend days in a given timeframe can have a positive or negative impact on comparable sales and guest counts. The Company refers to these impacts as calendar shift/trading day adjustments. In addition, the timing of holidays can impact comparable sales and guest counts. These impacts vary geographically due to consumer spending patterns and have the greatest effect on monthly comparable sales and guest counts while the annual impacts are typically minimal. In 2008, there was an incremental full day of sales and guest counts due to leap year. • Systemwide sales include sales at all restaurants, whether operated by the Company or by franchisees. While franchised sales are not recorded as revenues by the Company, manage- ment believes the information is important in understanding the Company’s financial performance because these sales are the basis on which the Company calculates and records franchised revenues and are indicative of the financial health of the fran- chisee base. McDonald’s Corporation Annual Report 2010 9 • Return on incremental invested capital (ROIIC) is a measure reviewed by management over one-year and three-year time periods to evaluate the overall profitability of the business units, the effectiveness of capital deployed and the future allo-
  • 25. cation of capital. The return is calculated by dividing the change in operating income plus depreciation and amortization (numerator) by the adjusted cash used for investing activities (denominator), primarily capital expenditures. The calculation uses a constant average foreign exchange rate over the peri- ods included in the calculation. STRATEGIC DIRECTION AND FINANCIAL PERFORMANCE The strength of the alignment among the Company, its franchi- sees and suppliers (collectively referred to as the System) has been key to McDonald’s success. This business model enables McDonald’s to deliver consistent, locally-relevant restaurant experiences to customers and be an integral part of the commun- ities we serve. In addition, it facilitates our ability to identify, implement and scale innovative ideas that meet customers’ changing needs and preferences. McDonald’s customer-focused Plan to Win—which concen- trates on being better, not just bigger—provides a common framework for our global business yet allows for local adaptation. Through the execution of initiatives surrounding the five elements of our Plan to Win—People, Products, Place, Price and Promo- tion—we have enhanced the restaurant experience for customers worldwide and grown comparable sales and customer visits in each of the last seven years. This Plan, combined with financial discipline, has delivered strong results for our shareholders. We have exceeded our long-term, constant currency financial targets of average annual Systemwide sales growth of 3% to 5%; average annual operating income growth of 6% to 7%; and annual returns on incremental invested capital in the high teens every year since the Plan’s implementation in 2003, after adjust-
  • 26. ing for the loss in 2007 from the Latin America developmental license transaction. Given the size and scope of our global busi- ness, we believe these financial targets are realistic and sustainable over time, keeping us focused on making the best decisions for the long-term benefit of our System. In 2010, we continued to enhance the customer experience by remaining focused on the Company’s key global success fac- tors of branded affordability, menu variety and beverage choice, convenience including daypart expansion, ongoing restaurant reinvestment and operations excellence. Initiatives around these factors successfully resonated with consumers driving increases in sales and customer visits despite challenging economies and a contracting Informal Eating Out (IEO) market in many countries. As a result, every area of the world contributed to 2010 global comparable sales and guest counts, which increased 5.0% and 4.9%, respectively. Growth in comparable sales is driven by the System’s ability to optimize guest count growth, product mix shifts and menu price changes. Pricing actions reflect local market conditions, with a view to preserving and improving margins, while continuing to drive guest counts and market share gains. In general, the goal is to achieve a balanced contribution of price and guest counts to comparable sales growth. In the U.S., we grew sales, guest counts, market share and restaurant cash flow, with comparable sales increasing for the 8th consecutive year, rising 3.8% in 2010. These positive results were achieved despite a declining IEO market. This
  • 27. performance was attributed to several factors including core menu items like Chicken McNuggets and burgers, everyday affordability and value options, such as the Breakfast Dollar Menu, additions to the McCafé beverage line, new snack offerings and limited time offerings such as the McRib sandwich. The national launch of McCafé frappés and real-fruit smoothies provided a meaningful extension to the McCafé line that was well-received by custom- ers. Extending the snack wrap line with the Angus Snack Wraps allowed customers to enjoy popular McDonald’s burgers in a smaller, more portable fashion. Complementing these menu offerings were our convenient locations, efficient drive-thru serv- ice and value-oriented local beverage promotions. We broadened our accessibility through greater 24 hour operations and offered customers free Wi-Fi in over 12,000 restaurants. Modernizing the customer experience remained a focus with the extension of our interior and exterior reimaging program to enhance the appear- ance and functionality of our restaurants. In Europe, comparable sales rose 4.4%, marking the 7th consecutive year of comparable sales increases. Major contrib- utors were France, the U.K., Russia and Germany. This performance reflected Europe’s strategic priorities of upgrading the customer and employee experience, increasing local rele- vance, and building brand transparency. Initiatives surrounding these platforms included leveraging our tiered menu featuring everyday affordable prices, menu variety including limited-time offerings, new dessert options, and reimaging almost 1,000 res- taurants. We expanded our coffee business and have nearly 1,300 McCafé locations, which in Europe generally represent a separate area inside the restaurant that serves specialty coffees,
  • 28. indulgent desserts and light snacks. The expansion of self-order kiosks in France, Germany and Spain and the roll out of the new drive-thru customer order display system in over 3,000 restau- rants enhanced service. In addition, we increased our accessibility and convenience with extended hours. We built upon the momentum of portable menu offerings with the introduction of McWraps—larger sized beef and chicken wraps in Germany, and P’tit Plaisir offerings in France. Finally, we continued building customer trust in our brand through communications that emphasized the quality and origin of McDonald’s food and our sustainable business initiatives. In APMEA, our momentum continued with nearly every coun- try delivering positive comparable sales, led by Japan, Australia and China. Comparable sales rose 6.0% through strategies emphasizing value, core menu extensions, breakfast and con- venience. Australia launched Family Dinner Boxes featuring popular menu items bundled together at a discounted price while China and Japan concentrated on affordability with Value Lunch platforms. New menu items such as a third Angus burger option in Australia and the extension of the Spicy Wings line in China were popular with consumers. Japan executed a successful U.S.-themed burger promotion and a Chicken Festival promotion featuring several products. Our dessert strategy is introducing consumers to the McDonald’s brand with products such as McFlurries and dessert kiosks in China, where we have become one of the largest retailers of ice cream. Our breakfast business continues to develop and is now offered in approximately 75% of APMEA restaurants. In Japan, value breakfast items, including the Sausage McMuffin and McGriddle, were rotated across sev- eral months, while Australia launched new breakfast menu
  • 29. items. 10 McDonald’s Corporation Annual Report 2010 Nearly two-thirds of APMEA restaurants are now offering some form of extended hours and over 4,800 restaurants are open 24 hours. Delivery is offered in many APMEA markets and is now in approximately 1,600 restaurants, including nearly 400 in China. We continue to offer value to our customers by utilizing a stra- tegic menu pricing tool that optimizes price, product mix, and promotions. This approach is complemented by a focus on driving operating efficiencies and effectively managing restaurant-level food and paper costs by leveraging our scale, supply chain infra- structure and risk management practices. Our ability to execute our strategies successfully in every area of the world, grow comparable sales, leverage a low commodity cost environment and control selling, general & administrative expenses resulted in consolidated combined operating margin (operating income as a percent of total revenues) of 31.0% in 2010, an improvement of 0.9 percentage points over 2009. In 2010, strong global sales and margin performance grew cash from operations, which rose $591 million to $6.3 billion. Our substantial cash flow, strong credit rating and continued access to credit provide us significant flexibility to fund capital expenditures and debt repayments as well as return cash to shareholders. Capital expenditures of approximately $2.1 billion were invested in our business primarily to open and reimage
  • 30. restaurants. Across the System, nearly 1,000 restaurants were opened and nearly 1,800 existing locations were reimaged. We returned $5.1 billion to shareholders consisting of $2.4 billion in dividends and nearly $2.7 billion in share repurchases. Cash from operations continues to benefit from our heavily franchised business model as the rent and royalty income received from owner/operators provides a very stable revenue stream that has relatively low costs. In addition, the franchise business model is less capital intensive than the Company- owned model. We believe locally-owned and operated restaurants maximize brand performance and are at the core of our competitive advantage, making McDonald’s not just a global brand, but also a locally relevant one. HIGHLIGHTS FROM THE YEAR INCLUDED: • Comparable sales grew 5.0% and guest counts rose 4.9%, building on 2009 increases of 3.8% and 1.4%, respectively. • Revenues increased 6% (5% in constant currencies). • Company-operated margins improved to 19.6% and franchised margins improved to 82.4%. • Operating income increased 9% (9% in constant currencies). • Earnings per share was $4.58, an increase of 11%. • Cash provided by operations increased $591 million to $6.3 billion. • The Company increased the quarterly cash dividend per share 11% to $0.61 for the fourth quarter–bringing our current
  • 31. annual dividend rate to $2.44 per share. • One-year ROIIC was 37.3% and three-year ROIIC was 38.3% for the period ended December 31, 2010 (see reconciliation on Page 25). • The Company returned $5.1 billion to shareholders through share repurchases and dividends paid. OUTLOOK FOR 2011 We will continue to drive success in 2011 and beyond by enhanc- ing customer relevance across all elements of our Plan to Win— People, Products, Place, Price and Promotion. Our global System continues to be energized by our ongoing momentum and sig- nificant growth opportunities. We continue to hold a strong competitive position in the market place, and we intend to further differentiate our brand by striving to become our customers’ favorite place and way to eat and drink. We will continue growing market share by executing our key strategies in the following areas: optimizing our menu, modernizing the customer experience and broadening our accessibility. These efforts will include increasing menu choice, expanding destination beverages and desserts, enhancing our food image, accelerating our interior and exterior reimaging efforts and increasing the level and variety of conveniences pro- vided to our customers. We will execute these priorities to increase McDonald’s brand relevance while continuing to prac- tice operational and financial discipline. Consequently, we are confident we can again meet or exceed our long-term constant currency financial targets.
  • 32. In the U.S., our 2011 focus will include highlighting core menu classics such as the Big Mac, Quarter Pounder with Cheese and Chicken McNuggets, emphasizing the convenient and affordable food offered every day, and encouraging the trial of new products including Fruit & Maple Oatmeal and additional McCafé beverage offerings. We will continue offering value across the menu through the Dollar Menu at breakfast and the rest of the day. Opportunities around additional staffing at peak hours and increasing restaurants that operate 24 hours per day will broaden accessibility to our customers. In addition, our plans to elevate the brand experience encompass updating our technology infrastructure with a new point-of-sale (POS) system, enhancing restaurant manager and crew retention and pro- ductivity, and contemporizing the interiors and exteriors of approximately 600 restaurants through reimaging. Our business in Europe will continue to be guided by three strategic priorities: increasing local relevance, upgrading the customer and employee experience, and building brand trans- parency. We will increase our local relevance by complementing our tiered menu with a variety of limited-time food events as well as new snack and dessert options. In 2011, we will reimage approximately 850 restaurants as we progress towards our goal of having 90% of our interiors and over 50% of our exteriors reimaged by the end of 2012. Reimaging reinforces the quality of our brand while further differentiating us from the competition. We will leverage service innovations with the deployment of technologies such as the new POS system, self-order kiosks, hand-held order devices and drive-thru customer order displays to enhance the customer experience and help drive increased
  • 33. transactions and labor efficiency. We believe there is an oppor- tunity to further build brand transparency by raising customer awareness about our food quality and product sourcing. In addi- tion, we will communicate our efforts to preserve the environment through our sustainable business initiatives. Our European busi- ness in 2011 faces some headwinds from government-initiated austerity measures being implemented in many countries. While we will closely monitor consumer reactions to these measures, we remain confident that our business model will continue to drive profitable growth. In APMEA, we will continue our efforts to become our customers’ first choice for eating out by focusing on menu varie- ty, value, restaurant experience and convenience. The markets will continue to execute against a combination of core menu McDonald’s Corporation Annual Report 2010 11 items, food events and limited-time offerings to present a bal- anced mix of products to our customers. Value will continue to be a key growth driver as we reinforce the affordability of our menu to consumers and build on our successful Value Lunch platforms. We will invest in our business primarily by opening over 600 new restaurants and reimaging over 500 existing restaurants while elevating our focus on service and operations to drive efficien- cies. In China, we will continue to build a foundation for long- term growth by increasing our base of restaurants by approximately
  • 34. 15% in 2011 toward our goal of nearly 2,000 restaurants by the end of 2013. Convenience initiatives include expanding delivery service across the region and building on the success of our extended operating hours. McDonald’s has an ongoing commitment to optimize our res- taurant ownership structure. A heavily franchised, less capital- intensive business model has favorable implications for the strength and stability of our cash flow, the amount of capital we invest and long-term returns. We continue to maintain a strong culture of financial dis- cipline by effectively managing all spending in order to maximize business performance. In making capital allocation decisions, our goal is to elevate the McDonald’s experience by driving sustain- able growth in sales and market share while earning strong returns. We remain committed to returning all of our free cash flow (cash from operations less capital expenditures) to share- holders over the long term via dividends and share repurchases. McDonald’s does not provide specific guidance on diluted earnings per share. The following information is provided to assist in analyzing the Company’s results: • Changes in Systemwide sales are driven by comparable sales and net restaurant unit expansion. The Company expects net restaurant additions to add approximately 1.5 percentage points to 2011 Systemwide sales growth (in constant currencies), most of which will be due to the 541 net traditional restaurants added in 2010. • The Company does not generally provide specific guidance on changes in comparable sales. However, as a perspective,
  • 35. assuming no change in cost structure, a 1 percentage point increase in comparable sales for either the U.S. or Europe would increase annual diluted earnings per share by about 3 cents. • With about 75% of McDonald’s grocery bill comprised of 10 different commodities, a basket of goods approach is the most comprehensive way to look at the Company’s commodity costs. For the full year 2011, the total basket of goods cost is expected to increase 2-2.5% in the U.S. and to increase 3.5-4.5% in Europe as compared to 2010. Some volatility may be experienced between quarters in the normal course of business. • The Company expects full-year 2011 selling, general & admin- istrative expenses to decrease 2-3%, in constant currencies, partly due to higher incentive compensation in 2010 based on performance. In addition, fluctuations will be experienced between quarters due to certain items in 2010, such as the Vancouver Winter Olympics in February and the biennial Worldwide Owner/Operator Convention in April. • Based on current interest and foreign currency exchange rates, the Company expects interest expense for the full year 2011 to increase approximately 7% compared with 2010. • A significant part of the Company’s operating income is gen- erated outside the U.S., and about 40% of its total debt is denominated in foreign currencies. Accordingly, earnings are affected by changes in foreign currency exchange rates, particularly the Euro, Australian Dollar, British Pound and Canadian Dollar. Collectively, these currencies represent approximately 65% of the Company’s operating income out- side the U.S. If all four of these currencies moved by 10% in the same direction, the Company’s annual diluted earnings per
  • 36. share would change by about 20 cents. • The Company expects the effective income tax rate for the full year 2011 to be approximately 30% to 32%. Some volatility may be experienced between the quarters resulting in a quar- terly tax rate that is outside the annual range. • The Company expects capital expenditures for 2011 to be approximately $2.5 billion. About half of this amount will be used to open new restaurants. The Company expects to open about 1,100 restaurants including about 400 restaurants in affiliated and developmental licensee markets, such as Japan and Latin America, where the Company does not fund any capital expenditures. The Company expects net additions of about 750 traditional restaurants. The remaining capital will be used for reinvestment in existing restaurants. Over half of this reinvestment will be used to reimage approximately 2,200 locations worldwide, some of which will require no capital investment from the Company. 12 McDonald’s Corporation Annual Report 2010 Consolidated Operating Results Operating results 2010 2009 2008 Dollars in millions, except per share data Amount Increase/ (decrease) Amount Increase/
  • 37. (decrease) Amount Revenues Sales by Company-operated restaurants $ 16,233 5% $ 15,459 (7)% $ 16,561 Revenues from franchised restaurants 7,842 8 7,286 5 6,961 Total revenues 24,075 6 22,745 (3) 23,522 Operating costs and expenses Company-operated restaurant expenses 13,060 3 12,651 (7) 13,653 Franchised restaurants—occupancy expenses 1,378 6 1,302 6 1,230 Selling, general & administrative expenses 2,333 4 2,234 (5) 2,355 Impairment and other charges (credits), net 29 nm (61) nm 6 Other operating (income) expense, net (198) 11 (222) (35) (165) Total operating costs and expenses 16,602 4 15,904 (7) 17,079 Operating income 7,473 9 6,841 6 6,443 Interest expense 451 (5) 473 (9) 523 Nonoperating (income) expense, net 22 nm (24) 69 (78) Gain on sale of investment nm (95) 41 (160) Income before provision for income taxes 7,000 8 6,487 5 6,158 Provision for income taxes 2,054 6 1,936 5 1,845 Net income $ 4,946 9% $ 4,551 6% $ 4,313 Earnings per common share—diluted $ 4.58 11% $ 4.11 9% $ 3.76 Weighted-average common shares outstanding—diluted 1,080.3 1,107.4 1,146.0 nm Not meaningful. IMPACT OF FOREIGN CURRENCY TRANSLATION ON REPORTED RESULTS
  • 38. While changing foreign currencies affect reported results, McDo- nald’s mitigates exposures, where practical, by financing in local currencies, hedging certain foreign-denominated cash flows, and purchasing goods and services in local currencies. In 2010, foreign currency translation had a positive impact on consolidated operating results driven by stronger global curren- cies, primarily the Australian Dollar and Canadian Dollar, partly offset by the weaker Euro. In 2009, foreign currency translation had a negative impact on consolidated operating results, primarily driven by the Euro, British Pound, Russian Ruble, Australian Dol- lar and Canadian Dollar. In 2008, foreign currency translation had a positive impact on consolidated operating results, driven by the stronger Euro and most other currencies, partly offset by the weaker British Pound. Impact of foreign currency translation on reported results Reported amount Currency translation benefit/(cost) In millions, except per share data 2010 2009 2008 2010 2009 2008 Revenues $24,075 $22,745 $23,522 $ 188 $(1,340) $ 441 Company-operated margins 3,173 2,807 2,908 35 (178) 63 Franchised margins 6,464 5,985 5,731 (14) (176) 120 Selling, general & administrative expenses 2,333 2,234 2,355 (12) 75 (21) Operating income 7,473 6,841 6,443 13 (273) 163
  • 39. Net income 4,946 4,551 4,313 13 (164) 103 Earnings per common share—diluted 4.58 4.11 3.76 0.01 (0.15) 0.09 NET INCOME AND DILUTED EARNINGS PER COMMON SHARE In 2010, net income and diluted earnings per common share were $4.9 billion and $4.58. Results for the year included after tax charges due to Impairment and other charges (credits), net of $25 million or $0.02 per share, primarily related to the Compa- ny’s share of restaurant closing costs in McDonald’s Japan (a 50%-owned affiliate) in conjunction with the first quarter strate- gic review of the market’s restaurant portfolio, partly offset by income related to the resolution of certain liabilities retained in connection with the 2007 Latin America developmental license transaction. Foreign currency translation had a positive impact of $0.01 per share on diluted earnings per share for the year. In 2009, net income and diluted earnings per common share were $4.6 billion and $4.11. Results benefited by after tax income due to Impairment and other charges (credits), net of $91 million or $0.08 per share, primarily due to the resolution of McDonald’s Corporation Annual Report 2010 13 certain liabilities retained in connection with the 2007 Latin America developmental license transaction. Results also bene- fited by an after tax gain of $59 million or $0.05 per share due
  • 40. to the sale of the Company’s minority ownership interest in Redbox, reflected in Gain on sale of investment. Results were negatively impacted by $0.15 per share due to the effect of foreign cur- rency translation. In 2008, net income and diluted earnings per common share were $4.3 billion and $3.76. Results benefited by a $109 million or $0.09 per share after tax gain on the sale of the Company’s minority ownership interest in Pret A Manger, reflected in Gain on sale of investment. The Company repurchased 37.8 million shares of its stock for nearly $2.7 billion in 2010 and 50.3 million shares of its stock for $2.9 billion in 2009, driving reductions of over 2% and 3% of total shares outstanding, respectively, net of stock option exercises. REVENUES The Company’s revenues consist of sales by Company-operated restaurants and fees from restaurants operated by franchisees. Revenues from conventional franchised restaurants include rent and royalties based on a percent of sales along with minimum rent payments, and initial fees. Revenues from franchised restau- rants that are licensed to affiliates and developmental licensees include a royalty based on a percent of sales, and generally include initial fees. Over the past three years, the Company has continued to optimize its restaurant ownership mix, cash flow and returns
  • 41. through its refranchising strategy. The shift to a greater percent- age of franchised restaurants negatively impacted consolidated revenues as Company-operated sales shifted to franchised sales, where the Company receives rent and/or royalties based on a percent of sales. In 2010, constant currency revenue growth was driven by positive comparable sales. The impact of refranchising on con- solidated revenues lessened because the number of Company- operated restaurants sold to franchisees has declined compared with 2009 and 2008, in line with our overall strategy. In 2009, constant currency revenue growth was driven by positive com- parable sales and expansion, partly offset by the impact of refranchising in certain of the Company’s major markets. Revenues Amount Increase/(decrease) Increase/(decrease) excluding currency translation Dollars in millions 2010 2009 2008 2010 2009 2010 2009 Company-operated sales: U.S. $ 4,229 $ 4,295 $ 4,636 (2)% (7)% (2)% (7)% Europe 6,932 6,721 7,424 3 (9) 5 3 APMEA 4,297 3,714 3,660 16 1 9 5 Other Countries & Corporate 775 729 841 6 (13) (3) (7) Total $16,233 $15,459 $16,561 5% (7)% 4% 0% Franchised revenues: U.S. $ 3,883 $ 3,649 $ 3,442 6% 6% 6% 6% Europe 2,637 2,553 2,499 3 2 8 10 APMEA 769 623 571 23 9 11 12
  • 42. Other Countries & Corporate 553 461 449 20 3 16 9 Total $ 7,842 $ 7,286 $ 6,961 8% 5% 8% 8% Total revenues: U.S. $ 8,112 $ 7,944 $ 8,078 2% (2)% 2% (2)% Europe 9,569 9,274 9,923 3 (7) 6 5 APMEA 5,066 4,337 4,231 17 3 9 6 Other Countries & Corporate 1,328 1,190 1,290 12 (8) 4 (2) Total $24,075 $22,745 $23,522 6% (3)% 5% 2% In the U.S., revenues in 2010 and 2009 were positively impacted by the ongoing appeal of our iconic core products and the success of new products, as well as continued focus on everyday value and convenience. New products introduced in 2010 included McCafé frappés and smoothies as well as the Angus Snack Wraps, while new products introduced in 2009 included McCafé premium coffees and the Angus Third Pounder. Refranchising activity negatively impacted revenue growth in both years. Europe’s constant currency increases in revenues in 2010 and 2009 were primarily driven by comparable sales increases in the U.K., France and Russia (which is entirely Company- operated) as well as expansion in Russia. These increases were partly offset by the impact of refranchising activity, primarily in the U.K. in 2010 and the U.K. and Germany in 2009. In APMEA, the constant currency increase in revenues in 2010 was primarily driven by comparable sales increases in China, Australia and most other markets. The 2009 increase was
  • 43. primarily driven by comparable sales increases in Australia and most other Asian markets, partly offset by negative comparable sales in China. In addition, expansion in China contributed to the increases in both years. 14 McDonald’s Corporation Annual Report 2010 The following tables present comparable sales and Systemwide sales increases/(decreases): Comparable sales increases 2010 2009 2008 U.S. 3.8% 2.6% 4.0% Europe 4.4 5.2 8.5 APMEA 6.0 3.4 9.0 Other Countries & Corporate 11.3 5.5 13.0 Total 5.0% 3.8% 6.9% On a consolidated basis, comparable guest counts increased 4.9%, 1.4% and 3.1% in 2010, 2009 and 2008, respectively. Systemwide sales increases/(decreases) Excluding currency translation 2010 2009 2010 2009 U.S. 4% 3% 4% 3% Europe 3 (2) 7 7 APMEA 15 8 7 7 Other Countries &
  • 44. Corporate 13 13 7 Total 7% 2% 6% 6% Franchised sales are not recorded as revenues by the Company, but are the basis on which the Company calculates and records franchised revenues and are indicative of the health of the franchisee base. The following table presents Franchised sales and the related increases: Franchised Sales Amount Increase Increase excluding currency translation Dollars in millions 2010 2009 2008 2010 2009 2010 2009 U.S. $28,166 $26,737 $25,351 5% 5% 5% 5% Europe 15,049 14,573 14,282 3 2 8 10 APMEA 11,373 9,871 8,895 15 11 7 8 Other Countries & Corporate 6,559 5,747 5,604 14 3 15 9 Total $61,147 $56,928 $54,132 7% 5% 7% 7% RESTAURANT MARGINS • Franchised margins Franchised margin dollars represent revenues from franchised restaurants less the Company’s occupancy costs (rent and depreciation) associated with those sites. Franchised margin dollars represented about two-thirds of the combined restaurant margins in 2010, 2009 and 2008. Franchised margin dollars increased $479 million or 8% (8% in constant currencies) in 2010 and $254 million or 4% (7% in constant currencies) in 2009. Positive comparable sales were the primary driver of the
  • 45. constant currency growth in franchise margin dollars in both years. Refranchising activity also contributed to the constant currency growth in franchise margin dollars in 2009 and to a lesser extent in 2010. Franchised margins In millions 2010 2009 2008 U.S. $3,239 $3,031 $2,867 Europe 2,063 1,998 1,965 APMEA 686 559 511 Other Countries & Corporate 476 397 388 Total $6,464 $5,985 $5,731 Percent of revenues U.S. 83.4% 83.1% 83.3% Europe 78.2 78.3 78.6 APMEA 89.3 89.6 89.6 Other Countries & Corporate 86.0 86.1 86.4 Total 82.4% 82.1% 82.3% In the U.S., the franchised margin percent increase in 2010 was primarily due to positive comparable sales. The 2009 decrease was due to additional depreciation primarily related to the Company’s investment in the beverage initiative, partly offset by positive comparable sales. Europe’s franchised margin percent decreased in 2010 and 2009 as positive comparable sales were more than offset by higher occupancy expenses, the cost of strategic brand and sales building initiatives and the refranchising strategy.
  • 46. In APMEA, the franchised margin percent decrease in 2010 was primarily driven by foreign currency translation, mostly due to the stronger Australian dollar. The franchised margin percent in APMEA and Other Coun- tries & Corporate is higher relative to the U.S. and Europe due to a larger proportion of developmental licensed and/or affiliated restaurants where the Company receives royalty income with no corresponding occupancy costs. • Company-operated margins Company-operated margin dollars represent sales by Company- operated restaurants less the operating costs of these restaurants. Company-operated margin dollars increased $366 million or 13% (12% in constant currencies) in 2010 and decreased $101 million or 3% (increased 3% in constant currencies) in 2009. Positive comparable sales and lower com- modity costs were the primary drivers of the constant currency growth in Company-operated margin dollars and percent in 2010. Positive comparable sales, partly offset by higher commod- ity costs, drove growth in constant currency Company-operated margin dollars and percent in 2009. In addition, refranchising activity negatively impacted Company-operated margin dollars, but benefited Company-operated margin percent in 2009 and to a lesser extent in 2010. McDonald’s Corporation Annual Report 2010 15 Company-operated margins In millions 2010 2009 2008
  • 47. U.S. $ 902 $ 832 $ 856 Europe 1,373 1,240 1,340 APMEA 764 624 584 Other Countries & Corporate 134 111 128 Total $3,173 $2,807 $2,908 Percent of sales U.S. 21.3% 19.4% 18.5% Europe 19.8 18.4 18.0 APMEA 17.8 16.8 15.9 Other Countries & Corporate 17.2 15.2 15.3 Total 19.6% 18.2% 17.6% In the U.S., the Company-operated margin percent increased in 2010 due to lower commodity costs and positive comparable sales, partly offset by higher labor costs. The margin percent increased in 2009 due to positive comparable sales, partly offset by additional depreciation related to the beverage initiative and higher commodity costs. Refranchising had a positive impact on both periods. Europe’s Company-operated margin percent increased in 2010 primarily due to positive comparable sales and lower commodity costs, partly offset by higher labor costs. The margin percent increased in 2009 primarily due to positive comparable sales, partly offset by higher commodity and labor costs. In 2009, local inflation and the impact of weaker currencies on the cost of certain imported products drove higher costs, primarily in Russia, and negatively impacted the Company-operated margin percent.
  • 48. In APMEA, the Company-operated margin percent increased in 2010 primarily due to positive comparable sales and lower commodity costs, partly offset by higher occupancy & other costs and increased labor costs. The margin percent increased in 2009 due to positive comparable sales, partly offset by higher labor costs. • Supplemental information regarding Company- operated restaurants We continually review our restaurant ownership mix with a goal of improving local relevance, profits and returns. In most cases, franchising is the best way to achieve these goals, but as pre- viously stated, Company-operated restaurants are also important to our success. We report results for Company-operated restaurants based on their sales, less costs directly incurred by that business includ- ing occupancy costs. We report the results for franchised restaurants based on franchised revenues, less associated occu- pancy costs. For this reason and because we manage our business based on geographic segments and not on the basis of our ownership structure, we do not specifically allocate selling, general & administrative expenses and other operating (income) expenses to Company-operated or franchised restaurants. Other operating items that relate to the Company-operated restaurants generally include gains/losses on sales of restaurant businesses and write-offs of equipment and leasehold improvements. We believe the following information about Company- operated restaurants in our most significant markets provides an
  • 49. additional perspective on this business. Management responsible for our Company-operated restaurants in these markets analyzes the Company-operated business on this basis to assess its per- formance. Management of the Company also considers this information when evaluating restaurant ownership mix, subject to other relevant considerations. The following table seeks to illustrate the two components of our Company-operated margins. The first of these relates exclusively to restaurant operations, which we refer to as “Store operating margin.” The second relates to the value of our brand and the real estate interest we retain for which we charge rent and royalties. We refer to this component as “Brand/real estate margin.” Both Company-operated and conventional franchised restaurants are charged rent and royalties, although rent and royalties for Company-operated restaurants are eliminated in consolidation. Rent and royalties for both restaurant ownership types are based on a percentage of sales, and the actual rent percentage varies depending on the level of McDonald’s invest- ment in the restaurant. Royalty rates may also vary by market. As shown in the following table, in disaggregating the compo- nents of our Company-operated margins, certain costs with respect to Company-operated restaurants are reflected in Brand/real estate margin. Those costs consist of rent payable by McDonald’s to third parties on leased sites and depreciation for buildings and leasehold improvements and constitute a portion of occupancy & other operating expenses recorded in the Con- solidated statement of income. Store operating margins reflect rent and royalty expenses, and those amounts are accounted for as income in calculating Brand/real estate margin. While we believe that the following information provides a
  • 50. perspective in evaluating our Company-operated business, it is not intended as a measure of our operating performance or as an alternative to operating income or restaurant margins as reported by the Company in accordance with accounting principles gen- erally accepted in the U.S. In particular, as noted previously, we do not allocate selling, general & administrative expenses to our Company-operated business. However, we believe that a range of $40,000 to $50,000 per restaurant, on average, is a typical range of costs to support this business in the U.S. The actual costs in markets outside the U.S. will vary depending on local circumstances and the organizational structure of the market. These costs reflect the indirect services we believe are neces- sary to provide the appropriate support of the restaurant. 16 McDonald’s Corporation Annual Report 2010 U.S. Europe Dollars in millions 2010 2009 2008 2010 2009 2008 As reported Number of Company-operated restaurants at year end 1,550 1,578 1,782 2,005 2,001 2,024 Sales by Company-operated restaurants $4,229 $4,295 $4,636 $ 6,932 $ 6,721 $ 7,424 Company-operated margin $ 902 $ 832 $ 856 $ 1,373 $ 1,240 $ 1,340 Store operating margin Company-operated margin $ 902 $ 832 $ 856 $ 1,373 $ 1,240 $ 1,340 Plus: Outside rent expense(1) 60 65 74 223 222 254 Depreciation—buildings & leasehold improvements(1) 65 70 70 105 100 110
  • 51. Less: Rent & royalties(2) (619) (634) (684) (1,335) (1,306) (1,435) Store operating margin $ 408 $ 333 $ 316 $ 366 $ 256 $ 269 Brand/real estate margin Rent & royalties(2) $ 619 $ 634 $ 684 $ 1,335 $ 1,306 $ 1,435 Less: Outside rent expense(1) (60) (65) (74) (223) (222) (254) Depreciation—buildings & leasehold improvements(1) (65) (70) (70) (105) (100) (110) Brand/real estate margin $ 494 $ 499 $ 540 $ 1,007 $ 984 $ 1,071 (1) Represents certain costs recorded as occupancy & other operating expenses in the Consolidated statement of income – rent payable by McDonald’s to third parties on leased sites and depreciation for buildings and leasehold improvements. This adjustment is made to reflect these occupancy costs in Brand/real estate margin. The relative percentage of sites that are owned versus leased varies by country. (2) Reflects average Company–operated rent and royalties (as a percentage of 2010 sales: U.S. – 14.6% and Europe – 19.3%). This adjustment is made to reflect expense in Store operating margin and income in Brand/real estate margin. Countries within Europe have varying economic profiles and a wide range of rent and royalty rates as a percentage of sales. SELLING, GENERAL & ADMINISTRATIVE EXPENSES Consolidated selling, general & administrative expenses increased 4% (4% in constant currencies) in 2010 and decreased
  • 52. 5% (2% in constant currencies) in 2009. The Vancouver Winter Olympics in February and the Company’s biennial Worldwide Owner/Operator Convention in April contributed to the increase in 2010. The 2009 expenses decreased partly due to costs in 2008 related to the Beijing Summer Olympics and the Company’s biennial Worldwide Owner/Operator Convention. Selling, general & administrative expenses Amount Increase/(decrease) Increase/(decrease) excluding currency translation Dollars in millions 2010 2009 2008 2010 2009 2010 2009 U.S. $ 781 $ 751 $ 745 4% 1% 4% 1% Europe 653 655 714 (8) 2 APMEA 306 276 300 10 (8) 4 (5) Other Countries & Corporate(1) 593 552 596 7 (7) 5 (7) Total $2,333 $2,234 $2,355 4% (5)% 4% (2)% (1) Included in Other Countries & Corporate are home office support costs in areas such as facilities, finance, human resources, information technology, legal, marketing, restaurant oper- ations, supply chain and training. Selling, general & administrative expenses as a percent of revenues were 9.7% in 2010 compared with 9.8% in 2009 and 10.0% in 2008. Selling, general & administrative expenses as a percent of
  • 53. Systemwide sales were 3.0% in 2010 compared with 3.1% in 2009 and 3.3% in 2008. Management believes that analyzing selling, general & administrative expenses as a percent of Systemwide sales, as well as revenues, is meaningful because these costs are incurred to support Systemwide restaurants. McDonald’s Corporation Annual Report 2010 17 IMPAIRMENT AND OTHER CHARGES (CREDITS), NET The Company recorded impairment and other charges (credits), net of $29 million in 2010, ($61) million in 2009 and $6 million in 2008. Management does not include these items when review- ing business performance trends because we do not believe these items are indicative of expected ongoing results. Impairment and other charges (credits), net In millions, except per share data 2010 2009 2008 Europe $ 1 $ 4 $ 6 APMEA 49 Other Countries & Corporate (21) (65) Total $ 29 $ (61) $ 6 After tax(1) $ 25 $ (91) $ 4 Earnings per common share – diluted $0.02 $(0.08) $0.01 (1) Certain items were not tax effected. In 2010, the Company recorded expense of $29 million pri- marily related to its share of restaurant closing costs in McDonald’s Japan in conjunction with the first quarter strategic review of the market’s restaurant portfolio, partly offset by
  • 54. income related to the resolution of certain liabilities retained in con- nection with the 2007 Latin America developmental license transaction. In 2009, the Company recorded income of $61 million related primarily to the resolution of certain liabilities retained in connection with the 2007 Latin America developmental license transaction. The Company also recognized a tax benefit in 2009 in connection with this income, mainly related to the release of a tax valuation allowance. OTHER OPERATING (INCOME) EXPENSE, NET Other operating (income) expense, net In millions 2010 2009 2008 Gains on sales of restaurant businesses $ (79) $(113) $(126) Equity in earnings of unconsolidated affiliates (164) (168) (111) Asset dispositions and other expense 45 59 72 Total $(198) $(222) $(165) • Gains on sales of restaurant businesses Gains on sales of restaurant businesses include gains from sales of Company-operated restaurants as well as gains from exercises of purchase options by franchisees with business facili- ties lease arrangements (arrangements where the Company
  • 55. leases the businesses, including equipment, to franchisees who generally have options to purchase the businesses). The Compa- ny’s purchases and sales of businesses with its franchisees are aimed at achieving an optimal ownership mix in each market. Resulting gains or losses are recorded in operating income because the transactions are a recurring part of our business. The Company realized lower gains on sales of restaurant busi- nesses in 2010 compared with 2009 and 2008 primarily as a result of selling less Company-operated restaurants to franchi- sees. • Equity in earnings of unconsolidated affiliates Unconsolidated affiliates and partnerships are businesses in which the Company actively participates, but does not control. The Company records equity in earnings from these entities representing McDonald’s share of results. For foreign affiliated markets – primarily Japan – results are reported after interest expense and income taxes. McDonald’s share of results for part- nerships in certain consolidated markets such as the U.S. is reported before income taxes. These partnership restaurants are operated under conventional franchise arrangements and, there- fore, are classified as conventional franchised restaurants. Results in 2010 reflected a reduction in the number of uncon- solidated affiliate restaurants worldwide partly offset by improved operating performance in Japan. Results in 2009 also reflected improved operating performance in Japan and benefited from the stronger Japanese Yen. • Asset dispositions and other expense Asset dispositions and other expense consists of gains or losses on excess property and other asset dispositions, provisions for restaurant closings and uncollectible receivables, asset write- offs due to restaurant reinvestment, and other miscellaneous income
  • 56. and expenses. 18 McDonald’s Corporation Annual Report 2010 OPERATING INCOME Operating income Amount Increase/(decrease) Increase/(decrease) excluding currency translation Dollars in millions 2010 2009 2008 2010 2009 2010 2009 U.S. $3,446 $3,232 $3,060 7% 6% 7% 6% Europe 2,797 2,588 2,608 8 (1) 12 8 APMEA 1,200 989 819 21 21 11 23 Other Countries & Corporate 30 32 (44) (6) nm (43) nm Total $7,473 $6,841 $6,443 9% 6% 9% 10% nm Not meaningful. In the U.S., 2010 results increased due to higher combined res- taurant margin dollars. Results for 2009 increased primarily due to higher franchised margin dollars. In Europe, results for 2010 and 2009 were driven by stronger operating performance in France, Russia and the U.K. In APMEA, 2010 results increased due to stronger results in Australia and many other markets. The Company’s share of impairment charges related to restaurant closings in Japan neg- atively impacted the growth rate by 4 percentage points for the
  • 57. year. Results for 2009 were driven primarily by strong results in Australia and expansion in China. In Other Countries & Corporate, results for 2010 and 2009 included income of $21 million and $65 million, respectively, primarily related to the resolution of certain liabilities retained in connection with the 2007 Latin America developmental license transaction. • Combined operating margin Combined operating margin is defined as operating income as a percent of total revenues. Combined operating margin for 2010, 2009 and 2008 was 31.0%, 30.1% and 27.4%, respectively. Impairment and other charges (credits), net negatively impacted the combined operating margin by 0.2 percentage points in 2010, while positively impacting it by 0.3 percentage points in 2009. INTEREST EXPENSE Interest expense decreased in 2010 primarily due to lower aver- age interest rates slightly offset by higher average debt balances. Interest expense decreased in 2009 primarily due to lower aver- age interest rates, and to a lesser extent, weaker foreign currencies, partly offset by higher average debt levels. NONOPERATING (INCOME) EXPENSE, NET Nonoperating (income) expense, net In millions 2010 2009 2008 Interest income $(20) $(19) $(85) Foreign currency and hedging
  • 58. activity (2) (32) (5) Other expense 44 27 12 Total $ 22 $(24) $(78) Interest income consists primarily of interest earned on short- term cash investments. Interest income decreased in 2009 primarily due to lower average interest rates. Foreign currency and hedging activity primarily relates to net gains or losses on certain hedges that reduce the exposure to variability on certain intercompany foreign currency cash flow streams. Other expense primarily consists of amortization of debt issuance costs and other nonoperating income and expenses. GAIN ON SALE OF INVESTMENT In 2009, the Company sold its minority ownership interest in Redbox to Coinstar, Inc., the majority owner, for total consid- eration of $140 million. As a result of the transaction, the Company recognized a nonoperating pretax gain of $95 million (after tax–$59 million or $0.05 per share). In 2008, the Company sold its minority ownership interest in U.K.-based Pret A Manger. In connection with the sale, the Company received cash proceeds of $229 million and recog- nized a nonoperating pretax gain of $160 million (after tax– $109 million or $0.09 per share). PROVISION FOR INCOME TAXES In 2010, 2009 and 2008, the reported effective income tax rates were 29.3%, 29.8% and 30.0%, respectively.
  • 59. In 2010, the effective income tax rate decreased due to higher tax benefits related to foreign operations. In 2009, the effective income tax rate benefited by 0.7 per- centage points primarily due to the resolution of certain liabilities retained in connection with the 2007 Latin America devel- opmental license transaction. Consolidated net deferred tax liabilities included tax assets, net of valuation allowance, of $1.6 billion and $1.4 billion in 2010 and 2009, respectively. Substantially all of the net tax assets arose in the U.S. and other profitable markets. ACCOUNTING CHANGES • Fair value measurements In 2006, the Financial Accounting Standards Board (FASB) issued guidance on fair value measurements, codified primarily in the Fair Value Measurements and Disclosures Topic of the FASB Accounting Standards Codification (ASC). This guidance defines fair value, establishes a framework for measuring fair value in accordance with generally accepted accounting principles, and expands disclosures about fair value measurements. This guid- ance does not require any new fair value measurements; rather, it applies to other accounting pronouncements that require or permit fair value measurements. The provisions of the guidance, as issued, were effective January 1, 2008. However, in February 2008, the FASB deferred the effective date for one year for cer- tain non-financial assets and non-financial liabilities, except those
  • 60. that are recognized or disclosed at fair value in the financial McDonald’s Corporation Annual Report 2010 19 statements on a recurring basis (i.e., at least annually). The Company adopted the required provisions related to debt and derivatives as of January 1, 2008 and adopted the remaining required provisions for non-financial assets and liabilities as of January 1, 2009. The effect of adoption was not significant in either period. • Variable interest entities and consolidation In June 2009, the FASB issued amendments to the guidance on variable interest entities and consolidation, codified primarily in the Consolidation Topic of the FASB ASC. This guidance modi- fies the method for determining whether an entity is a variable interest entity as well as the methods permitted for determining the primary beneficiary of a variable interest entity. In addition, this guidance requires ongoing reassessments of whether a company is the primary beneficiary of a variable interest entity and enhanced disclosures related to a company’s involvement with a variable interest entity. The Company adopted this guid- ance as of January 1, 2010. On an ongoing basis, the Company evaluates its business relationships such as those with franchisees, joint venture part- ners, developmental licensees, suppliers, and advertising cooperatives to identify potential variable interest entities. Gen- erally, these businesses qualify for a scope exception under the consolidation guidance. The Company has concluded that con- solidation of any such entities is not appropriate for the periods presented. As a result, the adoption did not have any impact on the Company’s consolidated financial statements.
  • 61. Cash Flows The Company generates significant cash from its operations and has substantial credit availability and capacity to fund operating and discretionary spending such as capital expenditures, debt repayments, dividends and share repurchases. Cash provided by operations totaled $6.3 billion and exceeded capital expenditures by $4.2 billion in 2010, while cash provided by operations totaled $5.8 billion and exceeded capital expenditures by $3.8 billion in 2009. In 2010, cash provided by operations increased $591 million or 10% compared with 2009 primarily due to increased operating results. In 2009, cash pro- vided by operations decreased $166 million or 3% compared with 2008 despite increased operating results, primarily due to higher income tax payments, higher noncash income items and the receipt of $143 million in 2008 related to the completion of an IRS examination. Cash used for investing activities totaled $2.1 billion in 2010, an increase of $401 million compared with 2009. This reflects higher capital expenditures and lower proceeds from sales of investments and restaurant businesses. Cash used for investing activities totaled $1.7 billion in 2009, an increase of $31 million compared with 2008. This reflects lower proceeds from sales of investments, restaurant businesses and property, offset by lower capital expenditures, primarily in the U.S. Cash used for financing activities totaled $3.7 billion in 2010, a decrease of $692 million compared with 2009, primarily due to higher net debt issuances, higher proceeds from stock option exercises and lower treasury stock purchases, partly offset by an increase in the common stock dividend. Cash used for financing
  • 62. activities totaled $4.4 billion in 2009, an increase of $307 million compared with 2008, primarily due to lower net debt issuances, an increase in the common stock dividend and lower proceeds from stock option exercises, partly offset by lower treasury stock purchases. As a result of the above activity, the Company’s cash and equivalents balance increased $591 million in 2010 to $2.4 bil- lion, compared with a decrease of $267 million in 2009. In addition to cash and equivalents on hand and cash provided by operations, the Company can meet short-term funding needs through its continued access to commercial paper borrowings and line of credit agreements. RESTAURANT DEVELOPMENT AND CAPITAL EXPENDITURES In 2010, the Company opened 957 traditional restaurants and 35 satellite restaurants (small, limited-menu restaurants for which the land and building are generally leased), and closed 406 tradi- tional restaurants and 327 satellite restaurants. Of these closures, there were over 400 in McDonald’s Japan due to the strategic review of the market’s restaurant portfolio. In 2009, the Company opened 824 traditional restaurants and 44 satellite restaurants and closed 215 traditional restaurants and 142 satel- lite restaurants. The majority of restaurant openings and closings occurred in the major markets in both years. The Company closes restaurants for a variety of reasons, such as existing sales and profit performance or loss of real estate tenure.
  • 63. Systemwide restaurants at year end(1) 2010 2009 2008 U.S. 14,027 13,980 13,918 Europe 6,969 6,785 6,628 APMEA 8,424 8,488 8,255 Other Countries & Corporate 3,317 3,225 3,166 Total 32,737 32,478 31,967 (1) Includes satellite units at December 31, 2010, 2009 and 2008 as follows: U.S. – 1,112, 1,155, 1,169; Europe–239, 241, 226; APMEA (primarily Japan)–1,010, 1,263, 1,379; Other Countries & Corporate–470, 464, 447. Approximately 65% of Company-operated restaurants and about 80% of franchised restaurants were located in the major markets at the end of 2010. About 80% of the restaurants at year-end 2010 were franchised. Capital expenditures increased $183 million or 9% in 2010 primarily due to higher investment in new restaurants. Capital expenditures decreased $184 million or 9% in 2009 primarily due to fewer restaurant openings, lower reinvestment in existing restaurants in the U.S. and the impact of foreign currency trans- lation. In both years, capital expenditures reflected the Company’s commitment to grow sales at existing restaurants, including reinvestment initiatives such as reimaging in many markets around the world. Capital expenditures invested in major markets, excluding Japan, represented over 65% of the total in 2010, 2009 and 2008. Japan is accounted for under the equity method, and
  • 64. accordingly its capital expenditures are not included in con- solidated amounts. Capital expenditures In millions 2010 2009 2008 New restaurants $ 968 $ 809 $ 897 Existing restaurants 1,089 1,070 1,152 Other(1) 78 73 87 Total capital expenditures $ 2,135 $ 1,952 $ 2,136 Total assets $31,975 $30,225 $28,462 (1) Primarily corporate equipment and other office-related expenditures. 20 McDonald’s Corporation Annual Report 2010 New restaurant investments in all years were concentrated in markets with acceptable returns or opportunities for long-term growth. Average development costs vary widely by market depending on the types of restaurants built and the real estate and construction costs within each market. These costs, which include land, buildings and equipment, are managed through the use of optimally sized restaurants, construction and design effi- ciencies, and leveraging best practices. Although the Company is not responsible for all costs for every restaurant opened, total development costs (consisting of land, buildings and equipment) for new traditional McDonald’s restaurants in the U.S. averaged approximately $2.6 million in 2010. The Company owned approximately 45% of the land and
  • 65. about 70% of the buildings for restaurants in its consolidated markets at year-end 2010 and 2009. SHARE REPURCHASES AND DIVIDENDS In 2010, the Company returned $5.1 billion to shareholders through a combination of shares repurchased and dividends paid. Shares repurchased and dividends In millions, except per share data 2010 2009 2008 Number of shares repurchased 37.8 50.3 69.7 Shares outstanding at year end 1,054 1,077 1,115 Dividends declared per share $ 2.26 $ 2.05 $1.625 Dollar amount of shares repurchased $2,649 $2,854 $3,981 Dividends paid 2,408 2,235 1,823 Total returned to shareholders $5,057 $5,089 $5,804 In September 2009, the Company’s Board of Directors approved a $10 billion share repurchase program with no speci- fied expiration date. In 2009 and 2010 combined, approximately 45 million shares have been repurchased for $3.1 billion under this program. This program replaced the $10 billion share repurchase program that the Company’s Board of Directors approved in September 2007. The Company has paid dividends on its common stock for 35 consecutive years and has increased the dividend amount every year. The 2010 full year dividend of $2.26 per share reflects the
  • 66. quarterly dividend paid for each of the first three quarters of $0.55 per share, with an increase to $0.61 per share paid in the fourth quarter. This 11% increase in the quarterly dividend equa- tes to a $2.44 per share annual dividend rate and reflects the Company’s confidence in the ongoing strength and reliability of its cash flow. As in the past, future dividend amounts will be con- sidered after reviewing profitability expectations and financing needs, and will be declared at the discretion of the Company’s Board of Directors. Financial Position and Capital Resources TOTAL ASSETS AND RETURNS Total assets increased $1.8 billion or 6% in 2010. Excluding the effect of changes in foreign currency exchange rates, total assets increased $1.7 billion in 2010. Over 70% of total assets were in major markets at year-end 2010. Net property and equipment increased $529 million in 2010 and represented about 70% of total assets at year end. Excluding the effect of changes in foreign currency exchange rates, net property and equipment increased $719 million primarily due to capital expenditures, partly offset by depreciation. Operating income is used to compute return on average assets, while net income is used to calculate return on average common equity. Month-end balances are used to compute both average assets and average common equity. Returns on assets and equity 2010 2009 2008
  • 67. Return on average assets 24.7% 23.4% 21.8% Return on average common equity 35.3 34.0 30.6 In 2010, 2009 and 2008, return on average assets and return on average common equity benefited from strong global operating results. Operating income, as reported, does not include interest income; however, cash balances are included in average assets. The inclusion of cash balances in average assets reduced return on average assets by 1.9 percentage points, 2.0 percentage points and 1.9 percentage points in 2010, 2009 and 2008, respectively. FINANCING AND MARKET RISK The Company generally borrows on a long-term basis and is exposed to the impact of interest rate changes and foreign cur- rency fluctuations. Debt obligations at December 31, 2010 totaled $11.5 billion, compared with $10.6 billion at December 31, 2009. The net increase in 2010 was primarily due to net issuances of $787 million and changes in exchange rates on foreign currency denominated debt of $140 million. Debt highlights(1) 2010 2009 2008 Fixed-rate debt as a percent of total debt(2,3) 66% 68% 72% Weighted-average annual interest rate of total debt(3) 4.3 4.5 5.0 Foreign currency-denominated debt as a percent of total debt(2) 41 43 45 Total debt as a percent of total
  • 68. capitalization (total debt and total shareholders’ equity)(2) 44 43 43 Cash provided by operations as a percent of total debt(2) 55 55 59 (1) All percentages are as of December 31, except for the weighted-average annual interest rate, which is for the year. (2) Based on debt obligations before the effect of fair value hedging adjustments. This effect is excluded as these adjustments have no impact on the obligation at maturity. See Debt financing note to the consolidated financial statements. (3) Includes the effect of interest rate exchange agreements. Fitch, Standard & Poor’s and Moody’s currently rate, with a stable outlook, the Company’s commercial paper F1, A-1 and P-1, respectively; and its long-term debt A, A and A2, respectively. Certain of the Company’s debt obligations contain cross- acceleration provisions and restrictions on Company and subsidiary mortgages and the long-term debt of certain sub- sidiaries. There are no provisions in the Company’s debt obligations that would accelerate repayment of debt as a result of McDonald’s Corporation Annual Report 2010 21 a change in credit ratings or a material adverse change in the
  • 69. Company’s business. Under existing authorization from the Company’s Board of Directors, at December 31, 2010, the Company has $3 billion of authority remaining to borrow funds, including through (i) public or private offering of debt securities; (ii) direct borrowing from banks or other financial institutions; and (iii) other forms of indebtedness. In addition to registered debt securities on a U.S. shelf registration statement and a Global Medium-Term Notes program, the Company has $1.3 billion available under committed line of credit agreements as well as authority to issue commercial paper in the U.S. and Global market (see Debt financing note to the consolidated financial statements). Debt maturing in 2011 is approximately $601 mil- lion of long-term corporate debt. In 2011, the Company expects to issue commercial paper and long-term debt to refinance this maturing debt. The Company also has $595 million of foreign currency bank line borrowings outstanding at year-end 2010. The Company uses major capital markets, bank financings and derivatives to meet its financing requirements and reduce interest expense. The Company manages its debt portfolio in response to changes in interest rates and foreign currency rates by periodically retiring, redeeming and repurchasing debt, termi- nating exchange agreements and using derivatives. The Company does not use derivatives with a level of complexity or with a risk higher than the exposures to be hedged and does not hold or issue derivatives for trading purposes. All exchange agreements are over-the-counter instruments. In managing the impact of interest rate changes and foreign currency fluctuations, the Company uses interest rate exchange agreements and finances in the currencies in which assets are denominated. The Company uses foreign currency debt and
  • 70. derivatives to hedge the foreign currency risk associated with certain royalties, intercompany financings and long-term invest- ments in foreign subsidiaries and affiliates. This reduces the impact of fluctuating foreign currencies on cash flows and shareholders’ equity. Total foreign currency-denominated debt was $4.7 billion and $4.5 billion for the years ended December 31, 2010 and 2009, respectively. In addition, where practical, the Company’s restaurants purchase goods and serv- ices in local currencies resulting in natural hedges. See Summary of significant accounting policies note to the consolidated finan- cial statements related to financial instruments and hedging activities for additional information regarding the accounting impact and use of derivatives. The Company does not have significant exposure to any individual counterparty and has master agreements that contain netting arrangements. Certain of these agreements also require each party to post collateral if credit ratings fall below, or aggregate exposures exceed, certain contractual limits. At December 31, 2010, neither the Company nor its counterparties were required to post collateral on any derivative position, other than on hedges of certain of the Company’s supplemental benefit plan liabilities where our counterparty was required to post collateral on its liability position. The Company’s net asset exposure is diversified among a broad basket of currencies. The Company’s largest net asset exposures (defined as foreign currency assets less foreign cur- rency liabilities) at year end were as follows: Foreign currency net asset exposures In millions of U.S. Dollars 2010 2009
  • 71. Euro $5,465 $5,151 Australian Dollars 2,075 1,460 Canadian Dollars 1,123 981 Russian Ruble 589 501 British Pounds Sterling 547 679 The Company prepared sensitivity analyses of its financial instruments to determine the impact of hypothetical changes in interest rates and foreign currency exchange rates on the Company’s results of operations, cash flows and the fair value of its financial instruments. The interest rate analysis assumed a one percentage point adverse change in interest rates on all financial instruments, but did not consider the effects of the reduced level of economic activity that could exist in such an environment. The foreign currency rate analysis assumed that each foreign currency rate would change by 10% in the same direction relative to the U.S. Dollar on all financial instruments; however, the analysis did not include the potential impact on revenues, local currency prices or the effect of fluctuating currencies on the Company’s antici- pated foreign currency royalties and other payments received in the U.S. Based on the results of these analyses of the Company’s financial instruments, neither a one percentage point adverse change in interest rates from 2010 levels nor a 10% adverse change in foreign currency rates from 2010 levels would materi- ally affect the Company’s results of operations, cash flows or the fair value of its financial instruments. 22 McDonald’s Corporation Annual Report 2010
  • 72. CONTRACTUAL OBLIGATIONS AND COMMITMENTS The Company has long-term contractual obligations primarily in the form of lease obligations (related to both Company-operated and franchised restaurants) and debt obligations. In addition, the Company has long-term revenue and cash flow streams that relate to its franchise arrangements. Cash provided by operations (including cash provided by these franchise arrangements) along with the Company’s borrowing capacity and other sources of cash will be used to satisfy the obligations. The following table summarizes the Company’s contractual obligations and their aggregate maturities as well as future minimum rent payments due to the Company under existing franchise arrangements as of December 31, 2010. See discussions of cash flows and financial position and capital resources as well as the Notes to the con- solidated financial statements for further details. Contractual cash outflows Contractual cash inflows In millions Operating leases Debt obligations(1) Minimum rent under franchise arrangements 2011 $ 1,200 $ 8 $ 2,349