SlideShare a Scribd company logo
1 of 16
K Means Clustering
What is K-Means Algorithm?
K-Means Clustering is an Unsupervised Learning algorithm, which groups the unlabelled
dataset into different clusters.
Here K defines the number of pre-defined clusters that need to be created in the
process, as if K=2, there will be two clusters, and for K=3, there will be three clusters,
and so on.
It is an iterative algorithm that divides the unlabelled dataset into k different clusters
in such a way that each dataset belongs only one group that has similar properties.
It is a centroid-based algorithm, where each cluster is associated with a centroid. The
main aim of this algorithm is to minimize the sum of distances between the data point
and their corresponding clusters.
 The k-means clustering algorithm mainly performs two tasks:
 1. Determines the best value for K center points or centroids by an iterative process.
 2. Assigns each data point to its closest k-center. Those data points which are near to the
particular k-center, create a cluster.
 How does the K-Means Algorithm Work?
 The working of the K-Means algorithm is explained in the below steps:
 Step-1: Select the number K to decide the number of clusters.
 Step-2: Select random K points or centroids. (It can be other from the input dataset).
 Step-3: Assign each data point to their closest centroid, which will form the predefined K
clusters.
 Step-4: Calculate the variance and place a new centroid of each cluster.
 Step-5: Repeat the third steps, which means reassign each datapoint to the new closest
centroid of each cluster.
 Step-6: If any reassignment occurs, then go to step-4 else go to FINISH.
 Step-7: The model is ready.
 Let's take number k of clusters, i.e., K=2, to identify the dataset and to put them into
different clusters. It means here we will try to group these datasets into two different
clusters.
Now we will assign each data point of the scatter plot to its
closest K-point or centroid.
From the above image, it is clear that points left side of
the line is near to the K1 or blue centroid, and points to
the right of the line are close to the yellow centroid.
As we need to find the closest cluster, so we will repeat
the process by choosing a new centroid.
As our model is ready, so we can now remove the
assumed centroids, and the two final clusters will be as
shown in the below image:
 In the given dataset, we have Customer_Id, Gender, Age, Annual Income ($), and Spending
Score (which is the calculated value of how much a customer has spent in the mall, the more
the value, the more he has spent).
 From this dataset, we need to calculate some patterns, as it is an unsupervised method, so we
don't know what to calculate exactly.
 The steps to be followed for the implementation are given below:
 Data Pre-processing
 Finding the optimal number of clusters using the elbow method
 Training the K-means algorithm on the training dataset
 Visualizing the clusters
 The numpy we have imported for the performing mathematics calculation, matplotlib is
for plotting the graph, and pandas are for managing the dataset.
 Importing the Dataset:
Next, we will import the dataset that we need to use. So here, we are using the
Mall_Customer_data.csv dataset. It can be imported using the below code:
 import numpy as nm
 import matplotlib.pyplot as mtp
 import pandas as pd
 dataset = pd.read_csv('Mall_Customers_data.csv')
 print(dataset)
 Extracting Independent Variables
 Here we don't need any dependent variable for data pre-processing step as it is a clustering
problem, and we have no idea about what to determine. So we will just add a line of code
for the matrix of features.
 Finding the optimal number of clusters using the elbow method
 In the second step, we will try to find the optimal number of clusters for our clustering
problem. So, as discussed above, here we are going to use the elbow method for this
purpose.
 Elbow method uses the WCSS concept to draw the plot by plotting WCSS values on the Y-axis
and the number of clusters on the X-axis.
 So we are going to calculate the value for WCSS for different k values ranging from 1 to 10.
Below is the code for it:
 #finding optimal number of clusters using the elbow method
 from sklearn.cluster import KMeans
 wcss_list= [] #Initializing the list for the values of WCSS

 #Using for loop for iterations from 1 to 10.
 for i in range(1, 11):
 kmeans = KMeans(n_clusters=i, init='k-means++', random_state= 42)
 kmeans.fit(x)
 wcss_list.append(kmeans.inertia_)
 mtp.plot(range(1, 11), wcss_list)
 mtp.title('The Elobw Method Graph')
 mtp.xlabel('Number of clusters(k)')
 mtp.ylabel('wcss_list')
 mtp.show()
 we have created the wcss_list variable to initialize an empty list, which is used to contain
the value of wcss computed for different values of k ranging from 1 to 10.
 After that, we have initialized the for loop for the iteration on a different value of k ranging
from 1 to 10; since for loop in Python, exclude the outbound limit, so it is taken as 11 to
include 10th value.
 The rest part of the code is similar as we did in earlier topics, as we have fitted the model
on a matrix of features and then plotted the graph between the number of clusters and
WCSS.
 Training the K-means algorithm on the training dataset
 As we have got the number of clusters, so we can now train the model on the
dataset.
 #training the K-means model on a dataset
 kmeans = KMeans(n_clusters=5, init='k-means++', random_state= 42)
 y_predict= kmeans.fit_predict(x)
 Visualizing the Clusters
 The last step is to visualize the clusters. As we have 5 clusters for our model,
so we will visualize each cluster one by one.
 #visulaizing the clusters
 mtp.scatter(x[y_predict == 0, 0], x[y_predict == 0, 1], s = 100, c = 'blue', label = 'Cluster 1') #for first cluster
 mtp.scatter(x[y_predict == 1, 0], x[y_predict == 1, 1], s = 100, c = 'green', label = 'Cluster 2') #for second cluster
 mtp.scatter(x[y_predict== 2, 0], x[y_predict == 2, 1], s = 100, c = 'red', label = 'Cluster 3') #for third cluster
 mtp.scatter(x[y_predict == 3, 0], x[y_predict == 3, 1], s = 100, c = 'cyan', label = 'Cluster 4') #for fourth cluster
 mtp.scatter(x[y_predict == 4, 0], x[y_predict == 4, 1], s = 100, c = 'magenta', label = 'Cluster 5') #for fifth cluster
 mtp.scatter(kmeans.cluster_centers_[:, 0], kmeans.cluster_centers_[:, 1], s = 300, c = 'yellow', label = 'Centroid'
)
 mtp.title('Clusters of customers')
 mtp.xlabel('Annual Income (k$)')
 mtp.ylabel('Spending Score (1-100)')
 mtp.legend()
 mtp.show()
 Cluster1 shows the customers with average salary and average spending so we can
categorize these customers as Cluster1
 Cluster2 shows the customer has a high income but low spending, so we can
categorize them as careful.
 Cluster3 shows the low income and also low spending so they can be categorized as
sensible.
 Cluster4 shows the customers with low income with very high spending so they can be
categorized as careless.
 Cluster5 shows the customers with high income and high spending so they can be
categorized as target, and these customers can be the most profitable customers for
the mall owner.
 import numpy as nm
 import matplotlib.pyplot as mtp
 import pandas as pd
 dataset = pd.read_csv('Mall_Customers_data.csv')
 print(dataset)
 x = dataset.iloc[:, [3, 4]].values
 print(x)
 #finding optimal number of clusters using the elbow method
 from sklearn.cluster import KMeans
 wcss_list=[]
 #Initializing the list for the values of WCSS
 #Using for loop for iterations from 1 to 10.
 for i in range(1,11):
 kmeans=KMeans(n_clusters=i,init='k-means++',random_state=42)
 kmeans.fit(x)
 wcss_list.append(kmeans.inertia_)
 mtp.plot(range(1,11),wcss_list)
 mtp.title('The Elobw Method Graph')
 mtp.xlabel('Number of clusters(k)')
 mtp.ylabel('wcss_list')
 mtp.show()
 #training the K-means model on a dataset
 kmeans = KMeans(n_clusters=5, init='k-means++', random_state= 42)
 y_predict= kmeans.fit_predict(x)
 #visulaizing the clusters
 mtp.scatter(x[y_predict == 0, 0], x[y_predict == 0, 1], s = 100, c = 'blue', label = 'Cluster 1') #for first cluster
 mtp.scatter(x[y_predict == 1, 0], x[y_predict == 1, 1], s = 100, c = 'green', label = 'Cluster 2') #for second cluster
 mtp.scatter(x[y_predict== 2, 0], x[y_predict == 2, 1], s = 100, c = 'red', label = 'Cluster 3') #for third cluster
 mtp.scatter(x[y_predict == 3, 0], x[y_predict == 3, 1], s = 100, c = 'cyan', label = 'Cluster 4') #for fourth cluster
 mtp.scatter(x[y_predict == 4, 0], x[y_predict == 4, 1], s = 100, c = 'magenta', label = 'Cluster 5') #for fifth cluster
 mtp.scatter(kmeans.cluster_centers_[:, 0], kmeans.cluster_centers_[:, 1], s = 300, c = 'yellow', label =
'Centroid')
 mtp.title('Clusters of customers')
 mtp.xlabel('Annual Income (k$)')
 mtp.ylabel('Spending Score (1-100)')
 mtp.legend()
 mtp.show()
K Means Clustering in ML.pptx

More Related Content

Similar to K Means Clustering in ML.pptx

K mean-clustering algorithm
K mean-clustering algorithmK mean-clustering algorithm
K mean-clustering algorithmparry prabhu
 
Lecture_3_k-mean-clustering.ppt
Lecture_3_k-mean-clustering.pptLecture_3_k-mean-clustering.ppt
Lecture_3_k-mean-clustering.pptSyedNahin1
 
Data Manipulation with Numpy and Pandas in PythonStarting with N
Data Manipulation with Numpy and Pandas in PythonStarting with NData Manipulation with Numpy and Pandas in PythonStarting with N
Data Manipulation with Numpy and Pandas in PythonStarting with NOllieShoresna
 
8.clustering algorithm.k means.em algorithm
8.clustering algorithm.k means.em algorithm8.clustering algorithm.k means.em algorithm
8.clustering algorithm.k means.em algorithmLaura Petrosanu
 
maXbox starter65 machinelearning3
maXbox starter65 machinelearning3maXbox starter65 machinelearning3
maXbox starter65 machinelearning3Max Kleiner
 
maxbox starter60 machine learning
maxbox starter60 machine learningmaxbox starter60 machine learning
maxbox starter60 machine learningMax Kleiner
 
k-mean-clustering.ppt
k-mean-clustering.pptk-mean-clustering.ppt
k-mean-clustering.pptRanimeLoutar
 
k-mean-Clustering impact on AI using DSS
k-mean-Clustering impact on AI using DSSk-mean-Clustering impact on AI using DSS
k-mean-Clustering impact on AI using DSSMarkNaguibElAbd
 
K-Means Algorithm Implementation In python
K-Means Algorithm Implementation In pythonK-Means Algorithm Implementation In python
K-Means Algorithm Implementation In pythonAfzal Ahmad
 
Mini-lab 1: Stochastic Gradient Descent classifier, Optimizing Logistic Regre...
Mini-lab 1: Stochastic Gradient Descent classifier, Optimizing Logistic Regre...Mini-lab 1: Stochastic Gradient Descent classifier, Optimizing Logistic Regre...
Mini-lab 1: Stochastic Gradient Descent classifier, Optimizing Logistic Regre...Yao Yao
 
Optimising Data Using K-Means Clustering Algorithm
Optimising Data Using K-Means Clustering AlgorithmOptimising Data Using K-Means Clustering Algorithm
Optimising Data Using K-Means Clustering AlgorithmIJERA Editor
 
k-means Clustering and Custergram with R
k-means Clustering and Custergram with Rk-means Clustering and Custergram with R
k-means Clustering and Custergram with RDr. Volkan OBAN
 

Similar to K Means Clustering in ML.pptx (20)

K mean-clustering algorithm
K mean-clustering algorithmK mean-clustering algorithm
K mean-clustering algorithm
 
Scalable k-means plus plus
Scalable k-means plus plusScalable k-means plus plus
Scalable k-means plus plus
 
Lecture_3_k-mean-clustering.ppt
Lecture_3_k-mean-clustering.pptLecture_3_k-mean-clustering.ppt
Lecture_3_k-mean-clustering.ppt
 
Data Manipulation with Numpy and Pandas in PythonStarting with N
Data Manipulation with Numpy and Pandas in PythonStarting with NData Manipulation with Numpy and Pandas in PythonStarting with N
Data Manipulation with Numpy and Pandas in PythonStarting with N
 
Data analysis of weather forecasting
Data analysis of weather forecastingData analysis of weather forecasting
Data analysis of weather forecasting
 
Neural networks using tensor flow in amazon deep learning server
Neural networks using tensor flow in amazon deep learning serverNeural networks using tensor flow in amazon deep learning server
Neural networks using tensor flow in amazon deep learning server
 
8.clustering algorithm.k means.em algorithm
8.clustering algorithm.k means.em algorithm8.clustering algorithm.k means.em algorithm
8.clustering algorithm.k means.em algorithm
 
maXbox starter65 machinelearning3
maXbox starter65 machinelearning3maXbox starter65 machinelearning3
maXbox starter65 machinelearning3
 
maxbox starter60 machine learning
maxbox starter60 machine learningmaxbox starter60 machine learning
maxbox starter60 machine learning
 
k-mean-clustering.ppt
k-mean-clustering.pptk-mean-clustering.ppt
k-mean-clustering.ppt
 
k-mean-Clustering impact on AI using DSS
k-mean-Clustering impact on AI using DSSk-mean-Clustering impact on AI using DSS
k-mean-Clustering impact on AI using DSS
 
Computer Science Exam Help
Computer Science Exam Help Computer Science Exam Help
Computer Science Exam Help
 
DCSM report2
DCSM report2DCSM report2
DCSM report2
 
K-Means Algorithm Implementation In python
K-Means Algorithm Implementation In pythonK-Means Algorithm Implementation In python
K-Means Algorithm Implementation In python
 
Mini-lab 1: Stochastic Gradient Descent classifier, Optimizing Logistic Regre...
Mini-lab 1: Stochastic Gradient Descent classifier, Optimizing Logistic Regre...Mini-lab 1: Stochastic Gradient Descent classifier, Optimizing Logistic Regre...
Mini-lab 1: Stochastic Gradient Descent classifier, Optimizing Logistic Regre...
 
Project PPT
Project PPTProject PPT
Project PPT
 
Clustering.pptx
Clustering.pptxClustering.pptx
Clustering.pptx
 
K mean-clustering
K mean-clusteringK mean-clustering
K mean-clustering
 
Optimising Data Using K-Means Clustering Algorithm
Optimising Data Using K-Means Clustering AlgorithmOptimising Data Using K-Means Clustering Algorithm
Optimising Data Using K-Means Clustering Algorithm
 
k-means Clustering and Custergram with R
k-means Clustering and Custergram with Rk-means Clustering and Custergram with R
k-means Clustering and Custergram with R
 

More from Ramakrishna Reddy Bijjam

Arrays to arrays and pointers with arrays.pptx
Arrays to arrays and pointers with arrays.pptxArrays to arrays and pointers with arrays.pptx
Arrays to arrays and pointers with arrays.pptxRamakrishna Reddy Bijjam
 
Python With MongoDB in advanced Python.pptx
Python With MongoDB in advanced Python.pptxPython With MongoDB in advanced Python.pptx
Python With MongoDB in advanced Python.pptxRamakrishna Reddy Bijjam
 
Pointers and single &multi dimentionalarrays.pptx
Pointers and single &multi dimentionalarrays.pptxPointers and single &multi dimentionalarrays.pptx
Pointers and single &multi dimentionalarrays.pptxRamakrishna Reddy Bijjam
 
Certinity Factor and Dempster-shafer theory .pptx
Certinity Factor and Dempster-shafer theory .pptxCertinity Factor and Dempster-shafer theory .pptx
Certinity Factor and Dempster-shafer theory .pptxRamakrishna Reddy Bijjam
 
Auxiliary Memory in computer Architecture.pptx
Auxiliary Memory in computer Architecture.pptxAuxiliary Memory in computer Architecture.pptx
Auxiliary Memory in computer Architecture.pptxRamakrishna Reddy Bijjam
 

More from Ramakrishna Reddy Bijjam (20)

Arrays to arrays and pointers with arrays.pptx
Arrays to arrays and pointers with arrays.pptxArrays to arrays and pointers with arrays.pptx
Arrays to arrays and pointers with arrays.pptx
 
Auxiliary, Cache and Virtual memory.pptx
Auxiliary, Cache and Virtual memory.pptxAuxiliary, Cache and Virtual memory.pptx
Auxiliary, Cache and Virtual memory.pptx
 
Python With MongoDB in advanced Python.pptx
Python With MongoDB in advanced Python.pptxPython With MongoDB in advanced Python.pptx
Python With MongoDB in advanced Python.pptx
 
Pointers and single &multi dimentionalarrays.pptx
Pointers and single &multi dimentionalarrays.pptxPointers and single &multi dimentionalarrays.pptx
Pointers and single &multi dimentionalarrays.pptx
 
Certinity Factor and Dempster-shafer theory .pptx
Certinity Factor and Dempster-shafer theory .pptxCertinity Factor and Dempster-shafer theory .pptx
Certinity Factor and Dempster-shafer theory .pptx
 
Auxiliary Memory in computer Architecture.pptx
Auxiliary Memory in computer Architecture.pptxAuxiliary Memory in computer Architecture.pptx
Auxiliary Memory in computer Architecture.pptx
 
Random Forest Decision Tree.pptx
Random Forest Decision Tree.pptxRandom Forest Decision Tree.pptx
Random Forest Decision Tree.pptx
 
Pandas.pptx
Pandas.pptxPandas.pptx
Pandas.pptx
 
Python With MongoDB.pptx
Python With MongoDB.pptxPython With MongoDB.pptx
Python With MongoDB.pptx
 
Python with MySql.pptx
Python with MySql.pptxPython with MySql.pptx
Python with MySql.pptx
 
PYTHON PROGRAMMING NOTES RKREDDY.pdf
PYTHON PROGRAMMING NOTES RKREDDY.pdfPYTHON PROGRAMMING NOTES RKREDDY.pdf
PYTHON PROGRAMMING NOTES RKREDDY.pdf
 
BInary file Operations.pptx
BInary file Operations.pptxBInary file Operations.pptx
BInary file Operations.pptx
 
Data Science in Python.pptx
Data Science in Python.pptxData Science in Python.pptx
Data Science in Python.pptx
 
CSV JSON and XML files in Python.pptx
CSV JSON and XML files in Python.pptxCSV JSON and XML files in Python.pptx
CSV JSON and XML files in Python.pptx
 
HTML files in python.pptx
HTML files in python.pptxHTML files in python.pptx
HTML files in python.pptx
 
Regular Expressions in Python.pptx
Regular Expressions in Python.pptxRegular Expressions in Python.pptx
Regular Expressions in Python.pptx
 
datareprersentation 1.pptx
datareprersentation 1.pptxdatareprersentation 1.pptx
datareprersentation 1.pptx
 
Apriori.pptx
Apriori.pptxApriori.pptx
Apriori.pptx
 
Eclat.pptx
Eclat.pptxEclat.pptx
Eclat.pptx
 
Time Series.pptx
Time Series.pptxTime Series.pptx
Time Series.pptx
 

Recently uploaded

VIP High Class Call Girls Jamshedpur Anushka 8250192130 Independent Escort Se...
VIP High Class Call Girls Jamshedpur Anushka 8250192130 Independent Escort Se...VIP High Class Call Girls Jamshedpur Anushka 8250192130 Independent Escort Se...
VIP High Class Call Girls Jamshedpur Anushka 8250192130 Independent Escort Se...Suhani Kapoor
 
Customer Service Analytics - Make Sense of All Your Data.pptx
Customer Service Analytics - Make Sense of All Your Data.pptxCustomer Service Analytics - Make Sense of All Your Data.pptx
Customer Service Analytics - Make Sense of All Your Data.pptxEmmanuel Dauda
 
100-Concepts-of-AI by Anupama Kate .pptx
100-Concepts-of-AI by Anupama Kate .pptx100-Concepts-of-AI by Anupama Kate .pptx
100-Concepts-of-AI by Anupama Kate .pptxAnupama Kate
 
PKS-TGC-1084-630 - Stage 1 Proposal.pptx
PKS-TGC-1084-630 - Stage 1 Proposal.pptxPKS-TGC-1084-630 - Stage 1 Proposal.pptx
PKS-TGC-1084-630 - Stage 1 Proposal.pptxPramod Kumar Srivastava
 
VIP Call Girls Service Miyapur Hyderabad Call +91-8250192130
VIP Call Girls Service Miyapur Hyderabad Call +91-8250192130VIP Call Girls Service Miyapur Hyderabad Call +91-8250192130
VIP Call Girls Service Miyapur Hyderabad Call +91-8250192130Suhani Kapoor
 
Data Science Jobs and Salaries Analysis.pptx
Data Science Jobs and Salaries Analysis.pptxData Science Jobs and Salaries Analysis.pptx
Data Science Jobs and Salaries Analysis.pptxFurkanTasci3
 
Dubai Call Girls Wifey O52&786472 Call Girls Dubai
Dubai Call Girls Wifey O52&786472 Call Girls DubaiDubai Call Girls Wifey O52&786472 Call Girls Dubai
Dubai Call Girls Wifey O52&786472 Call Girls Dubaihf8803863
 
VIP High Profile Call Girls Amravati Aarushi 8250192130 Independent Escort Se...
VIP High Profile Call Girls Amravati Aarushi 8250192130 Independent Escort Se...VIP High Profile Call Girls Amravati Aarushi 8250192130 Independent Escort Se...
VIP High Profile Call Girls Amravati Aarushi 8250192130 Independent Escort Se...Suhani Kapoor
 
dokumen.tips_chapter-4-transient-heat-conduction-mehmet-kanoglu.ppt
dokumen.tips_chapter-4-transient-heat-conduction-mehmet-kanoglu.pptdokumen.tips_chapter-4-transient-heat-conduction-mehmet-kanoglu.ppt
dokumen.tips_chapter-4-transient-heat-conduction-mehmet-kanoglu.pptSonatrach
 
Call Girls In Mahipalpur O9654467111 Escorts Service
Call Girls In Mahipalpur O9654467111  Escorts ServiceCall Girls In Mahipalpur O9654467111  Escorts Service
Call Girls In Mahipalpur O9654467111 Escorts ServiceSapana Sha
 
{Pooja: 9892124323 } Call Girl in Mumbai | Jas Kaur Rate 4500 Free Hotel Del...
{Pooja:  9892124323 } Call Girl in Mumbai | Jas Kaur Rate 4500 Free Hotel Del...{Pooja:  9892124323 } Call Girl in Mumbai | Jas Kaur Rate 4500 Free Hotel Del...
{Pooja: 9892124323 } Call Girl in Mumbai | Jas Kaur Rate 4500 Free Hotel Del...Pooja Nehwal
 
꧁❤ Greater Noida Call Girls Delhi ❤꧂ 9711199171 ☎️ Hard And Sexy Vip Call
꧁❤ Greater Noida Call Girls Delhi ❤꧂ 9711199171 ☎️ Hard And Sexy Vip Call꧁❤ Greater Noida Call Girls Delhi ❤꧂ 9711199171 ☎️ Hard And Sexy Vip Call
꧁❤ Greater Noida Call Girls Delhi ❤꧂ 9711199171 ☎️ Hard And Sexy Vip Callshivangimorya083
 
Call Girls in Defence Colony Delhi 💯Call Us 🔝8264348440🔝
Call Girls in Defence Colony Delhi 💯Call Us 🔝8264348440🔝Call Girls in Defence Colony Delhi 💯Call Us 🔝8264348440🔝
Call Girls in Defence Colony Delhi 💯Call Us 🔝8264348440🔝soniya singh
 
Saket, (-DELHI )+91-9654467111-(=)CHEAP Call Girls in Escorts Service Saket C...
Saket, (-DELHI )+91-9654467111-(=)CHEAP Call Girls in Escorts Service Saket C...Saket, (-DELHI )+91-9654467111-(=)CHEAP Call Girls in Escorts Service Saket C...
Saket, (-DELHI )+91-9654467111-(=)CHEAP Call Girls in Escorts Service Saket C...Sapana Sha
 
High Class Call Girls Noida Sector 39 Aarushi 🔝8264348440🔝 Independent Escort...
High Class Call Girls Noida Sector 39 Aarushi 🔝8264348440🔝 Independent Escort...High Class Call Girls Noida Sector 39 Aarushi 🔝8264348440🔝 Independent Escort...
High Class Call Girls Noida Sector 39 Aarushi 🔝8264348440🔝 Independent Escort...soniya singh
 
Spark3's new memory model/management
Spark3's new memory model/managementSpark3's new memory model/management
Spark3's new memory model/managementakshesh doshi
 
Delhi Call Girls Punjabi Bagh 9711199171 ☎✔👌✔ Whatsapp Hard And Sexy Vip Call
Delhi Call Girls Punjabi Bagh 9711199171 ☎✔👌✔ Whatsapp Hard And Sexy Vip CallDelhi Call Girls Punjabi Bagh 9711199171 ☎✔👌✔ Whatsapp Hard And Sexy Vip Call
Delhi Call Girls Punjabi Bagh 9711199171 ☎✔👌✔ Whatsapp Hard And Sexy Vip Callshivangimorya083
 
(PARI) Call Girls Wanowrie ( 7001035870 ) HI-Fi Pune Escorts Service
(PARI) Call Girls Wanowrie ( 7001035870 ) HI-Fi Pune Escorts Service(PARI) Call Girls Wanowrie ( 7001035870 ) HI-Fi Pune Escorts Service
(PARI) Call Girls Wanowrie ( 7001035870 ) HI-Fi Pune Escorts Serviceranjana rawat
 

Recently uploaded (20)

VIP High Class Call Girls Jamshedpur Anushka 8250192130 Independent Escort Se...
VIP High Class Call Girls Jamshedpur Anushka 8250192130 Independent Escort Se...VIP High Class Call Girls Jamshedpur Anushka 8250192130 Independent Escort Se...
VIP High Class Call Girls Jamshedpur Anushka 8250192130 Independent Escort Se...
 
Customer Service Analytics - Make Sense of All Your Data.pptx
Customer Service Analytics - Make Sense of All Your Data.pptxCustomer Service Analytics - Make Sense of All Your Data.pptx
Customer Service Analytics - Make Sense of All Your Data.pptx
 
100-Concepts-of-AI by Anupama Kate .pptx
100-Concepts-of-AI by Anupama Kate .pptx100-Concepts-of-AI by Anupama Kate .pptx
100-Concepts-of-AI by Anupama Kate .pptx
 
PKS-TGC-1084-630 - Stage 1 Proposal.pptx
PKS-TGC-1084-630 - Stage 1 Proposal.pptxPKS-TGC-1084-630 - Stage 1 Proposal.pptx
PKS-TGC-1084-630 - Stage 1 Proposal.pptx
 
VIP Call Girls Service Miyapur Hyderabad Call +91-8250192130
VIP Call Girls Service Miyapur Hyderabad Call +91-8250192130VIP Call Girls Service Miyapur Hyderabad Call +91-8250192130
VIP Call Girls Service Miyapur Hyderabad Call +91-8250192130
 
Data Science Jobs and Salaries Analysis.pptx
Data Science Jobs and Salaries Analysis.pptxData Science Jobs and Salaries Analysis.pptx
Data Science Jobs and Salaries Analysis.pptx
 
Russian Call Girls Dwarka Sector 15 💓 Delhi 9999965857 @Sabina Modi VVIP MODE...
Russian Call Girls Dwarka Sector 15 💓 Delhi 9999965857 @Sabina Modi VVIP MODE...Russian Call Girls Dwarka Sector 15 💓 Delhi 9999965857 @Sabina Modi VVIP MODE...
Russian Call Girls Dwarka Sector 15 💓 Delhi 9999965857 @Sabina Modi VVIP MODE...
 
Dubai Call Girls Wifey O52&786472 Call Girls Dubai
Dubai Call Girls Wifey O52&786472 Call Girls DubaiDubai Call Girls Wifey O52&786472 Call Girls Dubai
Dubai Call Girls Wifey O52&786472 Call Girls Dubai
 
VIP High Profile Call Girls Amravati Aarushi 8250192130 Independent Escort Se...
VIP High Profile Call Girls Amravati Aarushi 8250192130 Independent Escort Se...VIP High Profile Call Girls Amravati Aarushi 8250192130 Independent Escort Se...
VIP High Profile Call Girls Amravati Aarushi 8250192130 Independent Escort Se...
 
dokumen.tips_chapter-4-transient-heat-conduction-mehmet-kanoglu.ppt
dokumen.tips_chapter-4-transient-heat-conduction-mehmet-kanoglu.pptdokumen.tips_chapter-4-transient-heat-conduction-mehmet-kanoglu.ppt
dokumen.tips_chapter-4-transient-heat-conduction-mehmet-kanoglu.ppt
 
꧁❤ Aerocity Call Girls Service Aerocity Delhi ❤꧂ 9999965857 ☎️ Hard And Sexy ...
꧁❤ Aerocity Call Girls Service Aerocity Delhi ❤꧂ 9999965857 ☎️ Hard And Sexy ...꧁❤ Aerocity Call Girls Service Aerocity Delhi ❤꧂ 9999965857 ☎️ Hard And Sexy ...
꧁❤ Aerocity Call Girls Service Aerocity Delhi ❤꧂ 9999965857 ☎️ Hard And Sexy ...
 
Call Girls In Mahipalpur O9654467111 Escorts Service
Call Girls In Mahipalpur O9654467111  Escorts ServiceCall Girls In Mahipalpur O9654467111  Escorts Service
Call Girls In Mahipalpur O9654467111 Escorts Service
 
{Pooja: 9892124323 } Call Girl in Mumbai | Jas Kaur Rate 4500 Free Hotel Del...
{Pooja:  9892124323 } Call Girl in Mumbai | Jas Kaur Rate 4500 Free Hotel Del...{Pooja:  9892124323 } Call Girl in Mumbai | Jas Kaur Rate 4500 Free Hotel Del...
{Pooja: 9892124323 } Call Girl in Mumbai | Jas Kaur Rate 4500 Free Hotel Del...
 
꧁❤ Greater Noida Call Girls Delhi ❤꧂ 9711199171 ☎️ Hard And Sexy Vip Call
꧁❤ Greater Noida Call Girls Delhi ❤꧂ 9711199171 ☎️ Hard And Sexy Vip Call꧁❤ Greater Noida Call Girls Delhi ❤꧂ 9711199171 ☎️ Hard And Sexy Vip Call
꧁❤ Greater Noida Call Girls Delhi ❤꧂ 9711199171 ☎️ Hard And Sexy Vip Call
 
Call Girls in Defence Colony Delhi 💯Call Us 🔝8264348440🔝
Call Girls in Defence Colony Delhi 💯Call Us 🔝8264348440🔝Call Girls in Defence Colony Delhi 💯Call Us 🔝8264348440🔝
Call Girls in Defence Colony Delhi 💯Call Us 🔝8264348440🔝
 
Saket, (-DELHI )+91-9654467111-(=)CHEAP Call Girls in Escorts Service Saket C...
Saket, (-DELHI )+91-9654467111-(=)CHEAP Call Girls in Escorts Service Saket C...Saket, (-DELHI )+91-9654467111-(=)CHEAP Call Girls in Escorts Service Saket C...
Saket, (-DELHI )+91-9654467111-(=)CHEAP Call Girls in Escorts Service Saket C...
 
High Class Call Girls Noida Sector 39 Aarushi 🔝8264348440🔝 Independent Escort...
High Class Call Girls Noida Sector 39 Aarushi 🔝8264348440🔝 Independent Escort...High Class Call Girls Noida Sector 39 Aarushi 🔝8264348440🔝 Independent Escort...
High Class Call Girls Noida Sector 39 Aarushi 🔝8264348440🔝 Independent Escort...
 
Spark3's new memory model/management
Spark3's new memory model/managementSpark3's new memory model/management
Spark3's new memory model/management
 
Delhi Call Girls Punjabi Bagh 9711199171 ☎✔👌✔ Whatsapp Hard And Sexy Vip Call
Delhi Call Girls Punjabi Bagh 9711199171 ☎✔👌✔ Whatsapp Hard And Sexy Vip CallDelhi Call Girls Punjabi Bagh 9711199171 ☎✔👌✔ Whatsapp Hard And Sexy Vip Call
Delhi Call Girls Punjabi Bagh 9711199171 ☎✔👌✔ Whatsapp Hard And Sexy Vip Call
 
(PARI) Call Girls Wanowrie ( 7001035870 ) HI-Fi Pune Escorts Service
(PARI) Call Girls Wanowrie ( 7001035870 ) HI-Fi Pune Escorts Service(PARI) Call Girls Wanowrie ( 7001035870 ) HI-Fi Pune Escorts Service
(PARI) Call Girls Wanowrie ( 7001035870 ) HI-Fi Pune Escorts Service
 

K Means Clustering in ML.pptx

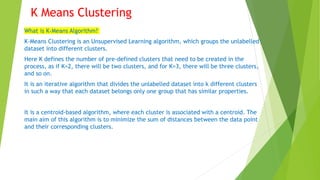
  • 1. K Means Clustering What is K-Means Algorithm? K-Means Clustering is an Unsupervised Learning algorithm, which groups the unlabelled dataset into different clusters. Here K defines the number of pre-defined clusters that need to be created in the process, as if K=2, there will be two clusters, and for K=3, there will be three clusters, and so on. It is an iterative algorithm that divides the unlabelled dataset into k different clusters in such a way that each dataset belongs only one group that has similar properties. It is a centroid-based algorithm, where each cluster is associated with a centroid. The main aim of this algorithm is to minimize the sum of distances between the data point and their corresponding clusters.
  • 2.  The k-means clustering algorithm mainly performs two tasks:  1. Determines the best value for K center points or centroids by an iterative process.  2. Assigns each data point to its closest k-center. Those data points which are near to the particular k-center, create a cluster.
  • 3.  How does the K-Means Algorithm Work?  The working of the K-Means algorithm is explained in the below steps:  Step-1: Select the number K to decide the number of clusters.  Step-2: Select random K points or centroids. (It can be other from the input dataset).  Step-3: Assign each data point to their closest centroid, which will form the predefined K clusters.  Step-4: Calculate the variance and place a new centroid of each cluster.  Step-5: Repeat the third steps, which means reassign each datapoint to the new closest centroid of each cluster.  Step-6: If any reassignment occurs, then go to step-4 else go to FINISH.  Step-7: The model is ready.  Let's take number k of clusters, i.e., K=2, to identify the dataset and to put them into different clusters. It means here we will try to group these datasets into two different clusters.
  • 4. Now we will assign each data point of the scatter plot to its closest K-point or centroid. From the above image, it is clear that points left side of the line is near to the K1 or blue centroid, and points to the right of the line are close to the yellow centroid.
  • 5. As we need to find the closest cluster, so we will repeat the process by choosing a new centroid. As our model is ready, so we can now remove the assumed centroids, and the two final clusters will be as shown in the below image:
  • 6.  In the given dataset, we have Customer_Id, Gender, Age, Annual Income ($), and Spending Score (which is the calculated value of how much a customer has spent in the mall, the more the value, the more he has spent).  From this dataset, we need to calculate some patterns, as it is an unsupervised method, so we don't know what to calculate exactly.  The steps to be followed for the implementation are given below:  Data Pre-processing  Finding the optimal number of clusters using the elbow method  Training the K-means algorithm on the training dataset  Visualizing the clusters
  • 7.  The numpy we have imported for the performing mathematics calculation, matplotlib is for plotting the graph, and pandas are for managing the dataset.  Importing the Dataset: Next, we will import the dataset that we need to use. So here, we are using the Mall_Customer_data.csv dataset. It can be imported using the below code:  import numpy as nm  import matplotlib.pyplot as mtp  import pandas as pd  dataset = pd.read_csv('Mall_Customers_data.csv')  print(dataset)  Extracting Independent Variables  Here we don't need any dependent variable for data pre-processing step as it is a clustering problem, and we have no idea about what to determine. So we will just add a line of code for the matrix of features.
  • 8.  Finding the optimal number of clusters using the elbow method  In the second step, we will try to find the optimal number of clusters for our clustering problem. So, as discussed above, here we are going to use the elbow method for this purpose.  Elbow method uses the WCSS concept to draw the plot by plotting WCSS values on the Y-axis and the number of clusters on the X-axis.  So we are going to calculate the value for WCSS for different k values ranging from 1 to 10. Below is the code for it:
  • 9.  #finding optimal number of clusters using the elbow method  from sklearn.cluster import KMeans  wcss_list= [] #Initializing the list for the values of WCSS   #Using for loop for iterations from 1 to 10.  for i in range(1, 11):  kmeans = KMeans(n_clusters=i, init='k-means++', random_state= 42)  kmeans.fit(x)  wcss_list.append(kmeans.inertia_)  mtp.plot(range(1, 11), wcss_list)  mtp.title('The Elobw Method Graph')  mtp.xlabel('Number of clusters(k)')  mtp.ylabel('wcss_list')  mtp.show()
  • 10.  we have created the wcss_list variable to initialize an empty list, which is used to contain the value of wcss computed for different values of k ranging from 1 to 10.  After that, we have initialized the for loop for the iteration on a different value of k ranging from 1 to 10; since for loop in Python, exclude the outbound limit, so it is taken as 11 to include 10th value.  The rest part of the code is similar as we did in earlier topics, as we have fitted the model on a matrix of features and then plotted the graph between the number of clusters and WCSS.
  • 11.  Training the K-means algorithm on the training dataset  As we have got the number of clusters, so we can now train the model on the dataset.  #training the K-means model on a dataset  kmeans = KMeans(n_clusters=5, init='k-means++', random_state= 42)  y_predict= kmeans.fit_predict(x)  Visualizing the Clusters  The last step is to visualize the clusters. As we have 5 clusters for our model, so we will visualize each cluster one by one.
  • 12.  #visulaizing the clusters  mtp.scatter(x[y_predict == 0, 0], x[y_predict == 0, 1], s = 100, c = 'blue', label = 'Cluster 1') #for first cluster  mtp.scatter(x[y_predict == 1, 0], x[y_predict == 1, 1], s = 100, c = 'green', label = 'Cluster 2') #for second cluster  mtp.scatter(x[y_predict== 2, 0], x[y_predict == 2, 1], s = 100, c = 'red', label = 'Cluster 3') #for third cluster  mtp.scatter(x[y_predict == 3, 0], x[y_predict == 3, 1], s = 100, c = 'cyan', label = 'Cluster 4') #for fourth cluster  mtp.scatter(x[y_predict == 4, 0], x[y_predict == 4, 1], s = 100, c = 'magenta', label = 'Cluster 5') #for fifth cluster  mtp.scatter(kmeans.cluster_centers_[:, 0], kmeans.cluster_centers_[:, 1], s = 300, c = 'yellow', label = 'Centroid' )  mtp.title('Clusters of customers')  mtp.xlabel('Annual Income (k$)')  mtp.ylabel('Spending Score (1-100)')  mtp.legend()  mtp.show()
  • 13.  Cluster1 shows the customers with average salary and average spending so we can categorize these customers as Cluster1  Cluster2 shows the customer has a high income but low spending, so we can categorize them as careful.  Cluster3 shows the low income and also low spending so they can be categorized as sensible.  Cluster4 shows the customers with low income with very high spending so they can be categorized as careless.  Cluster5 shows the customers with high income and high spending so they can be categorized as target, and these customers can be the most profitable customers for the mall owner.
  • 14.  import numpy as nm  import matplotlib.pyplot as mtp  import pandas as pd  dataset = pd.read_csv('Mall_Customers_data.csv')  print(dataset)  x = dataset.iloc[:, [3, 4]].values  print(x)  #finding optimal number of clusters using the elbow method  from sklearn.cluster import KMeans  wcss_list=[]  #Initializing the list for the values of WCSS  #Using for loop for iterations from 1 to 10.  for i in range(1,11):  kmeans=KMeans(n_clusters=i,init='k-means++',random_state=42)  kmeans.fit(x)  wcss_list.append(kmeans.inertia_)  mtp.plot(range(1,11),wcss_list)  mtp.title('The Elobw Method Graph')
  • 15.  mtp.xlabel('Number of clusters(k)')  mtp.ylabel('wcss_list')  mtp.show()  #training the K-means model on a dataset  kmeans = KMeans(n_clusters=5, init='k-means++', random_state= 42)  y_predict= kmeans.fit_predict(x)  #visulaizing the clusters  mtp.scatter(x[y_predict == 0, 0], x[y_predict == 0, 1], s = 100, c = 'blue', label = 'Cluster 1') #for first cluster  mtp.scatter(x[y_predict == 1, 0], x[y_predict == 1, 1], s = 100, c = 'green', label = 'Cluster 2') #for second cluster  mtp.scatter(x[y_predict== 2, 0], x[y_predict == 2, 1], s = 100, c = 'red', label = 'Cluster 3') #for third cluster  mtp.scatter(x[y_predict == 3, 0], x[y_predict == 3, 1], s = 100, c = 'cyan', label = 'Cluster 4') #for fourth cluster  mtp.scatter(x[y_predict == 4, 0], x[y_predict == 4, 1], s = 100, c = 'magenta', label = 'Cluster 5') #for fifth cluster  mtp.scatter(kmeans.cluster_centers_[:, 0], kmeans.cluster_centers_[:, 1], s = 300, c = 'yellow', label = 'Centroid')  mtp.title('Clusters of customers')  mtp.xlabel('Annual Income (k$)')  mtp.ylabel('Spending Score (1-100)')  mtp.legend()  mtp.show()