New information system for enhancing climate & water governance

The Enhanced functionality and capability of web-based information systems is critical for enhancing climate, environment and water governance. Particularly, flexibility in various options for spatial and temporal selection of information is of high importance. Tropical cyclones are the most destructive weather systems that impact on Australia and countries in the Pacific and Indian Oceans. Historically tropical cyclones have had major impacts on agriculture, water supplies, safety and economic well being, and in extreme cases threatened the sustainability of countries. Improved data availability for historical cyclones through the Tropical Cyclone Data Portal with enhanced functionality and capability to display historical cyclone information in the Pacific and Indian Oceans, including the Australian region is undertaken in the Pacific-Australia Climate Change Science and Adaptation Planning program (PACCSAP). Through a collaborative project between the Bureau of Meteorology and the School of Computer Science and Information Technology at RMIT University we have improved functionality of the tropical cyclone data portal with the ability to draw any region of interest on the map and search for cyclones within that region, whilst focusing on maintaining a consistent and intuitive user interface.

Recommended
More Related Content
What's hot
What's hot (20)
Similar to New information system for enhancing climate & water governance
Similar to New information system for enhancing climate & water governance (20)
Recently uploaded
Recently uploaded (17)
New information system for enhancing climate & water governance
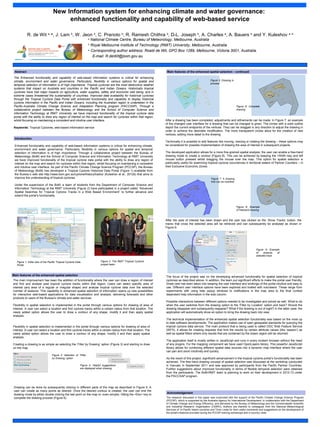
- 1. New Information system for enhancing climate and water governance: enhanced functionality and capability of web-based service R. de Wit a, ♣ , J. Lam b , W. Jeon b , C. Pranoto b , R. Ramesh Chithra b , D-L. Joseph b , A. Charles a , A. Bauers b and Y. Kuleshov a, b a National Climate Centre, Bureau of Meteorology, Melbourne, Australia b Royal Melbourne Institute of Technology (RMIT) University, Melbourne, Australia ♣ Corresponding author address: Roald de Wit, GPO Box 1289, Melbourne, Victoria 3001, Australia. E-mail: R.deWit@bom.gov.au Abstract The Enhanced functionality and capability of web-based information systems is critical for enhancing climate, environment and water governance. Particularly, flexibility in various options for spatial and temporal selection of information is of high importance. Tropical cyclones are the most destructive weather systems that impact on Australia and countries in the Pacific and Indian Oceans. Historically tropical cyclones have had major impacts on agriculture, water supplies, safety and economic well being, and in extreme cases threatened the sustainability of countries. Improved data availability for historical cyclones through the Tropical Cyclone Data Portal with enhanced functionality and capability to display historical cyclone information in the Pacific and Indian Oceans, including the Australian region is undertaken in the Pacific-Australia Climate Change Science and Adaptation Planning program (PACCSAP). Through a collaborative project between the Bureau of Meteorology and the School of Computer Science and Information Technology at RMIT University we have improved functionality of the tropical cyclone data portal with the ability to draw any region of interest on the map and search for cyclones within that region, whilst focusing on maintaining a consistent and intuitive user interface. Keywords: Tropical Cyclones, web-based information service Drawing can be done by subsequently clicking in different parts of the map as described in Figure 5. A user can create as many points as desired. Once the desired contour is created, the user can end the drawing mode by either double clicking the last point on the map or, even simpler, hitting the <Esc> key to complete the drawing process (Figure 6). The research discussed in this paper was conducted with the support of the Pacific Climate Change Science Program (PCCSP), which is supported by the Australia Agency for International Development, in collaboration with the Department of Climate Change and Energy Efficiency, and delivered by the Bureau of Meteorology and the Commonwealth Scientific and Industrial Research Organisation (CSIRO). Authors are thankful to colleagues from the National Meteorological Services of 14 Pacific Island countries and Timor Leste for their useful comments and suggestions on the development of the portal’s features provided during the PCCSP training workshops and in-country visits. Enhanced functionality and capability of web-based information systems is critical for enhancing climate, environment and water governance. Particularly, flexibility in various options for spatial and temporal selection of information is of high importance. Through a collaborative project between the Bureau of Meteorology (BoM) and the School of Computer Science and Information Technology at RMIT University we have improved functionality of the tropical cyclone data portal with the ability to draw any region of interest on the map and search for cyclones within that region, whilst focusing on maintaining a consistent and intuitive user interface. As part of the Pacific Climate Change Science Program (PCCSP), the Bureau of Meteorology (BoM) has developed a Tropical Cyclone Historical Data Portal (Figure 1) available from the Bureau’s web site http://www.bom.gov.au/cyclone/history/tracks/ (Kuleshov et al., 2012b) that aims to improve the understanding of tropical cyclones. Under the supervision of the BoM, a team of students from the Department of Computer Science and Information Technology at the RMIT University (Figure 2) have participated in a project called “Advanced Spatial Searches for Tropical Cyclone Tracks in a Web Based Environment” to further advance and extend the portal’s functionality. After the area of interest has been drawn and the user has clicked on the ‘Show Tracks’ button, the tracks that cross the selected area will be retrieved and can subsequently be analysed as shown in Figure 9. Acknowledgement Figure 1: Initial view of the Pacific Tropical Cyclone Data Portal. Introduction Main features of the enhanced spatial selection - continued Main features of the enhanced spatial selection Flexibility in spatial selection is implemented in the portal through various options for drawing of area of interest. A user can select a location and find cyclone tracks within a certain radius from that location. The newly added option allows the user to draw a contour of any shape, modify it and then apply spatial analysis. Creating a drawing is as simple as selecting the ‘Filter by Drawing’ option (Figure 3) and starting to draw on the map. The main improvement has been the addition of functionality where the user can draw a region of interest and find and analyse past tropical cyclone tracks within that region. Users can select specific area of interest (any area of a regular or irregular shape) and analyse tropical cyclone data over the selected number of seasons. This capability in enhanced spatial selection of information opens up new possibilities for interactive web-based applications for data visualisation and analysis, delivering forecasts and other products to users of the Bureau's climate and water services. Flexibility in spatial selection is implemented in the portal through various options for drawing of area of interest. A user can select a location and find cyclone tracks within a certain radius from that location. The newly added option allows the user to draw a contour of any shape, modify it and then apply spatial analysis. After a drawing has been completed, adjustments and refinements can be made. In Figure 7, an example of the changed user interface for a drawing that can be changed is given. The circles with a solid outline depict the current endpoints of the vertices. They can be dragged in any direction to adjust the drawing in order to achieve the desirable modification. The more transparent circles allow for the creation of new vertices, adding more detail to the drawing. Technically it is possible to add features like moving, resizing or rotating the drawing – these options may be considered for possible implementation of drawing the area of interest in subsequent projects. The developed application allows for a more fine-grained spatial analysis: the user can enable a free-hand drawing mode to create a contour (Figure 8). This can be achieved by keeping the <Shift>-key and left mouse button pressed whilst dragging the mouse over the map. This option for spatial selection is particularly useful for examining tropical cyclone occurrences in territorial waters of Partner Courtiers – in their Exclusive Economic Zones. Figure 3: Selection of “Filter by Drawing: option Figure 2. The RMIT Tropical Cyclone project team. Figure 4: Helpful suggestions are displayed when drawing Figure 5: Drawing in process Figure 6: Complete drawing Figure 7: A drawing that can be modified Figure 8: Example of freehand drawing The focus of the project was on the developing advanced functionality for spatial selection of tropical cyclones as described above. In addition, the team put significant efforts to make the portal user friendly. Great care has been taken into keeping the user interface and workings of the portal intuitive and easy to use. Different user interface options have been explored and trialled with volunteers. These range from experiments with using help popup windows to notifications in the map area to the final context dependent help information in the side column. Possible interactions between different options needed to be investigated and solved as well. What to do when the user switches from the drawing option to the ‘Filter by Location’ option and back? Should the drawing disappear and subsequently reappear? What if the drawing is out of sight? In the latter case, the application will automatically show an option to bring the drawing back into view. The technical implementation of the enhanced spatial selection functionality was based on the most up to date software developments. The application makes use of open geospatial standards for querying the tropical cyclone data service. The main protocol that is being used is called OGC Web Feature Service (WFS). It allows for creating requests that limit the results by certain attribute values (like ‘season’) as well as spatial filters where only results that are contained by the drawn region will be returned. The application itself is mostly written in JavaScript and runs in every modern browser without the need of any plugins. For the mapping component we have used OpenLayers library. This powerful JavaScript library allows for combining different spatial data sources into a dynamic map interface where the user can pan and zoom intuitively and quickly. As the result of this project, significant advancement in the tropical cyclone portal’s functionality has been achieved. The free hand drawing concept of spatial selection was discussed at the workshop conducted in Vanuatu in September 2011 and was approved by participants from the Pacific Partner Countries. Further suggestions about improved functionality in terms of flexible temporal selection were obtained from the participants. The BoM-RMIT team is planning to work on their development in 2012-13 under the PACCSAP program. Figure 9: Example of analysis of selected track