Cold test nodal and distorsion analysis
•
0 likes•28 views

Cold test nodal and distorsion analysis

Recommended
Recommended
More Related Content
Similar to Cold test nodal and distorsion analysis
Similar to Cold test nodal and distorsion analysis (20)
More from Ra'uf Tailony
More from Ra'uf Tailony (17)
Recently uploaded
Recently uploaded (20)
Cold test nodal and distorsion analysis
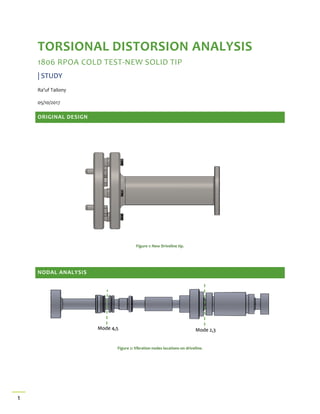
- 1. 1 TORSIONAL DISTORSION ANALYSIS 1806 RPOA COLD TEST-NEW SOLID TIP | STUDY Ra’uf Tailony 05/10/2017 ORIGINAL DESIGN Figure 1: New Driveline tip. NODAL ANALYSIS Figure 2: Vibration nodes locations on driveline. Mode 2,3Mode 4,5
- 2. 2 Figure 3: Torque and speed signatures (ramping 0-2000 rpm). MODELING ASSUMPTIONS Homogeneous material along the driveline (AISI 4130 steel Annealed at 860 0 C). All parts are rotating at the same speed (relative angular velocity=0). Electrical motor slipping is neglected. Residual friction is neglected. All considered bearings are ball bearing type with zero lateral forces. Center of gravity is assumed to be static on a dynamic assembly. Geometry is treated as a fixed-free structure. Rayleigh’s equations solution is exact with no iteration. Ramping up speed = 1500 rpm Ramping down speed = 1500 rpm - 1500 rpm is a critical speed. - Critical Frequency = 230 - 280 Hz. - Critical Modes are 1, 2 and/or 3. - Critical Excitation order is 12th order (Engine and E-motor 12th orders are coinciding). OBSERVATIONS
- 3. 3 INITIAL CONDITIONS Input torque = 300 N.m. Rotational speed range = 0 - 2000 rpm. Centrifugal force is proportional to the driveline’s speed. Excitation diagram is dependent on a standard V8 engine specifications. FREQUENCY ANALYSIS RESULTS Figure 4: Mode shape vs. Frequency with and without E-motor bearing.
- 4. 4 INTERFERENCE DIAGRAMS AND CRITICAL SPEEDS Figure 5: Campbell diagram for mode1 (bearing considered) and mode3 (bearing ignored). NARROWING ROOT CAUSE PROBLEM Figure 6: Original driveline components nodal effects. Mode 1 effect Mode 2,3 effect
- 5. 5 Mode “E-motor bearing ignored” Freq. [Hz] “E-motor bearing considered” Freq. [Hz] 1 104 2301 2 120 600 3 280 615 4 815 1050 5 816 1080 Table 1: Frequencies vs. modes. 1 Highlighted frequencies are found in the torque signatures.