Find here attached presentation of seminar on GROUP approach, why we need GROUP approach at present...
Content... SHG'S, FIG'S, FFS, LBA, VSS. WS, DAIRY COOPERATIVES, FARMERS ORGANIZATIONS and more
Python Notes for mca i year students osmania university.docx
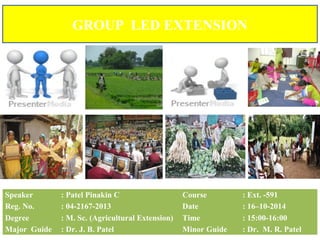
Group led extension by Pinakin C Patel
1. GROUP LED EXTENSION
Speaker : Patel Pinakin C Course : Ext. -591
Reg. No. : 04-2167-2013 Date : 16–10-2014
Degree : M. Sc. (Agricultural Extension) Time : 15:00-16:00
Major Guide : Dr. J. B. Patel Minor Guide : Dr. M. R. Patel
2. INTRODUCTION
WHAT IS GROUP ?
CHARACTERISTICS OF GROUP
WHAT IS GROUP LED EXTENSION
TYPES OF GROUP
FARMER’S ORGANIZATION
REVIEW OF LITERATURE
CASE STUDY
SUCCESS STORY
CONCLUSION
FUTURE THRUST 1
4. What is a Group ?
A collection of individuals who have regular contact and frequent
interaction, mutual influence, common feeling and who work together
to achieve a common set of goals.
3
5. Characteristics of Group
Small in size
4
Needed resources
Common objectives
Interaction between members
Interdependency between members
Shared responsibilities
Works together
Measure their progress towards goal
Blend of skills
6. A way of disseminating
information and technologies
on Agricultural and Rural
development through group
of farmers
What is Group Led
Extension?
5
7. Informal Group :
Self Help Group: Social issues
Farmer Interest Groups / Commodity Interest Groups : MANAGE
Formal Group :
Cooperatives: Autonomous
Livestock Breeders Association: Overall health
Watershed Association: Resource management
Vana Samrakshana Samithis: Forest Protection
Labour associations: Own issues
Dairy cooperatives: Dairy farmer
TYPES OF GROUPS
6
8. Benefits of Farmer Groups
Share the farm implements, machinery, planting material and other
resources, ideas, experiences and problems.
Organize different services.
Strengthen bargaining power with traders.
Provide a forum for extension agents to introduce new technologies.
Reduce public extension cost.
Seek advices from different organizations.
Disseminate information to wide spectrum of users.
Make extension services more client driven.
7
9. Reasons for Group Led Extension
Efficiency
Effectiveness
Collective action
Equity
8
11. Recognition it gets from various bodies
Focus on income generating activities
Abilities of members
Visible benefits to its members
Extension officials support
Participatory approaches
Linkages with people and organizations
Tie up with other development
programmes
Inter group linkages
Capacity building of farmer groups
Recognition it gets from various bodies
Focus on income generating activities
Abilities of members
Visible benefits to its members
Extension officials support
Participatory approaches
Linkages with people and organizations
Tie up with other development
programmes
Inter group linkages
Capacity building of farmer groups
Success of Farmer Groups…
10
16. The functions of FIG areThe functions of FIG are
Ensuring optimal production planning, meeting the market and
household food security needs
Maintaining common infrastructure - farm ponds, bore wells, tractors
and other
Equipment which cannot be afforded by one farmer but can be owned
by 20 farmers together
Linking with the local government at Panchayat level to access NREGA,
Watersheds and other agriculture development funds.
15
17. Number of members in a FIG – 15 to 20 (in small habitations, the number
may be 15only).
Age – above 18 years having a common interest
Resident of the village
While promoting FIGs, different other community institutions promoted in
the area under various government and non-government programmes have
to be kept in view.
The details of such institutions, lessons learnt etc. have to be kept in view
while promoting FIG’s.
Characteristics of the FIGCharacteristics of the FIG
16
19. The Concept & Objectives of SHG’s
It generally aims to…..
[a] Regularly save the amount from out of their earnings
[b] Collectively agree to contribute to a common fund
[c] Meeting their emergency needs
[d] Taking democratic decisions
[e] Resolving conflicts through discussions in open forum
[f] Providing surety-free loans at market driven rates to
members
18
20. Advantages of Self-Help Groups
The advantages of SHGs are:
Low transaction cost.
Effectiveness in supervision.
Easy credit delivery to the poor.
Minimum procedures.
Better recycling of funds.
19
21.
22. Objectives & Principles of FFS
Grow a healthy crop
Conserve natural enemies of crop pests
Conduct regular field observations
Make farmers competent in their own field
Reduce production costs
The farmers are participating in weekly meetings during a
full cropping season.
They learn important ecological principles by managing
learning plots and experiments themselves.
30 farmers form an FFS that is facilitated by two trainers.
The discussion between farmers is the pulling force in FFS
21
24. S. No. Benefits Mean
score
Rank
1. Reduced work load
76.88 I
2. Increased income 75.56 II
3. Better status and decision making
power
62.24 III
4. Better access to credit facility 61.20 IV
5. Participation in social service and
organized action
54.95 V
6. Repaid loans
44.60 VI
n = 134
Table 1: Benefits obtained by farmers under SHG
Nirmala and Kavika (2004)Pondicherry
23
25. Table 2: IMPACT ON SHG WOMEN MEMBERS
Sr.
No
Empowerment Variables Mean Std. dev Rank
I
Decision making
pattern
4.52 1
Education of children 3.43 0.922
Family planning 4.29 0.794
Buying and selling land,
property and household
goods
4.05 0.959
II
Economic
Empowerment
4.32 2
Make household
purchases
4.12 0.667
Increased income 3.78 0.736
Access to loans 4.07 1.089
Control of use of credit 3.68 0.745
24
26. Sr. No Empowerment Variables Mean Std. dev Rank
III Psychological aspects 4.26 3
Hope 3.89 0.521
Overall satisfaction 4.25 0.761
IV Confidence building 4.23 4
Confidence to talk within
family
4.22 0.561
Confidence to talk in SHG
meeting
3.42 0.661
Confidence to talk in public 4.14 0.588
Improvement in technical
and practical skills through
training
4.32 0.735
Acquisition of skills for
income generation
4.12 0.667
25
27. Sr. No Empowerment Variables Mean Std. dev Rank
VI Self esteem 4.18 5
Self image in community 4.16 0.761
Self reliance/independence 4.20 0.909
Das (2005)Assam
26
28. Table 3 : Impact on Annual income of the fisherwomen
SHGs
Annual Income level
(Amount in Rs)
Before enrolling in SHGs After enrolling in SHGs
No % No %
Up to Rs 9,600 408 56.27 117 16.14
9,600-24,000 183 25.25 365 50.35
24,001-48,000 105 14.48 185 25.51
Above 48,000 29 04.00 58 08.00
Jayraman (2005)Tamilnadu
n=725
27
29. S.
No.
Monthly
Income
Before joining
SHGs
After joining
SHGs
1. No Income 30 (25.00%) 00 (00.00%)
2. Below 300 22 (18.33%) 20 (16.67%)
3. 301-600 36 (30.00%) 25 (20.83%)
4. 601-900 21 (17.50%) 48 (40.00%)
5. 901-1200 9 (7.50%) 17 (14.17%)
6. Above
1200
2 (1.67%) 10 (8.33%)
Total 120 (100.00%) 120 (100.00%)
Kanyakumari (Kerala) Ramacharan and Balakrishnan
(2005)
Table 4: Impact of Women’s Self Help Group in terms of
Income
n=120
28
30. Knowledge
level
Farmers
Trained Untrained Total
No. % No. % No. %
High 32 53 19 32 51 42
Medium 12 20 14 23 26 22
Low 16 27 27 45 43 36
total 60 100 60 100 120 100
n=120
Table 5 : Overall knowledge of farmers of FFS in respect of
IPM in rice
Krishnamurthy and Veerbhadraiah (1999)Bangalore
29
31. Adoption
level
Farmers
Trained Untrained Total
No. % No. % No. %
High 29 48 14 23 43 36
Medium 20 33 20 34 29 24
Low 11 19 26 43 48 40
total 60 100 60 100 120 100
Table 6 :Overall adoption level of farmers of FFS in respect
of IPM in rice
Bangalore
30
n=120
Krishnamurthy and Veerbhadraiah(1999)
32. FFS
participants
Andino
participants
Non-
participants
Number of
Participants
45 (100 %) 64(100 %) 329(100%)
Knowledge aspects
Knowledge on late
blight
35 (77.77 %) 29 (45.31%) 24 (7.29%)
Knowledge on
Andean weevil
25 (55.55%) 14 (21.87%) 9 (2.73%)
Knowledge on
potato tuber moth
15 (33.33%) 17 (26.56%) 6 (1.82%)
Pesticide
knowledge
29 (64.44%) 25 (39.06%) 21 (6.38%)
Knowledge on
resistant varieties
43 (95.55 %) 33 (51.56%) 16 (4.86%)
Table 7 :Knowledge Comparisons Across Groups of Farmers
Godtland et al.,(2004)Peru
31
33. Sr.No Crop Area
in ha
Average yield Q/ha Per cent
age
increase in
yield
FFS plot
yield
Local plot
yield
1 Paddy 5.6 61.00 44.74 36.34
2 Hybrid
maize
2.4 50.00 32.17 55.42
3 Sunflower 2.4 22.20 17.00 30.58
4 Ground
nut
1.6 21.70 18.60 16.66
5 Ragi 1.6 30.20 22.22 35.91
6 Tomato 0.8 24.45
(t/ha)
20.20 (t/ha) 21.03
Anonymous (2005)
Table 8 :Average yield of major crops considered in FFS
Karnataka
32
34. Kg/ha Figure 1 : Comparison of rice yield between FFS and non
FFS fields during Kharif
Verma et al.,(2007)Karnataka
33
35. Figure 2 : Comparison of Cost of Cultivation before and
after programme
Karnataka
34
Verma et al.,(2007)
36. Level of knowledge
Beneficiaries Non-beneficiaries
Category Mean Score Category Mean Score
High 1.15 High 0.85
Medium 0.63 Medium 0.70
Low 0.30 Low 0.36
Total 2.08 Total 1.91
Table 9 :Impact of FFS on knowledge of participants
about improved wheat production technology
Raghuvanshi et al., (2012)M.P
n=60
35
37. Fig 3 : Overall knowledge level of Maize farmers of FFS
Bangalore
PERCENTAGE
36
Sunitha et al., (2013)
38. Fig 4 : Overall knowledge level of Finger millet farmers of FFSPERCENTAGE
Sunitha et al., (2013)Bangalore
37
39. Table 10: Impact on productivity and income by adoption of HYVs in
a group assisted by ATMA through NAIP project
Sr. No Crop
Productivity (kg/ha) Income (Rs/ha)
Per cent
increase in
incomeBefore After Before After
Kharif
1 Castor 1763 2268 52890 68040 28.64
2 Pigeonpea 934 1078 23045 27165 17.87
3 Maize 656 1100 21495 31980 67.21
Rabi
4 Mustard 1958 2180 36490 40900 10.78
5 Wheat 3281 3710 28750 32500 13.04
Anonymous (2014)Banaskantha
38
40. Sr. No Crop
Productivity (kg/ha) Income (Rs/ha)
Per cent
increase in
incomeBefore After Before After
Kharif
1 Maize 763 2268 9576 27216 184.21
2 Pigeonpea 532 685 15960 20550 28.76
3 Paddy 726 966 10890 14490 33.06
Rabi
4 Gram 558 810 19530 28350 45.16
5 Wheat 1839 2640 27585 39600 43.56
Dahod
Table 11: Impact on productivity and income by adoption of HYVs in
a group assisted by ATMA through NAIP project
Anonymous (2014)
39
41. Sr. No Crop
Productivity (kg/ha) Income (Rs/ha)
Per cent
increase
in incomeBefore After Before After
Kharif
1 Pigeon pea 1087 1445 27175 39878 46.75
2
Cotton
(Sanali)
420 seed
165 cotton
615 seed
215 cotton
105000 191000 81.90
3
Cotton
(Vagdadi)
-
585 seed
190 cotton
- 181350 -
Table 12 : Impact on productivity and income from seed production in a group
as assisted by Bio-Seeds Pvt. Ltd. Through NAIP project.
Anonymous (2014)Banaskantha
40
42. Sr. No Crop
Productivity (kg/ha) Income (Rs/ha)
Per cent
increase
in incomeBefore After Before After
Dahod
1 Maize 870 1210 13050 18150 39.00
2 Soybean 810 1290 21060 33540 59.25
Dangs
1 Groundnut 1200 1580 30000 55300 84.33
Table 13 : Impact on productivity and income from seed production in a group
as assisted by Bio-Seeds Pvt. Ltd. Through NAIP project.
Anonymous (2014)Dahod & Dang
41
43. Sr.
No
Crop
Productivity (kg/ha) Income (Rs/ha)
Per cent
increase
in income
As
compar
ed to
wheat
crop
Rs.
28750
Before After Before After
1 Okra
New
Crops
4200
New
Crops
45000 56.51
2 Chilli 3000 27000 6.08
3 Brinjal 4116 41160 43.16
4 Cowpea 2800 45000 56.52
5 Clusterbean 3800 51550 79.30
Table 14 : Impact on productivity and income from crop diversification in a
group as assisted by Mahyco-Seeds Pvt. Ltd. Through NAIP project.
Anonymous (2014)Banaskantha
42
44. Sr.
No
Crop
Productivity (kg/ha) Income (Rs/ha)
Per cent
increase
in income
As
compare
d to
Gram
crop Rs.
28750
Before After Before After
1 Okra
New
Crops
4200
New
Crops
45000 65.09
2 Brinjal 4116 41160 36.67
3 Cowpea 2800 45000 78.40
4 Clusterbean 3800 51550 85.72
5 Marigold 2000 14000 27.64
6 Soybean 1277 28103 45.23
Table 15 : Impact on productivity and income from crop diversification in a
group as assisted by Mahyco-Seeds Pvt. Ltd. Through NAIP project.
Anonymous (2014)Dahod
43
45. CASE STUDIES OF SUCCESSFUL
FARMERS' ORGANIZATIONS IN
INDIA
44
46. AMUL Registered on 1 December 1946
AMUL is Co-Operative Society Headquarter-Anand, Gujarat, India
Founder – Dr. Verghese Kurien
3.18 million milk producer member families.
www.amul.com
AIM of AMUL
1.Establishment of a direct linkage between milk producers and consumers by
eliminating middlemen.
2.Milk Producers (farmers) control procurement, processing and marketing.
3.Professional management.
AMUL is the largest food brand in India.
World's Largest Pouched Milk Brand with an annual turnover of US $2.54 Billion
(2012–13).
Currently Unions making up GCMMF have 3.18 million producer members with
milk collection average of 16.8 million liters per day.
45
47. Co-operative in AMUL
Village Dairy
Co-ope.
Society
Dist. Milk
Co-op. Union
State Co-op.
Milk Mktg Fed.
The Consumer
Milk Producer
46
48. IFFCO
www.iffco.com
On 3 November 1967 Indian Farmers Fertilizer Cooperative Limited (IFFCO) was
registered as a Multi-unit Co-operative Society
IFFCO commissioned an ammonia - urea complex at Kalol and the NPK/DAP plant at
Kandla both in the state of Gujarat in 1975. Another ammonia - urea complex was set up at
Phulpur in the state of Uttar Pradesh in 1981. The ammonia - urea unit at Aonla was
commissioned in 1988.
It was an unique venture in which the farmers of the country through their own Co-
operative society created this new institution to safeguard their interests. The number of
co-operative society associated with IFFCO have risen from 57 in 1967 to 39,824 at
present. 47
49. The IFC was established during 1996 by KVK, Babaleshwar, Ahmednagar
district in Maharashtra.
Financial assistance from NABARD.
Initially started with of 60 farmers in three villages.
“Innovative Farmers Clubs” In ahemadnagar district of
maharashtra.
Achievements:
Collective purchases and marketing- 18 farmers clubs, brand name of
SRIRAM.
Saving 10-15 per cent in input cost and getting 20-25 per cent more in market
prices.
Export quality production of pomegranate and grapes by 20 farmers clubs.
Now 144 farmers clubs have been established in 144 villages with 3168
volunteers (farmers).
48
50. Rural Biofuel Growers Association, Hadonahally
Benefits:
Direct procurement ensure correct measurement and assured price (2.5 times more).
Availability of fresh and quality oil locally.
Availability of high quality cake to the farmers locally.
Reduction of over head charges.
Bio fuel
plant
Seeds
crushed
<kg>
Cost of
seeds
(Rs.)
Yield (kg) Income (Rs.)
Oil Cake Oil Cake Gross
Net
income
Pongamia
39,02
5
5,85,375 9756 27317 4,03,436 3,47,742 7,51,178 1,65303
Neem 100
100
0
8 70 480
140
0
1880 880
Castor 350
700
0
7500 500
5,93,375 9764 27387 4,03,916 3,49,142 7,60,558 1,67,183
Other operational cost (electricity, labour. Bank Interest, etc. 1,02,183
Castor seeds were procured @ Rs.20/kg & sold the seeds by keeping Rs.500 as profit
49
51. Hobli Jack Growers Association Kachahalli.
Jack Growers Association was mooted during April 2007
Total members : 65
Organization of Jack Melas
Byelaws formed and related activities have been taken up
Total 15,956 seedlings were raised and sold and generated an
income of Rs. 2,39,340
Jack Growers Association was mooted during April 2007
Total members : 65
Organization of Jack Melas
Byelaws formed and related activities have been taken up
Total 15,956 seedlings were raised and sold and generated an
income of Rs. 2,39,340
50
56. Cashew Ratna in MAHARASHTRA
Cashew growers in Ratnagiri formed into groups
and marketed cashew under the name of Cashew
Ratna and obtain benefit.
Commodity Based Groups – Block Level
Processors Group – District level
Grading, Packing, Marketing
Cashew growers in Ratnagiri formed into groups
and marketed cashew under the name of Cashew
Ratna and obtain benefit.
Commodity Based Groups – Block Level
Processors Group – District level
Grading, Packing, Marketing
55
57. Processors
Group
1 2 3 4
Block Level Processors
Group
District Level Processor
& Farmer Orgn.
Common
Godown
•Grading
•Packing
•Further grading
•Packing
•Marketing
State :Maharashtra
District :Ratnagiri
CASHEW RATNA
Commodity Based Groups 56
58. Mango Fair – A leap towards Direct Marketing
Alphanso predominant
horticultural crop in
Ratnagiri, Kokan's region
of Maharashtra.
99% of growers sell the
produce at 1/4th price that
too through middle men
Sindhudurg district
organised Mango fair in
Mumbai and farmers got
4 times as compared to
earlier prices.
57
59. Success of WIGs
The women dairy farmers of Penumur village of
Chittoor have formed as WIG. Most of the group
members are land less labourers and
represented to provide loan amount for leasing
of land to raise green fodder. ATMA has
provided Rs.2000/- to the group to take up the
land on lease. The group members have leased
the land and raised Fodder Jowar SSG5912
and Maize African Tall in the plot. The group
has successfully raised the green fodder crop in
the waste land and fed the milk animals, there
by increased their milk yield.
58
60. Challenges to group-led extension
Different mind setup
Farmers active participation
Information technology
Diverse conditions
Group intelligence
Governmental Policy
59
61. Conclusion
GLE has the impact on various activities such as empowerment
of women through increasing decision making pattern,
strengthening economic background.
It helps in reducing the workload of the group members.
Public, Private extension agencies and NGOs should involve
farmer groups.
GLE helps in increasing the level of knowledge on particular
aspect subsequently boost up the adoption rate of newer
technology which ultimately helps them to get higher productivity
that leads to fetch more income.
Extension strategies should involve in groups.
60
62. Future thrust
Policy decision to contact farmers in groups instead of individual
contacts
Groups should be demand driven
Group formation could be taken up where some NGOs / societies are
working
Disseminate the message about the advantages of group formation
Size of the group should be kept small
Demonstrate the process of group formation by organizing visits of
group of farmers to already developed active farmers groups in nearby
areas
61
Over the last five and a half decades, Dairy Cooperatives in Gujarat have created an economic network that links more than 3.18 million village milk producers with millions of consumers in India These cooperatives collect on an average 16.8 million litres of milk per day from their producer members.
More than 70% of whom are small, marginal farmers and landless and include a sizeable population of tribal folk and people belonging to the scheduled castes.