
Recommended
Recommended
More Related Content
What's hot
What's hot (19)
Similar to Optimization of far infrared vacuum drying conditions for miang leaves (camellia sinensis var. assamica) using response surface methodology
Similar to Optimization of far infrared vacuum drying conditions for miang leaves (camellia sinensis var. assamica) using response surface methodology (20)
Recently uploaded
Recently uploaded (20)
Optimization of far infrared vacuum drying conditions for miang leaves (camellia sinensis var. assamica) using response surface methodology
- 1. Food Sci. Biotechnol. 24(2): 461-469 (2015) DOI 10.1007/s10068-015-0061-8 Optimization of Far-infrared Vacuum Drying Conditions for Miang Leaves (Camellia sinensis var. assamica) Using Response Surface Methodology Sathira Hirun, Jeong-Hwa Choi, Jutatip Ayarungsaritkul, Chonnipa Pawsaut, Chanutchamon Sutthiwanjampa, Quan V Vuong, Suwimol Chockchaisawasdee, Young-Ran Heo, and Christopher J Scarlett Received April 17, 2014; revised Septe,ber 22, 2014; accepted September 29, 2014; published online April 30, 2015 © KoSFoST and Springer 2015 Abstract Far-infrared (FIR) vacuum is an advanced drying technique that has recently been applied in food processing. Optimal drying conditions for processing tea from Miang leaves using FIR vacuum drying were investigated. Response surface methodology with a central composite design was used to design, analyze, and predict the optimal time and temperature conditions for FIR vacuum drying, taking into account the physicochemical properties of Miang leaves. When the temperature increased from 50 to 65o C and the time from 60 to 120 min, the amount of epicatechin, epicatechin gallate, epigallocatechin gallate, and total catechins significantly (p<0.05) increased while the moisture content and water activity significantly (p<0.05) decreased, compared with controls. The physicochemical properties of dried Miang leaves were significantly (p>0.05) influenced by time and temperature, compared with controls. Drying conditions of 65o C for 120 min are recommended for optimization of drying. Keywords: green tea, Miang leaves, epigallocatechin gallate, antioxidant activity, catechin, infrared-vacuum drying Introduction Miang (Camellia sinensis var. assamica) is widely grown in Southeast Asia, including the northern part of Thailand. Leaves are usually harvested 4-5 times a year for preparation of traditional tea pickles. Miang leaves are known to contain high levels of phenolic compounds (179-325 gallic acid equivalents (GAE) mg/g) and possess a high antioxidant capacity (1). The phenolic compound, epigallocatechin gallate (EGCG), is abundant in Miang leaves at a level of 18.50-32.74 mg/g (2). EGCG is well known for health promoting properties, such as anti-carcinogenic and anti- arteriosclerotic effects. Therefore, consumption of Miang tea may have multiple potential health benefits. Miang tea is processed via several steps, including heating, rolling, and drying. Miang leaves are traditionally dehydrated using the sun or pan drying. However, during the traditional drying process, the variables of sunlight, temperature, and individual skill/experience can affect product quality. Inconsistencies during drying can affect levels of phenolic compounds including EGCG which is known to be sensitive to heat (3). Therefore, delineating Sathira Hirun (), Quan V Vuong, Suwimol Chockchaisawasdee, Christopher J Scarlett Pancreatic Cancer Research, Nutrition, Food and Health Research Group and The University of Newcastle, Ourimbah NSW 2258, Australia Tel: +612-43484045; Fax: +612-43484145 E-mail: moddakorn77@yahoo.com Jeong-Hwa Choi School of Environmental and Life Sciences, The University of Newcastle, Ourimbah NSW 2258, Australia Human Economics Research Institute, Chonnam National University, Gwangju 500-757, Korea Jutatip Ayarungsaritkul, Chonnipa Pawsaut, Chanutchamon Sutthiwanjampa Division of Food Science and Technology, Faculty of Agro-industry, Chiang Mai University, Chiang Mai 50200, Thailand Jutatip Ayarungsaritkul, Chonnipa Pawsaut Department of Food Science and Biotechnology, National Chung Hsing University, Taichung 402, Taiwan Chanutchamon Sutthiwanjampa Faculty of Applied Marine Biotechnology and Engineering, Gangneung- Wonju National University, Gangneung, Gangwon 210-702, Korea Young-Ran Heo Division of Food and Nutrition, College of Human Ecology, Chonnam National University, Gwangju 500-757, Korea RESEARCH ARTICLE
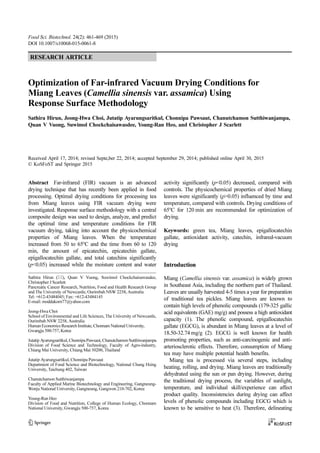
- 2. 462 Hirun et al. the optimal drying method for Miang leaves is critical, since drying contributes to the quality of Miang tea and to levels of phenolic compounds retained in leaves. Recently, far-infrared (FIR) vacuum drying has been used as an advanced drying technique due to a number of advantages. Compared to other drying methods, FIR vacuum drying has a high energy efficiency, short drying time, fast response of heating and drying, easy installation, and low capital cost (4,5). FIR vacuum drying has been used effectively for drying the agricultural materials such as welsh onion (5), carrot slices (4), banana slices (6), and mulberry leaves (7). This technique improved the physical properties of these dried agricultural products and also preserved bioactive components. Thus, the FIR method may be suitable for optimal drying of Miang leaves for preparation of Miang tea. To date, FIR drying of Miang leaves has not been studied. The aim of this study was to investigate the effects of time and temperature conditions of FIR vacuum drying on the physical and chemical properties of dried Miang leaves, and to determine optimal drying conditions for Miang leaves. Materials and Methods Treatment of Miang leaves Miang leaves of uniform size (3-6 cm in width and 7-16 cm in length) and maturity and free from disease were obtained from a Miang forest in Doi Saket district, Chiang Mai, Thailand during October, November, and December of 2010. Fresh Miang leaves were cleaned by rinsing with running tap water, then air dried at room temperature in a laboratory. Two hundred g of leaves (per batch) were then steamed at 100ºC for 2 min to stop the activity of polyphenol oxidase in the leaves. After steaming, leaves were kneaded using a double arm mixer to break the cellular structures so that the color and flavor of the leaves would be released when infused. Rolled leaves were then ready for FIR. A far infrared vacuum dryer A pilot scale FIR vacuum dryer (Febix International Co., Ltd., Bangkok, Thailand) was used (Fig. 1). The chamber (45 cm×100 cm) of the dryer was fitted with FIR heat sources (4×500 watt) on 2 sides of the chamber. The pressure in the chamber was controlled using a vacuum pump. Temperature and pressure in the chamber were controlled using a system controller. The pressure of the dryer was set at 400 mmHg. Experimental design Response surface methodology (RSM) using a central composite design (CCD) was used to investigate the effects of drying temperature and time with FIR vacuum drying on the physicochemical properties of Miang leaves. Eighteen experimental runs were designed using JMP® software version 9 (SAS Institute Inc. Cary, NC, USA) with a factorial 23 in the CCD (9 factorial points, 5 central points, and 5 another points). Based on a preliminary investigation (data not shown), 3 different drying temperatures of 50.0, 57.5, and 65.0o C and drying times of 60, 90, and 120 min were used. Natural levels and coded patterns are shown in Tables 2 and 4 with dependent responses. The physical and chemical properties of lightness (L*), hue angle (h*), chroma (C*), water activity (aw), moisture content (MC), epicatechin (EC), epicatechin gallate (ECG), epigallocatechin gallate (EGCG), total catechin, and total polyphenol contents (TPC) were determined. The DPPH assay was applied to measure the efficacy of the Miang leaf extract for scavenging free radicals (50% effective concentration = EC50). Experimental data were fitted to a second order response surface model of the form: (1) where the y value is the investigated response, β0, βj, βjj, and βij, are constant coefficients of intercept, linear, quadratic, and interaction terms, respectively, and Xi and Xj are coded independent variables (drying temperature and time). Statistical analysis was performed using RSM software JMP® version 9. Data were analyzed using an analysis of variance (ANOVA) at a significance level of p=0.05. The adequacy of the model was evaluated using the coefficient of determination (r2 ) and the model p value. Determination of the free radical scavenging capacity using a DPPH assay Crude Miang leaf extracts were prepared for a DPPH assay. Ten g of dried and ground Miang leaves was dissolved in 50 mL of 95% methanol and mixed at 8.5×g using a shaker for 4.5 h at room y β0 βjXj j 1 = k ∑ βjjXj 2 j 1 = k ∑ βijXiXj i j ∑ ∑ + + + = Fig. 1. A schematic diagram of the FIR vacuum dryer.
- 3. Drying Miang Leaves using Far Infrared Vacuum drying 463 temperature. This crude mixture was then reconstituted by dissolution of 1 g in 10 mL of methanol, then filtered (Whatman grade No. 4 filter paper), and evaporated at 50o C for 30 min. The extract was obtained after freeze- drying the concentrated mixture at −40o C for 24 h. The DPPH assay described by Masuda et al. (8) with modification was used to determine the DPPH free radical scavenging capacity of Miang extracts. The crude methanol extract was serially diluted from 10−2 to 10−8 , then 0.1 mL of each dilution was transferred into a sample tube containing 0.5 mL of a 5 mM DPPH solution. Mixtures were incubated for 20 min in darkness, then the absorbance was measured at 517 nm. The decrease of DPPH bleaching (%) was calculated based on measurement of the solution absorbance. The DPPH activity was recorded as the EC50 value representing the amount of antioxidant substance required to inhibit 50% of the remaining DPPH radicals. Determination of TPC levels The TPC level was determined using the method described by Ragazzi and Veronese (9) with modification. Briefly, 0.5 mL of 10−1 - 10−3 concentrations of a diluted methanol extract was added to test tubes containing 2.5 mL of 10% (v/v) Folin- Ciocalteu’s reagent with water. Within 7 min, 2.0 mL of a sodium carbonate solution (7.5% w/v) was added. Tubes were then allowed to stand at room temperature for 60 min before the absorbance at 775 nm was measured against water. The TPC value was expressed as gallic acid equivalent (GAE) in mg/g of material (dry basis). Determination of the catechin level using HPLC The level of total catechins and individual levels of the 3 major catechins (EC, EGCG, and ECG) in Miang leaf extracts were evaluated using HPLC analysis. The crude extract sample was prepared by brewing 1 g of ground and dried Miang leaves in 100 mL of deionized water at 90o C for 30 min. The sample was immediately put on ice to cool to room temperature to minimize degradation of phenolic compounds. The infusion was then filtered through a 0.45- µm filter. Each sample was injected onto a Shimadzu HPLC system (Shimadzu Scientific Instruments (Oceania) Pty. Ltd, Rydlmere, NSW, Australia) 3 times for analysis. HPLC conditions for determination of total catechin and individual EC, EGCG, and ECG levels followed Hirun and Roach (3). A Shimadzu HPLC system was computer controlled using the SCL-10A VP system controller with VP 5.03 software, a GT-154 degasser, an FCV-10AL mixer, an LC- 10AD liquid chromatography pump, using an SIL-10AXL VP auto injector with a 20 µL loop, an SPD-10A UV-VIS detector, a CTO-10Avp column oven, and a CBM-10A communications BUS module. Chromatographic separation was performed using a C18 reversed-phase column. Mobile phase A consisted of 0.2% (v/v) phosphoric acid (86%), acetonitrile (12%) (v/v), and tetrahydofuran (1.5%) (v/v). Mobile phase B consisted of 0.2% phosphoric acid (73.5%) (v/v), acetonitrile (25%) (v/v), and tetrahydrofuran (1.5%) (v/v). The flow rate of the mobile phase was 1 mL/ min. Mobile phase compositions were 100% A during the first 30 min, followed by an increase in B from 0% to 100% during the next 10 min, then 100% B for 20 min, followed by a decrease in B from 100% to 0% for 10 min, and finally A for 20 min before the next injection. External standard stock solutions of EC, EGCG, and ECG (all 200 µg/mL) were prepared in deionized water. To make working standard solutions, Serial dilution was carried out using deionized water containing the internal standard 4-amino salicylic acid. All standard working solutions were injected onto the HPLC system 3 times and the average area of the standard working solutions for each constituent divided by the average area of the internal standards plotted against each external standard concentration was used for generation of standard curves. Color Measurement Miang leaf color was measured using a Minolta Colorimeter (CR-400; Minolta Co, Ltd., Tokyo, Japan). Hunter scale values (L*, a*, and b*) were used (L*=0 for black, L*=100 for white, a*0 for green, a* for red, b*0 for blue, and b*0 for yellow). Chroma (C*), indicating the color intensity, was calculated as (10): (2) The hue angle (h*) from 0 or 360o indicates a red hue and 270, 180, and 90o indicate blue, green, and yellow hues, respectively. The h* value was calculated as (10): (3) Determination of the moisture content and water activity The moisture content (MC) was determined following the hot air oven method (103±2o C for 24 h) in triplicate (11). Data were expressed as g in 100 g on a dry basis (g/100 g db). A water activity meter (AquaLab Pre, AquaLab, Decagon Devices Inc., Pullman, WA, USA) was used to measure the water activity (aw) of Miang leaves. Results and Discussion Physical and chemical properties of fresh Miang leaves Physicochemical properties of fresh Miang leaves are shown in Table 1. Fresh Miang leaves had a green and slightly yellow color (L*=44.8±3.41, C*=21.08±2.51, h*= 88.17±0.09). The moisture content of fresh Miang leaves was 74.60±0.20%, and the total ash content was approximately 1.43% of the fresh leaf weight. Fresh leaves had a C∗ a∗2 b∗2 + = h∗ tan 1 – b∗ a∗ ----- - ⎝ ⎠ ⎛ ⎞ =
- 4. 464 Hirun et al. relatively high TPC level (7.23±0.89 mg of GAE/g) and free radical scavenging capacity (EC50=83.12±1.12 mg/g). However, the TPC and EC50 values of fresh Miang leaves were lower than for Chinese tea leaves reported in previous studies (87.0±2.2 mg of GAE/g and 52.15±0.25, respectively) (12,13). In addition, the fresh Miang leaves used in this study had lower amounts of EC, ECG, EGCG, and total catehins in comparison with values of 1.19, 6.25, 0.56, and 8.02 mg/g reported previously (2), probably due to differences in climate, season, horticultural practices, variety, leaf age, and leaf position on the harvested shoot (14). Impact of time and temperature of FIR vacuum drying on chemical properties and antioxidant capacities of dried Miang leaves RSM was applied to examine the effects of drying temperature and time on physicochemical properties of Miang leaf extracts, and to optimize FIR vacuum drying conditions for production of Miang tea. EC, ECG, EGCG, and total catechin levels for different time (t) and temperature (T) conditions for FIR vacuum drying are shown in Table 2. For all combinations of temperature and time, FIR vacuum drying resulted in significantly (p0.05) increased levels of EC, ECG, and Table 1. Physical and chemical properties of fresh Miang leaves Properties Fresh Miang leaves Lightness (L*) 44.88±3.411) Hue angle (h*) 88.17±0.09 Chroma 21.08±2.51 Radical scavenging ability (EC50) (mg/g dry basis) 83.12±1.12 Total polyphenol content (TPC) (mg GAE /g dry basis) 07.23±0.89 Epigallocatechin gallate (EGCG) (mg/g dry basis) 00.56±0.02 Epicatechin (EC) (mg/g dry basis) 01.19±0.04 Epicatechin gallate (ECG) (mg/g dry basis) 06.25±0.02 Total catechins (mg/g dry basis) 08.02±0.03 Moisture content (%) 74.67±0.20 Water activity (aw) 00.98±0.01 Ash (%) 01.43±0.17 1) Values are means±SD (n=3). Table 2. Variables and chemical responses of Miang leaves dried using an FIR vacuum dryer Variables Responses Run Pattern Temperature (o C) Time (min) EC ECG EGCG Total catechins EC50 TPC 1 0A 57.5 120 2.34 7.65 4.49 14.48 80.03 9.44 2 0a 57.5 60 2.31 6.71 3.29 12.31 94.85 8.37 3 + 50 120 2.56 6.04 3.26 11.86 73.19 7.70 4 A0 65 90 2.52 7.21 6.35 16.08 91.02 8.82 5 + 65 60 2.24 5.48 4.14 11.86 71.04 8.44 6 ++ 65 120 4.23 7.59 7.81 19.63 80.02 10.65 7 A0 65 90 2.48 7.03 6.22 15.73 80.01 10.26 8 a0 50 90 1.96 7.06 2.45 11.47 91.31 8.94 9 0 57.5 90 2.37 5.37 4.36 12.1 73.01 7.49 10 50 60 1.36 8.16 3.19 12.71 92.45 8.62 11 0a 57.5 60 2.18 7.01 3.23 12.42 83.41 8.12 12 ++ 65 120 3.33 7.64 8.12 19.09 92.04 9.42 13 50 60 1.31 7.89 3.19 12.39 70.05 6.34 14 0 57.5 90 2.58 4.35 5.47 12.40 83.51 8.61 15 + 65 60 2.12 5.41 4.08 11.61 80.08 9.7 16 0A 57.5 120 2.54 7.58 4.81 14.93 69.99 8.13 17 a0 50 90 1.5 7.56 2.43 11.49 83.51 7.94 18 + 50 120 2.48 5.96 3.54 11.98 93.83 6.17
- 5. Drying Miang Leaves using Far Infrared Vacuum drying 465 EGCG in dried Miang leaves, compared with fresh Miang leaves (Table 1). In addition, Miang leaves irradiated at 65o C for 120 min (run 6) contained the highest amounts of EC (4.23 mg/g, dry basis) and EGCG (19.63 mg/g, dry basis), respectively. Polyphenols are sensitive to high temperatures and degradation of beneficial compounds occurs easily during the drying process. However, FIR drying did not significantly (p0.05) affect the stability of polyphenols, compared with controls, while drying enhanced the level of phenolic compounds in the dried product. An increased level of polyphenols in green tea subjected to FIR vacuum drying has been reported where FIR increased amounts of ECG and EGCG in dried green tea leaves by 90 and 38%, respectively (15). During the drying process, FIR creates internal heat due to increased molecular vibration. FIR produces electromagnetic waves of wavelengths longer than 4 µm and shorter than microwaves (λ0.1 cm). Therefore, FIR apparently has the capability to release covalent bonds and liberate the flavonoid antioxidants, carotene, tannin, ascorbate, and polyphenols from repeating polymers (16). FIR probably does not strongly affect the molecular stability. However, FIR increases the level of polyphenols. A number of studies support FIR based on increases in amounts of the phenolic compounds (gallic acid, protocatechuic acid, benzoic acid, and (+)-catechin) in some dried products. However, each phenolic compound in plants has a unique structure, so the effect of FIR on liberation of antioxidant compounds may differ (17). Further studies with respect to the effects of FIR on the stability of phenolic compounds are required. In order to examine the impact of the variables time (t) and temperature (T) on the chemical properties of Miang leaf extracts, ANOVA was performed. In the ranges of 60- 120 min and 50-65o C, increases in the t and T values of FIR radiation had a significant (p0.01) impact on the amounts of EC, EGCG, and total catechins, but not on the amount of ECG (Table 3). However, an interaction of drying temperature and time showed no significant (p0.05) effect for EC, with significant (p0.05) effects for ECG, Fig. 2. Interaction effects of EC (A), ECG (B), EGCG (C), total catechins (D), and drying time (min) and drying temperature (o C) of Miang leaves.
- 6. 466 Hirun et al. EGCG, and total catechins, compared with controls. The quadratic terms T2 and t2 had no significant (p0.01) effects on amounts of EC, ECG, and EGCG, but T2 had a significant (p0.05) effect on total catechin, compared with controls. Increased amounts of EC, ECG, EGCG, and total catechins with temperature and time are shown in Fig. 2. The regression equation for actual levels of variables was: C=2.265+0.479X1+0.496X2+0.104X1X2−0.046X1 2 +0.182X2 2 (4) ECG=6.113−0.192X1+0.15X2+1.049X1X2+0.474X1 2 +0.497X2 2 (5) EGCG=4.352+1.555X1+0.908X2+0.911X1X2 +0.290X1 2 −0.115X2 2 (6) TC=12.732+1.841X1+1.555X2+2.063X1X2+X1 2 +0.562X2 2 (7) where X1 is the FIR radiational temperature minus 57.5 and divided by 7.5, and X2 is the FIR radiational time minus 90 and divided by 30. Phenolics are the most active antioxidant compounds in plants and have been linked with a number of health benefits (7). Miang leaves dried at 65o C for 120 min (run 6) had the highest TPC value, similar to the study of Lee et al. (18) in which an increase in FIR radiation resulted in a higher TPC level in dried samples. ANOVA results are shown in Table 3. The irradiation temperature had a significant (p0.05) effect, but the irradiation time did not significantly (p0.05) affect the TPC level in dried leaves, compared with controls. There was no interaction between radiation temperature and time on TPC levels. The quadratic terms T2 and t2 had no significant (p0.05) effect on TPC levels, compared with controls. TPC values increased when the radiation temperature increased (Fig. 3) The EC50 value in response to FIR vacuum drying conditions is shown in Table 2. A lower EC50 value indicated a stronger free radical scavenging capacity. Miang leaves dried at 57.5o C for 120 min (run 16) had the highest radical-scavenging activity (69.99 mg/L), followed by Miang leaves dried at 50o C for 120 min (run 13) (70.05 mg/L). However, FIR radiation temperature (50-65o C) and time (60-120 min) had no significant (p0.05) effects on EC50 values of dried Miang leaves, compared with controls. The regression equations for EC50 and TPC were: EC50=8.527+0.965X1+0.16X2+0.377X1X2+0.223X1 2 −0.251X2 2 (8) TPC=82.12−0.844X1−0.232X2+2.05X1X2+2.415X1 2 −1.98X2 2 (9) where X1 is FIR radiational temperature minus 57.5 and divided by 7.5, and X2 is the FIR radiational time minus 90 and divided by 30. Impact of FIR vacuum drying conditions on the physical properties of dried Miang leaves The moisture content (MC) and water activity (aw) are both important for dried foods. A high aw value causes food spoilage and deterioration (19). Therefore, low MC and aw values are desirable for dried foods. MC and aw values of dried Miang leaves in response to conditions of FIR vacuum drying are shown in Table 4. An increase in FIR radiation temperature and time caused a decrease in MC and aw values of dried Miang leaves. The lowest MT and aw values were at 65°C Table 3. ANOVA of Miang leaves dried using an FIR vacuum dryer Source df EC ECG EGCG Total catechins EC50 TPC Sum of squares p-value ProbF Sum of squares p-value ProbF Sum of squares p-value ProbF Sum of squares p-value ProbF Sum of squares p-value ProbF Sum of squares p-value ProbF Model 5 5.941 0.001* 11.40 0.040* 45.95 0.000* 107.13 0.000* 81.859 0.97 13.07 0.055 Error 12 1.780 8.201 3.277 3.218 1185.85 10.51 C.Total 17 7.722 19.60 49.22 110.35 1256.71 23.16 Temp 1 2.755 0.001* 0.444 0.435 29.01 0.000* 40.697 0.000* 8.551 0.773 11.17 0.038* time 1 2.960 0.001* 0.270 0.541 9.906 0.000* 29.025 0.000* 0.644 0.937 0.307 0.564 Temp x time 1 0.086 0.460 8.799 0.003* 6.641 0.000* 34.068 0.000* 33.702 0.570 1.140 0.276 Temp2 1 0.008 0.815 0.900 0.273 0.337 0.288 2.069 0.017* 23.280 0.636 0.199 0.641 time2 1 0.132 0.364 0.988 0.254 0.053 0.666 1.266 0.05 15.681 0.697 0.253 0.600 Lack of fit 3 1.206 0.013 7.447 0 2.506 0.003 2.771 0 346.869 0.351 2.133 0.542 Pure error 9 0.573 0.754 0.771 0.447 838.978 8.373 Total error 12 1.780 8.201 3.277 3.218 1185.85 10.50 r2 0.769 0.581 0.933 0.97 0.064 0.554 r2 Adjusted 0.673 0.407 0.905 0.958 -0.325 0.368 Root mean square error 0.385 0.826 0.522 0.517 9.940 0.935 Mean of response 2.356 6.761 4.469 13.586 82.408 8.508 Observations 18 18 18 18 18 18
- 7. Drying Miang Leaves using Far Infrared Vacuum drying 467 for 120 min (run 6). Temperature and time conditions of FIR irradiation had significant (p0.01) effects on MC and aw values of dried Miang leaves, compared with controls (Table 5). However, the interaction of temperature and of T2 , and of t2 had no significant (p0.05) effects MC and aw values of dried Miang leaves, compared with controls. Higher irradiation temperatures and longer times produced lower MC and aw values (Fig. 3). The regression equations for actual levels of variables were: Moisture content=22.282−9.931X1−5.582X2 +1.576X1X2−3.411X1 2 +0.756X2 2 (10) aw=0.547−0.196X1−0.124X2+0.074X1X2 −0.0026X1 2 +0.023X2 2 (11) where X1 is the FIR radiational temperature minus 57.5 and divided by 7.5, and X2 is the FIR radiational time minus 90 and divided by 30. Color is an important physicochemical property of food products that affects consumer sensory acceptance. The impact of FIR vacuum drying conditions on color parameters (L*, C* and h*) of dried Miang leaves were examined and results are shown in Table 4. Miang leaves dried at 65o C for 120 min (run 6) had the highest L* value, while Miang leaves dried at 57.90o C for 90 min (run 14) had the highest C* value. The h* value indicated that all dried Miang leaves were green and slightly yellow (h*= 87.90-88.42o ). However, the irradiation temperature and time had no significant (p0.05) effect on the color of dried Miang leaves, compared with controls (Table 5). Neither the interaction of irradiation temperature (T) and time (t), nor T2 and t2 had significant (p0.05) effects on the color parameters of dried Miang leaves, compared with controls. Non-significant effects of FIR drying on color have been reported. Compared to hot-air drying, FIR drying did not change the color of Mulberry leaves (7). Therefore, FIR vacuum drying is an appropriate drying method for tea processing. The regression equation for actual levels of the variables was: L*=40.837−1.290X1−0.94X2+0.405X1X2 −0.154X1 2 +1.598X2 2 (12) Chroma=23.903+1.05X1−0.42X2+0.992X1X2 −0.365X1 2 −0.505X2 2 (13) h*=88.256+0.022X1+0.069X2+0.034X1X2 −0.077X1 2 −0.505X2 2 (14) where X1 is FIR radiational temperature minus 57.5 and divided by 7.5, and X2 is the FIR radiational time minus 90 and divided by 30. Optimization of drying Miang leaves using an FIR vacuum dryer The main objective of this study was to determine the best drying conditions for Miang leaves using an FIR vacuum dryer. In this study, a desirability function was developed for maximum EGCG, EC, ECG, and TPC levels. EC50, MC, and aw values were also considered. Using second order polynomial models for prediction of optimum conditions for drying Miang leaves resulted in predicted optimal conditions of 65o C and 120 min. To validate these predicted optimum conditions, Miang leaves were dried in triplicate to confirm similarities of predicted and experimental values. Experimental results for MC aw, L*, h*, and C* values were 5.97±0.16%, 0.27±0.03, 41.25±1.73, 88.05±0.07, and 24.19±1.71, respectively. All physical properties matched well with predicted values. Furthermore, the values of the chemical properties EC50, TPC, EGCG, EC, and ECG values of the dried Miang leaves were 80.02±0.07 mg/L, 9.42±1.28 mg of GAE/g dry basis, 8.21±0.45 mg/g (dry basis), 4.16±0.79 Fig. 3. Interaction effects of total polyphenol content, moisture content (A), water activity (B), drying time (min), and drying temperature (o C) of Miang leaves.
- 8. 468 Hirun et al. mg/g (dry basis), and 8.08±0.81 mg/g (dry basis), respectively. These values were also similar to predicted values. Therefore, the optimal drying conditions using infrared-vacuum were 65o C and 120 min. This study investigated optimal conditions for improvements in physicochemical properties and high TPC and catechin levels from Miang leaves dried using the FIR vacuum drying technique. RSM was used for optimization of drying conditions using a CCD with 2 factors at 3 levels of irradiation temperature (50, 57, and 65ºC) and time (60, 90, and 120 min). The pressure of the oven was set at 400 mm Hg and 200 g of fresh Miang leaves was used per batch. RSM indicated that increasing drying temperatures and longer drying times significantly (p0.05) decreased aw and MC values, compared with controls. The highest EGCG and EC levels were present in Miang leaves dried Table 4. Variables and physical responses of Miang leaves dried using an FIR vacuum dryer Variables Responses Run Pattern Temperature (o C) Time (min) Moisture content (%) aw L* Chroma h* 1 0A 57.5 120 13.64 0.54 37.29 24.40 88.42 2 0a 57.5 60 32.05 0.83 43.38 18.15 88.25 3 + 50 120 20.05 0.51 45.64 22.22 88.13 4 A0 65 90 6.080 0.37 34.80 24.91 88.11 5 + 65 60 12.78 0.40 38.69 28.95 87.99 6 ++ 65 120 6.130 0.26 45.64 22.22 88.13 7 A0 65 90 6.570 0.35 37.29 21.88 88.64 8 a0 50 90 26.65 0.77 43.62 18.20 88.26 9 0 57.5 90 27.98 0.49 45.58 22.25 88.12 10 50 60 43.65 0.94 44.55 22.64 88.14 11 0a 57.5 60 20.78 0.48 43.87 21.78 88.19 12 ++ 65 120 5.970 0.28 40.75 25.30 88.07 13 50 60 26.66 0.94 43.57 27.68 87.90 14 0 57.5 90 23.88 0.46 43.62 29.03 88.01 15 + 65 60 13.08 0.45 45.58 22.25 88.12 16 0A 57.5 120 12.34 0.49 37.68 25.79 88.40 17 a0 50 90 28.89 0.84 39.50 25.69 88.09 18 + 50 120 23.89 0.46 41.36 16.48 88.27 Table 5. ANOVA for Miang leaves dried using an FIR vacuum dryer Source df Moisture aw L* Chroma h* Sum of squares p-value ProbF Sum of squares p-value ProbF Sum of squares p-value ProbF Sum of squares p-value ProbF Sum of squares p-value ProbF Model 5 1,626 0.000* 0.692 0.000* 42.22 0.686 24.78 0.892 0.102 0.709 Error 12 298.4 0.115 162.9 187.2 0.417 C.Total 17 1,924 0.807 205.1 211.9 0.519 Temp 1 1,183 0.000* 0.464 0.000* 19.995 0.248 13.23 0.375 0.006 0.683 time 1 373.9 0.002* 0.184 0.001* 10.60 0.394 2.116 0.719 0.057 0.223 Temp x time 1 19.88 0.388 0.043 0.054 1.312 0.761 7.880 0.490 0.009 0.617 Temp2 1 46.56 0.196 0 0.958 0.095 0.934 0.532 0.856 0.024 0.422 time2 1 2.290 0.766 0 0.962 10.22 0.402 1.020 0.802 0.005 0.694 Lack of fit 3 71.29 0.460 0.046 0.181 103.8 0.022 67.67 0.236 0.205 0.093 Pure error 9 227.2 0.069 59.04 119.5 0.211 Total error 12 298.4 0.115 162.9 187.2 0.417 r2 0.844 0.856 0.205 0.116 0.196 r2 Adjusted 0.780 0.797 -0.124 -0.251 -0.137 Root mean square error 4.986 0.098 3.683 3.949 0.186 Mean of response 19.50 0.547 41.8 23.32 88.18 Observations 18 18 18 18 18
- 9. Drying Miang Leaves using Far Infrared Vacuum drying 469 at 65o C for 120 min. A second order polynomial model was used to determine the optimal conditions for FIR vacuum drying. Using optimal drying conditions, experimental values for aw, MC, and the EGCG content of Miang tea (0.28, 5.97% and 8.12 mg/g dry basis) matched well with estimated values, indicating the usefulness of the optimized conditions. Acknowledgments I would like to thank Chiang Mai University and Thai government to support this research project. Disclosure The authors declare no conflict of interest. References 1. Preechapanya P. Indigenous ecological knowledge about the sustainability of tea gardens in the hill evergreen forest of northern Thailand. PhD thesis, University of Wales, Cardiff, UK (1996) 2. Phromrukachat S, Tiengburanatum N, Neechui J. Assessment of active ingredients in pickled tea. Asian J. Food Ag-Ind. 3: 312-318 (2010) 3. Hirun S, Roach PD. An improved solvent extraction method for the analysis of catechins and caffeine in green tea. J. Food Nutr. Res. 50: 160-166 (2011) 4. Kocabiyik H, Tezer D. Drying of carrot slices using infrared radiation. Int. J. Food Sci. Tech. 44: 953-959 (2009) 5. Mongpraneet S, Abe T, Tsurusaki T. Far infrared-vacuum and - convection drying of welsh onion. T. ASABE 45: 1529-1535 (2002) 6. Léonard A, Blacher S, Nimmol C, Devahastin S. Effect of far- infrared radiation assisted drying on microstructure of banana slices: An illustrative use of X-ray microtomography in microstructural evaluation of a food product. J. Food Eng. 85: 154-162 (2008) 7. Wanyo P, Siriamornpun S, Meeso N. Improvement of quality and antioxidant properties of dried mulberry leaves with combined far- infrared radiation and air convection in Thai tea process. Food Bioprod. Process. 89: 22-30 (2011) 8. Masuda T, Hidaka K, Shinohara A, Maekawa T, Takeda Y, Yamaguchi H. Chemical studies on antioxidant mechanism of curcuminoid: Analysis of radical reaction products from curcumin. J. Agr. Food Chem. 47: 71-77 (1999) 9. Ragazzi E, Veronese G. Quantitative analysis of phenolic compounds after thin-layer chromatographic separation. J. Chromatogr. A 77: 369-375 (1973) 10. Argyropoulos D, Khan MT, Müller J. Effect of air temperature and pre-treatment on color changes and texture of dried Boletus edulis mushroom. Dry. Technol. 29: 1890-1900 (2011) 11. Li X, Xie C, He Y, Qiu Z, Zhang Y. Characterizing the moisture content of tea with diffuse reflectance spectroscopy using wavelet transform and multivariate analysis. Sensors 12: 9847-9861 (2012) 12. Khokhar S, Magnusdottir SGM. Total phenol, catechin, and caffeine contents of teas commonly consumed in the United Kingdom. J. Agr. Food Chem. 50: 565-570 (2002) 13. Sithisarn P, Gritsanapan W. Variability of antioxidative quercetin content in Siamese neem tree leaves in Thailand by TLC- densitometry. Acta Hortic. 78: 161-168 (2008) 14. Chan EWC, Lim YY, Chew YL. Antioxidant activity of Camellia sinensis leaves and tea from a lowland plantation in Malaysia. Food Chem. 102: 1214-1222 (2007) 15. Park JH, Lee JM, Cho YJ, Kim CT, Kim CJ, Nam KC, Lee SC. Effect of far-infrared heater on the physicochemical characteristics of green tea during processing. J. Food Biochem. 33: 149-162 (2009) 16. Lee S-C, Kim J-H, Jeong S-M, Kim D-R, Ha J-U, Nam KC, Ahn DU. Effect of far-infrared radiation on the antioxidant activity of rice hulls. J. Agr. Food Chem. 51: 4400-4403 (2003) 17. Lin YS, Tsai YJ, Tsay JS, Lin JK. Factors affecting the levels of tea polyphenols and caffeine in tea leaves. J. Agr. Food Chem. 51: 1864-1873 (2003) 18. Lee SC, Jeong SM, Kim SY, Park HR, Nam KC, Ahn DU. Effect of far-infrared radiation and heat treatment on the antioxidant activity of water extracts from peanut hulls. Food Chem. 94: 489-493 (2006) 19. Hirun S, Utama-ang N, Roach PD. Turmeric (Curcuma longa L.) drying: An optimization approach using microwave-vacuum drying. J. Food Sci. Tech. Mys. 51: 2127-2133 (2014)