The document summarizes the results of the 2014 Simon Poll on voter opinions regarding term limits in Illinois. Some key findings include:
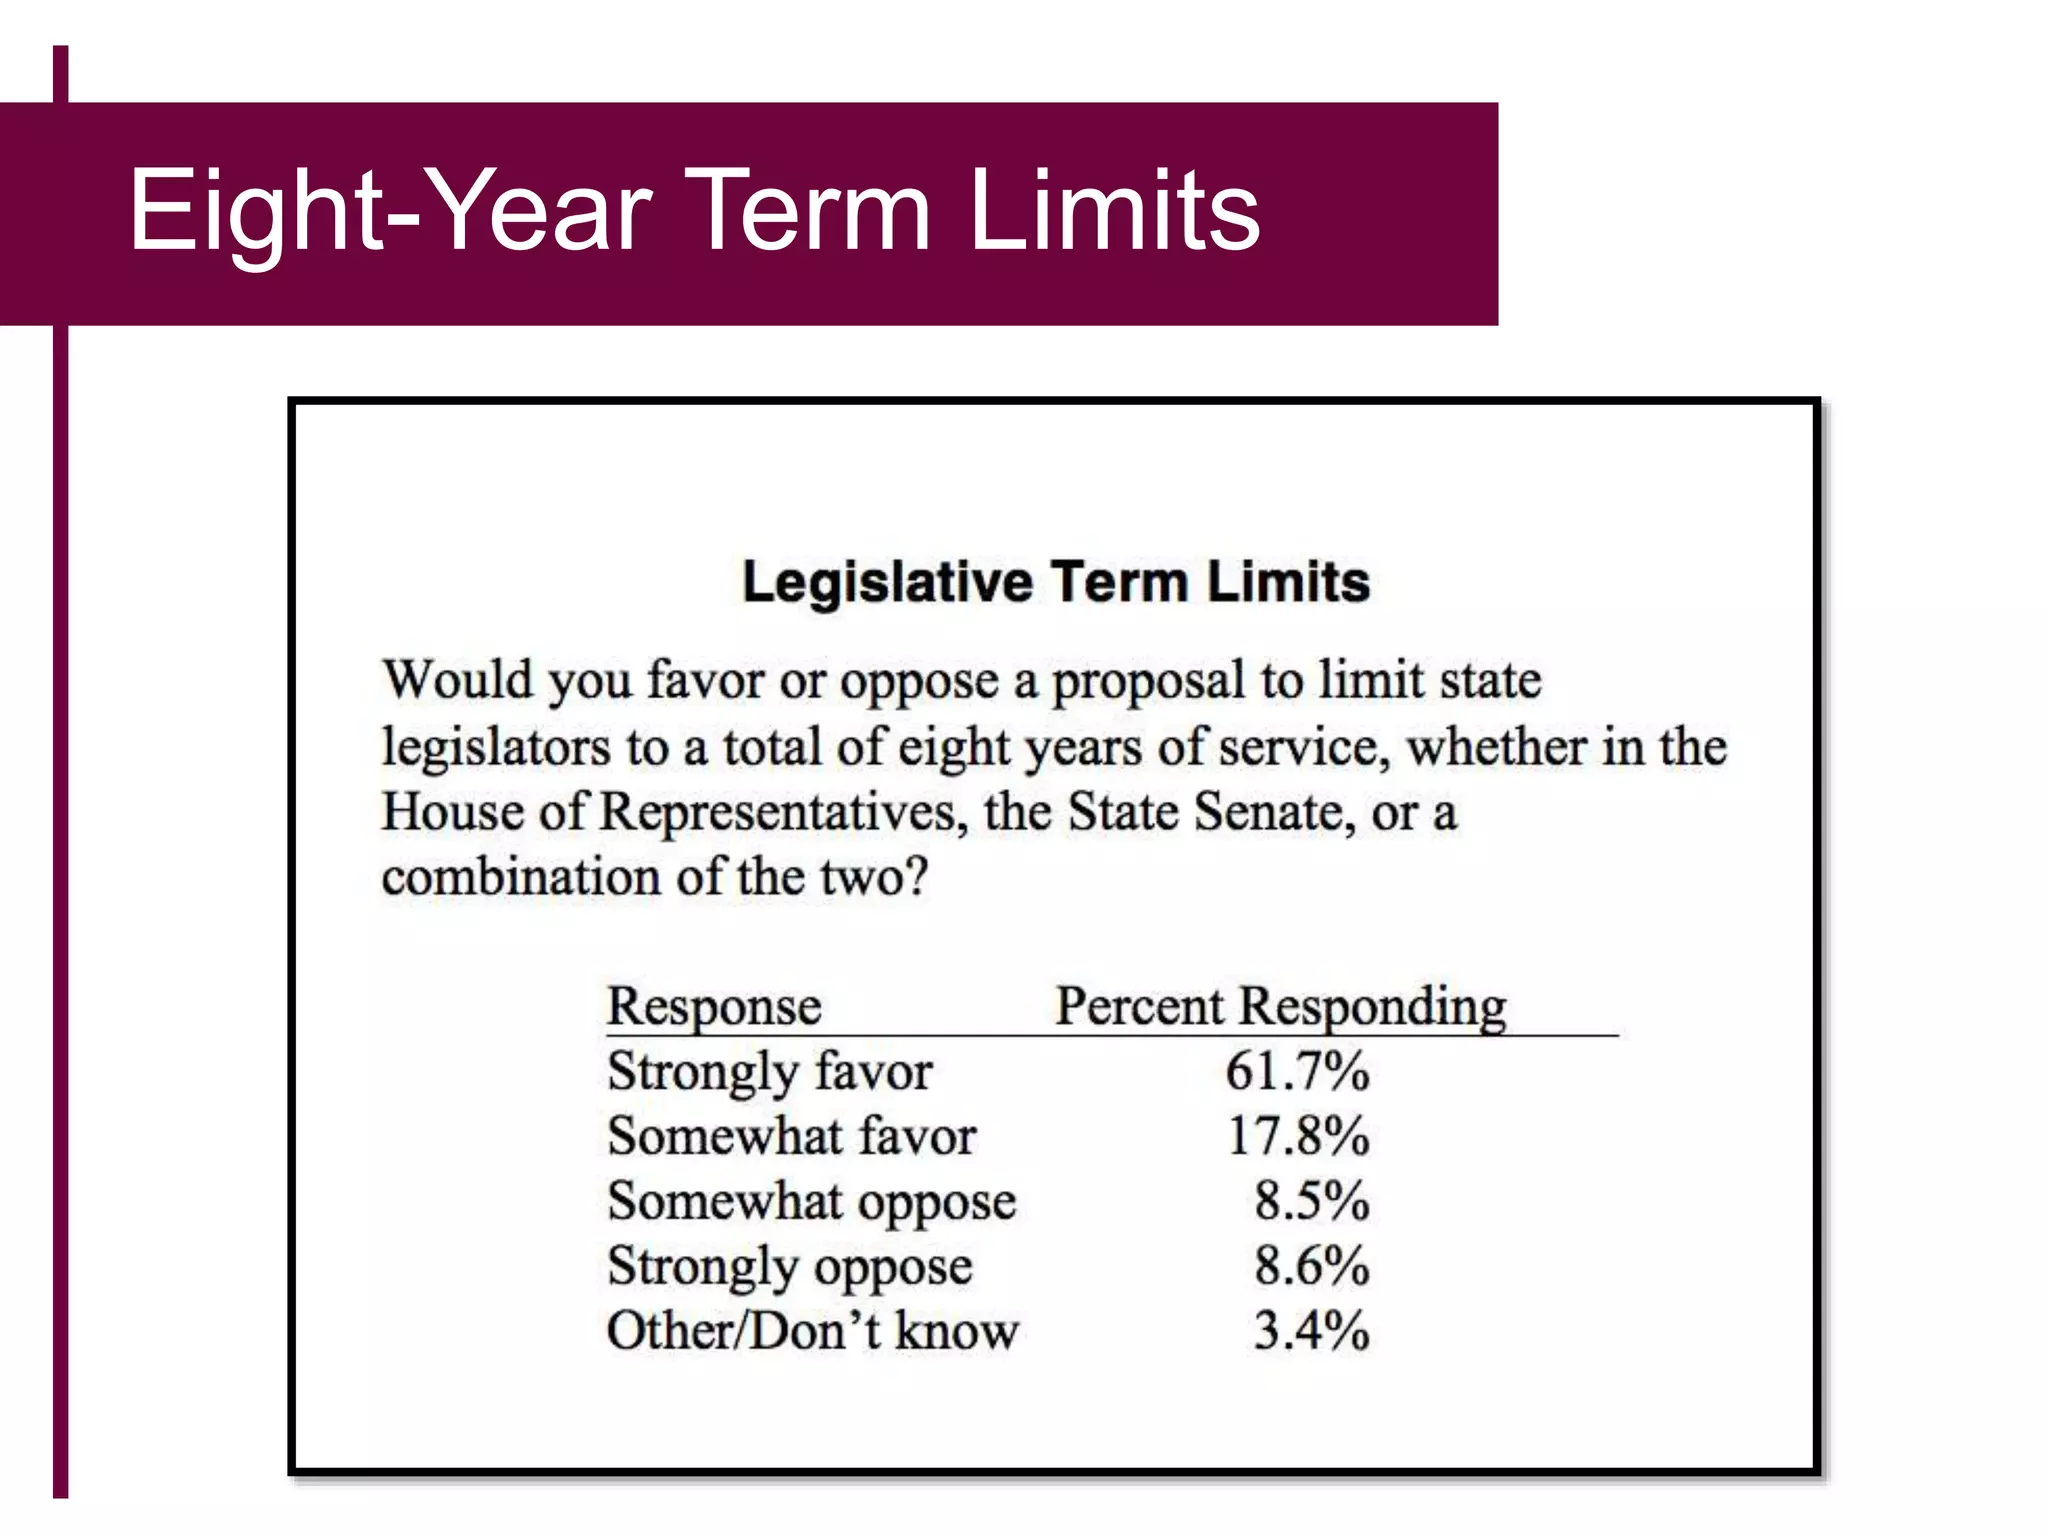
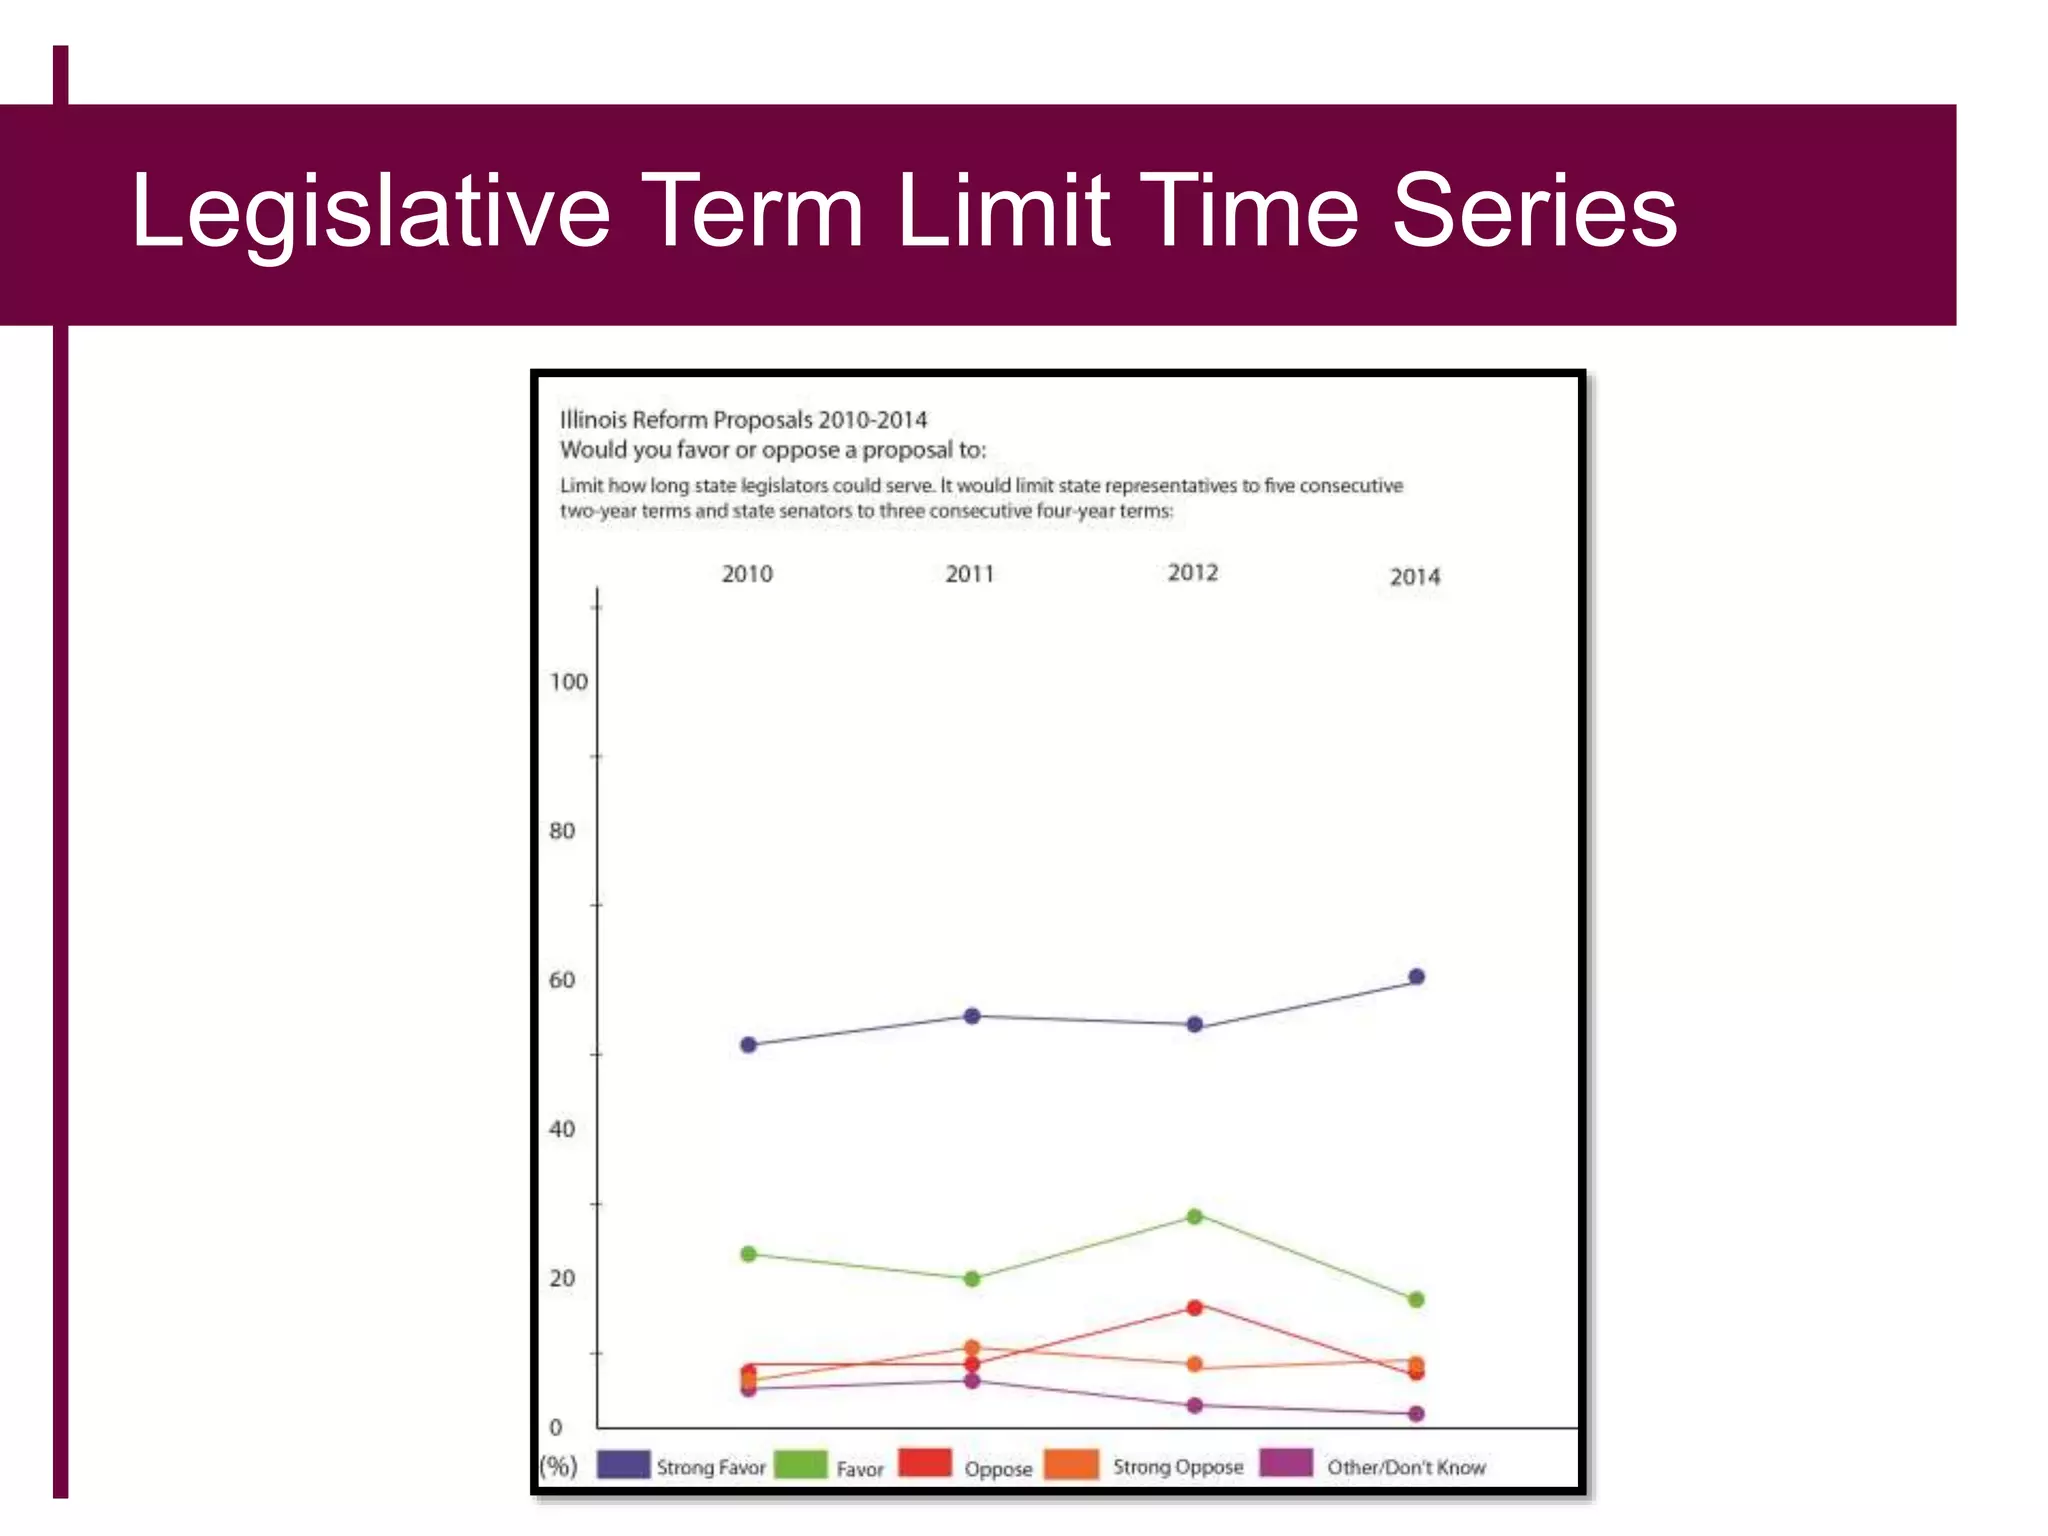
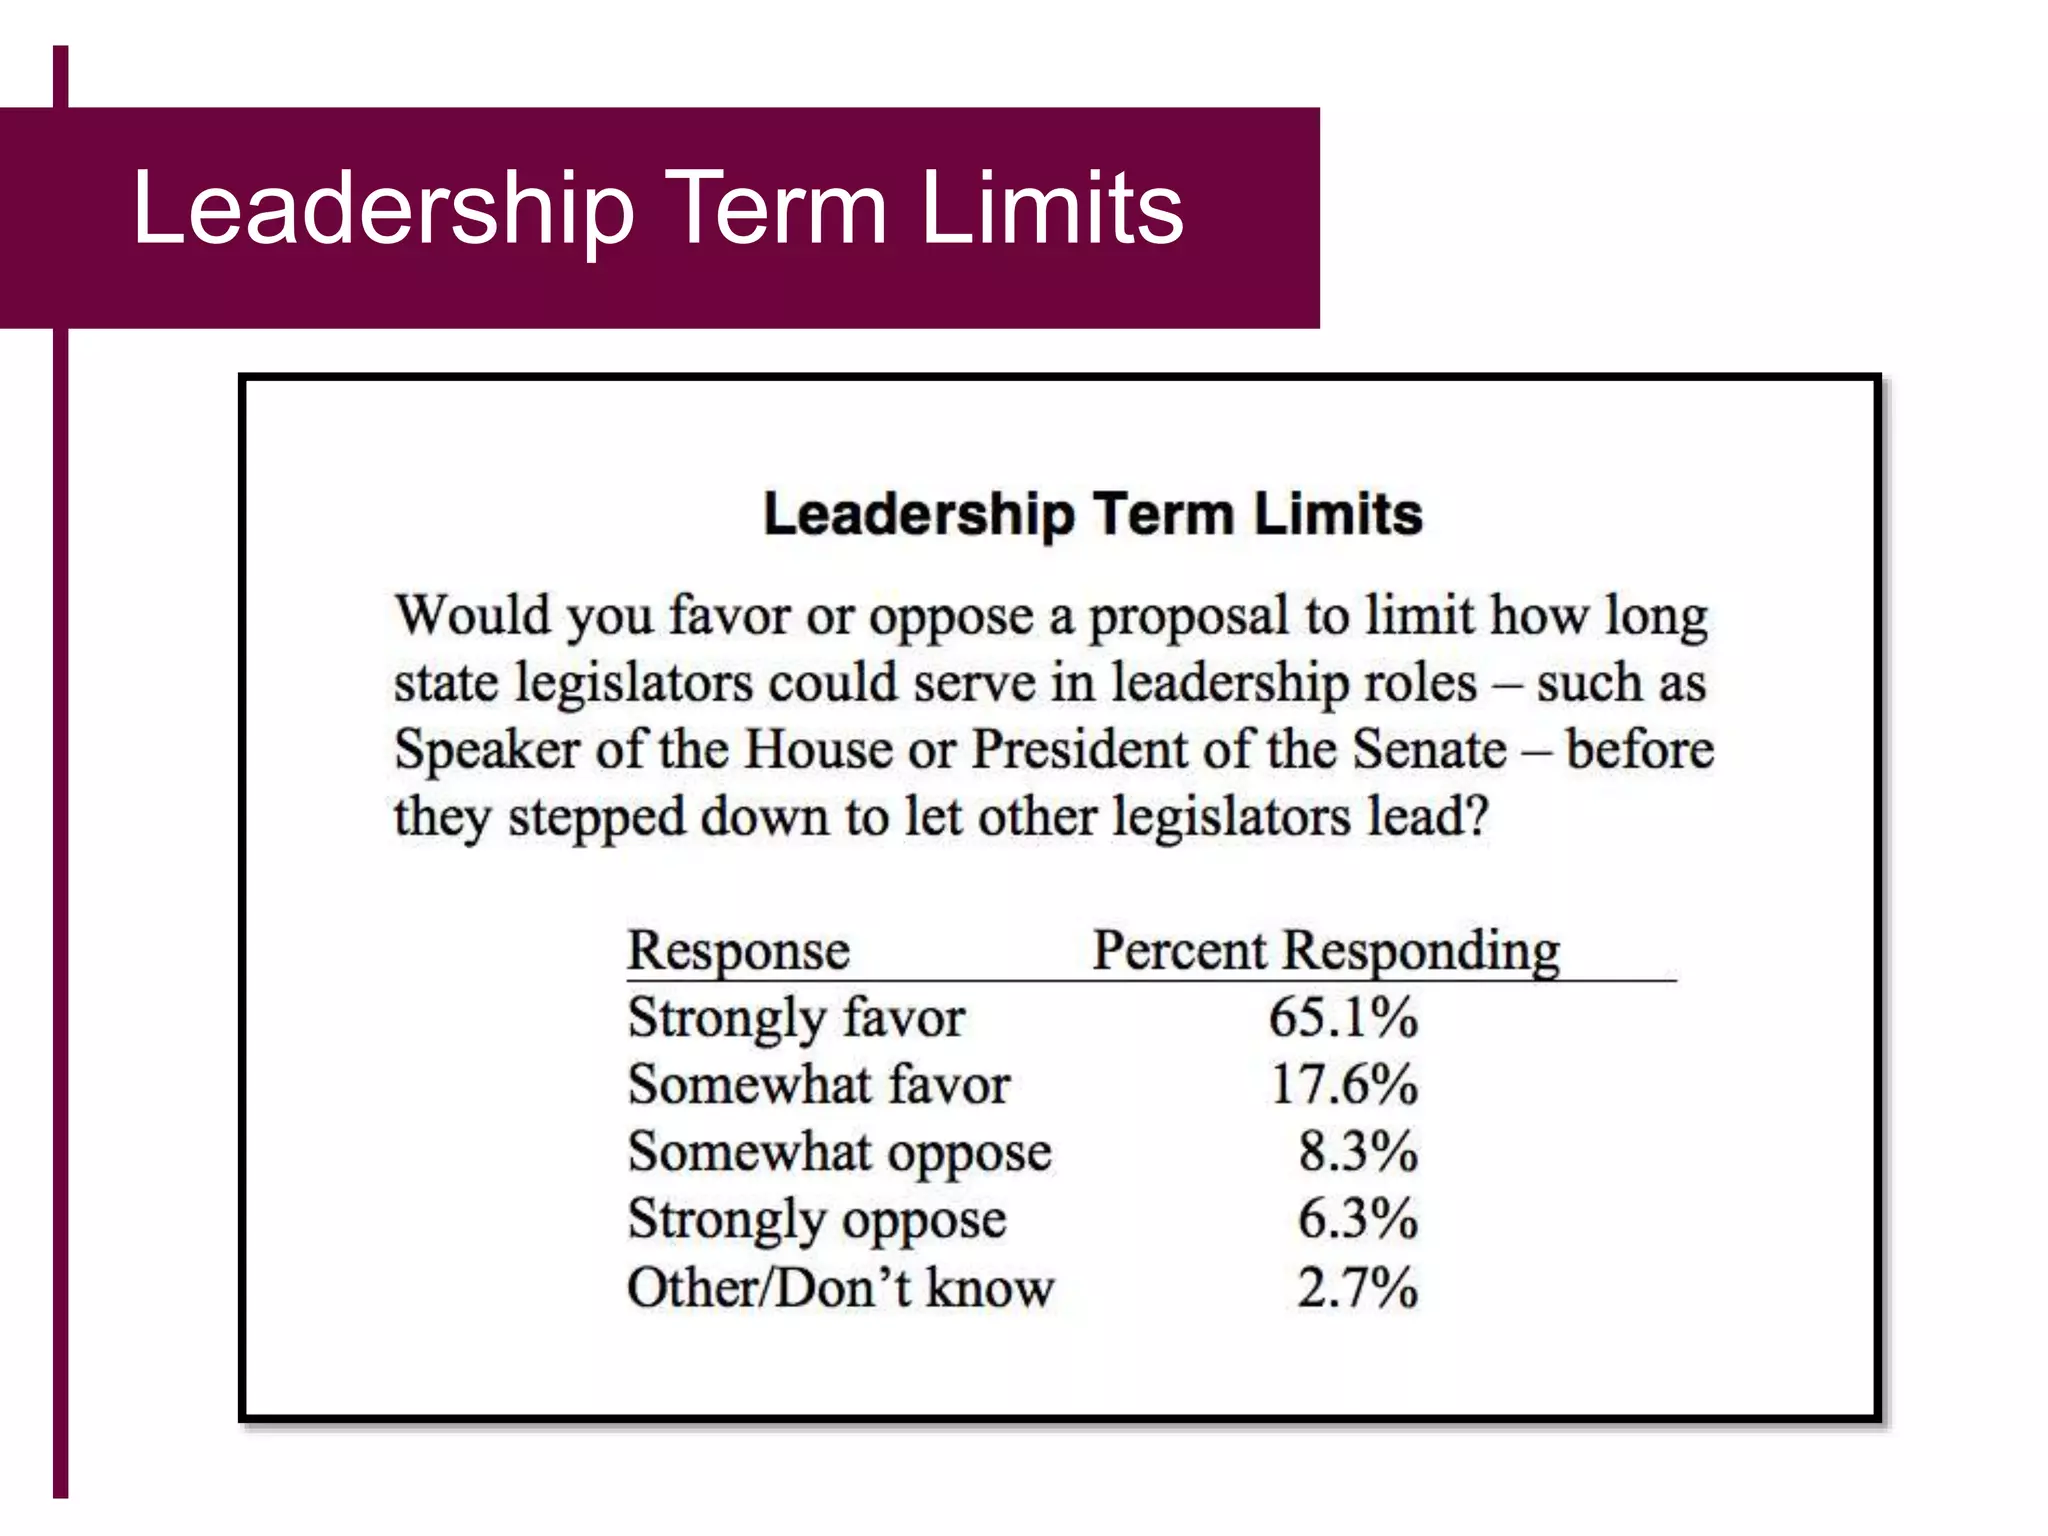
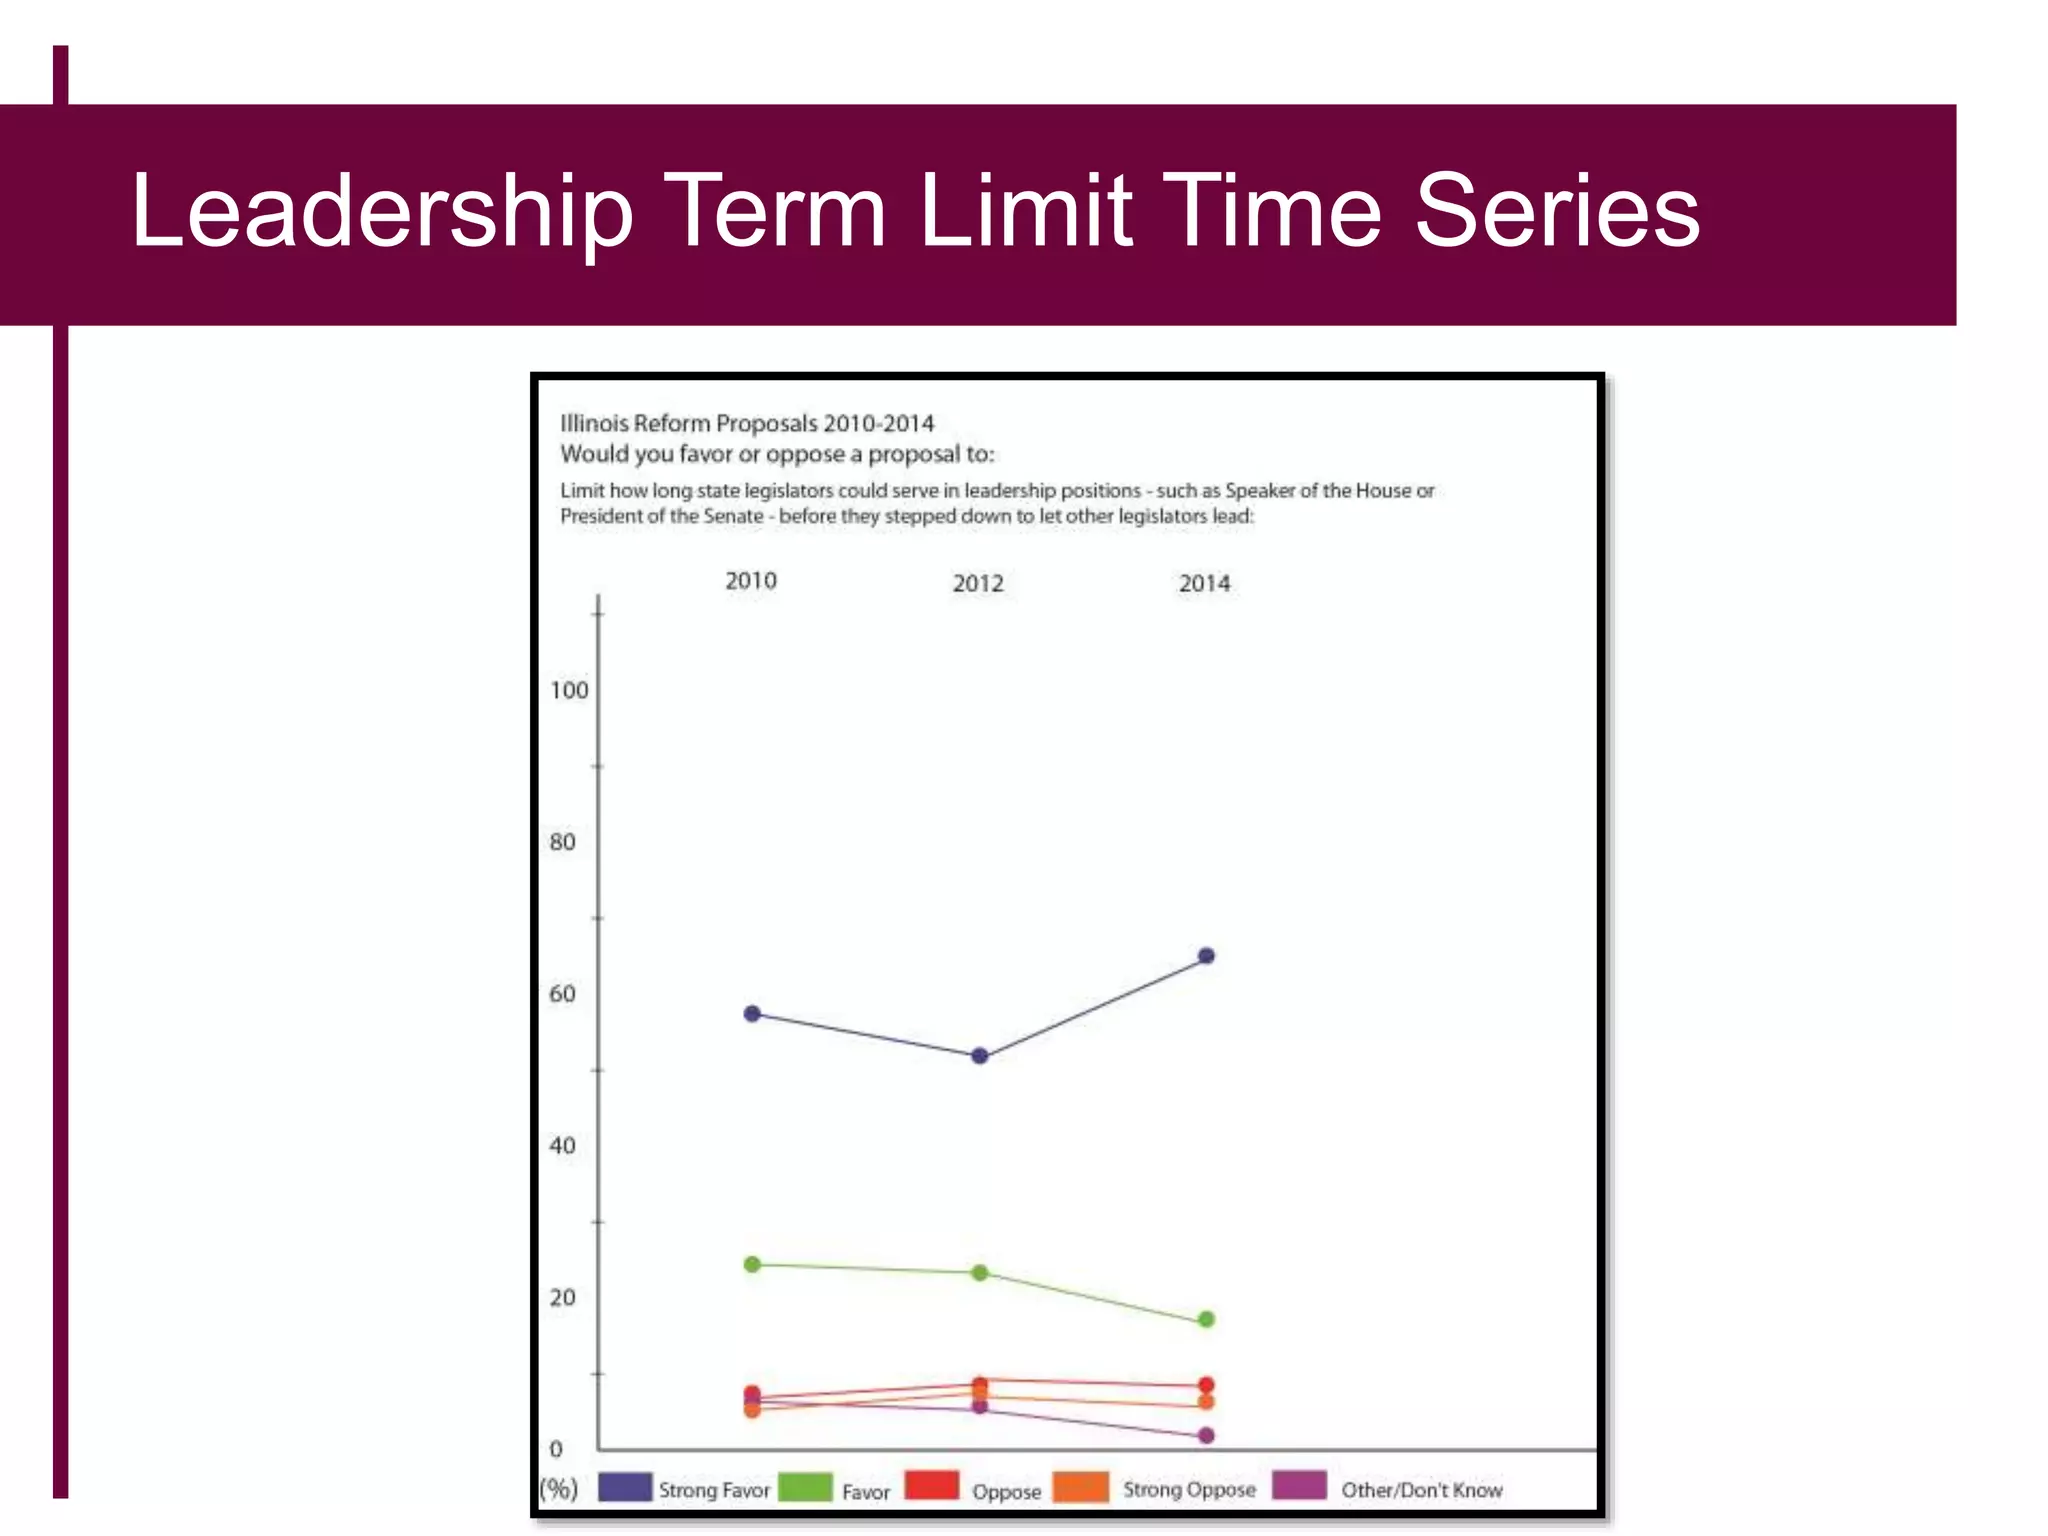
- Over 70% of voters supported implementing 8-year term limits for state legislators and leadership positions, regardless of political affiliation or region.
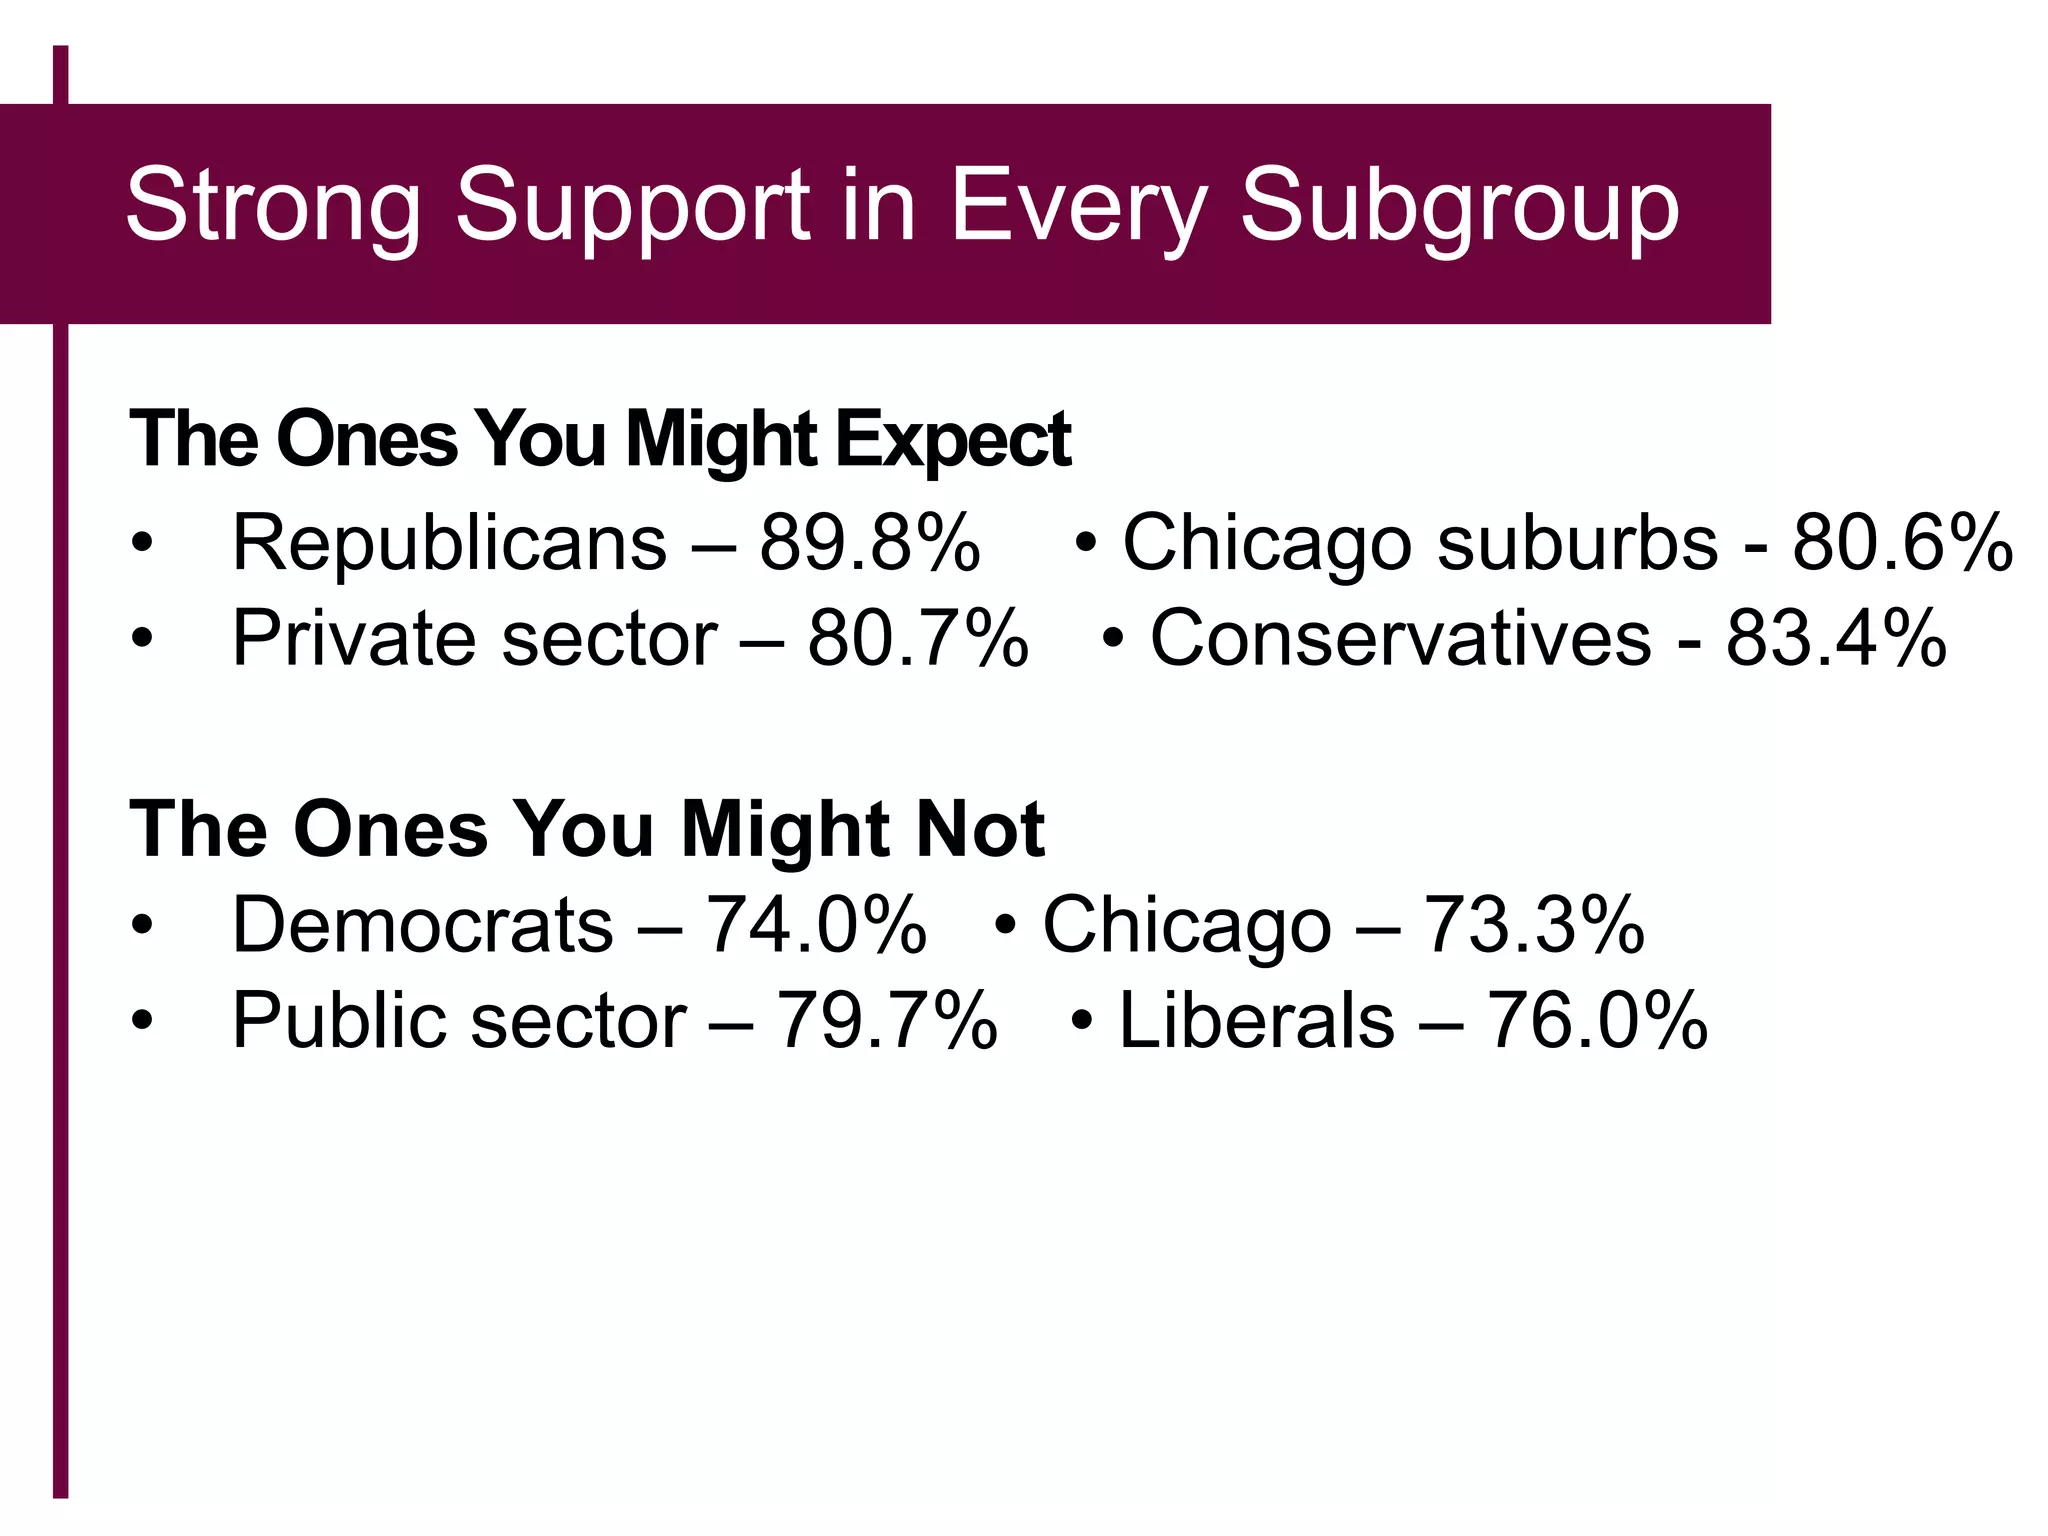
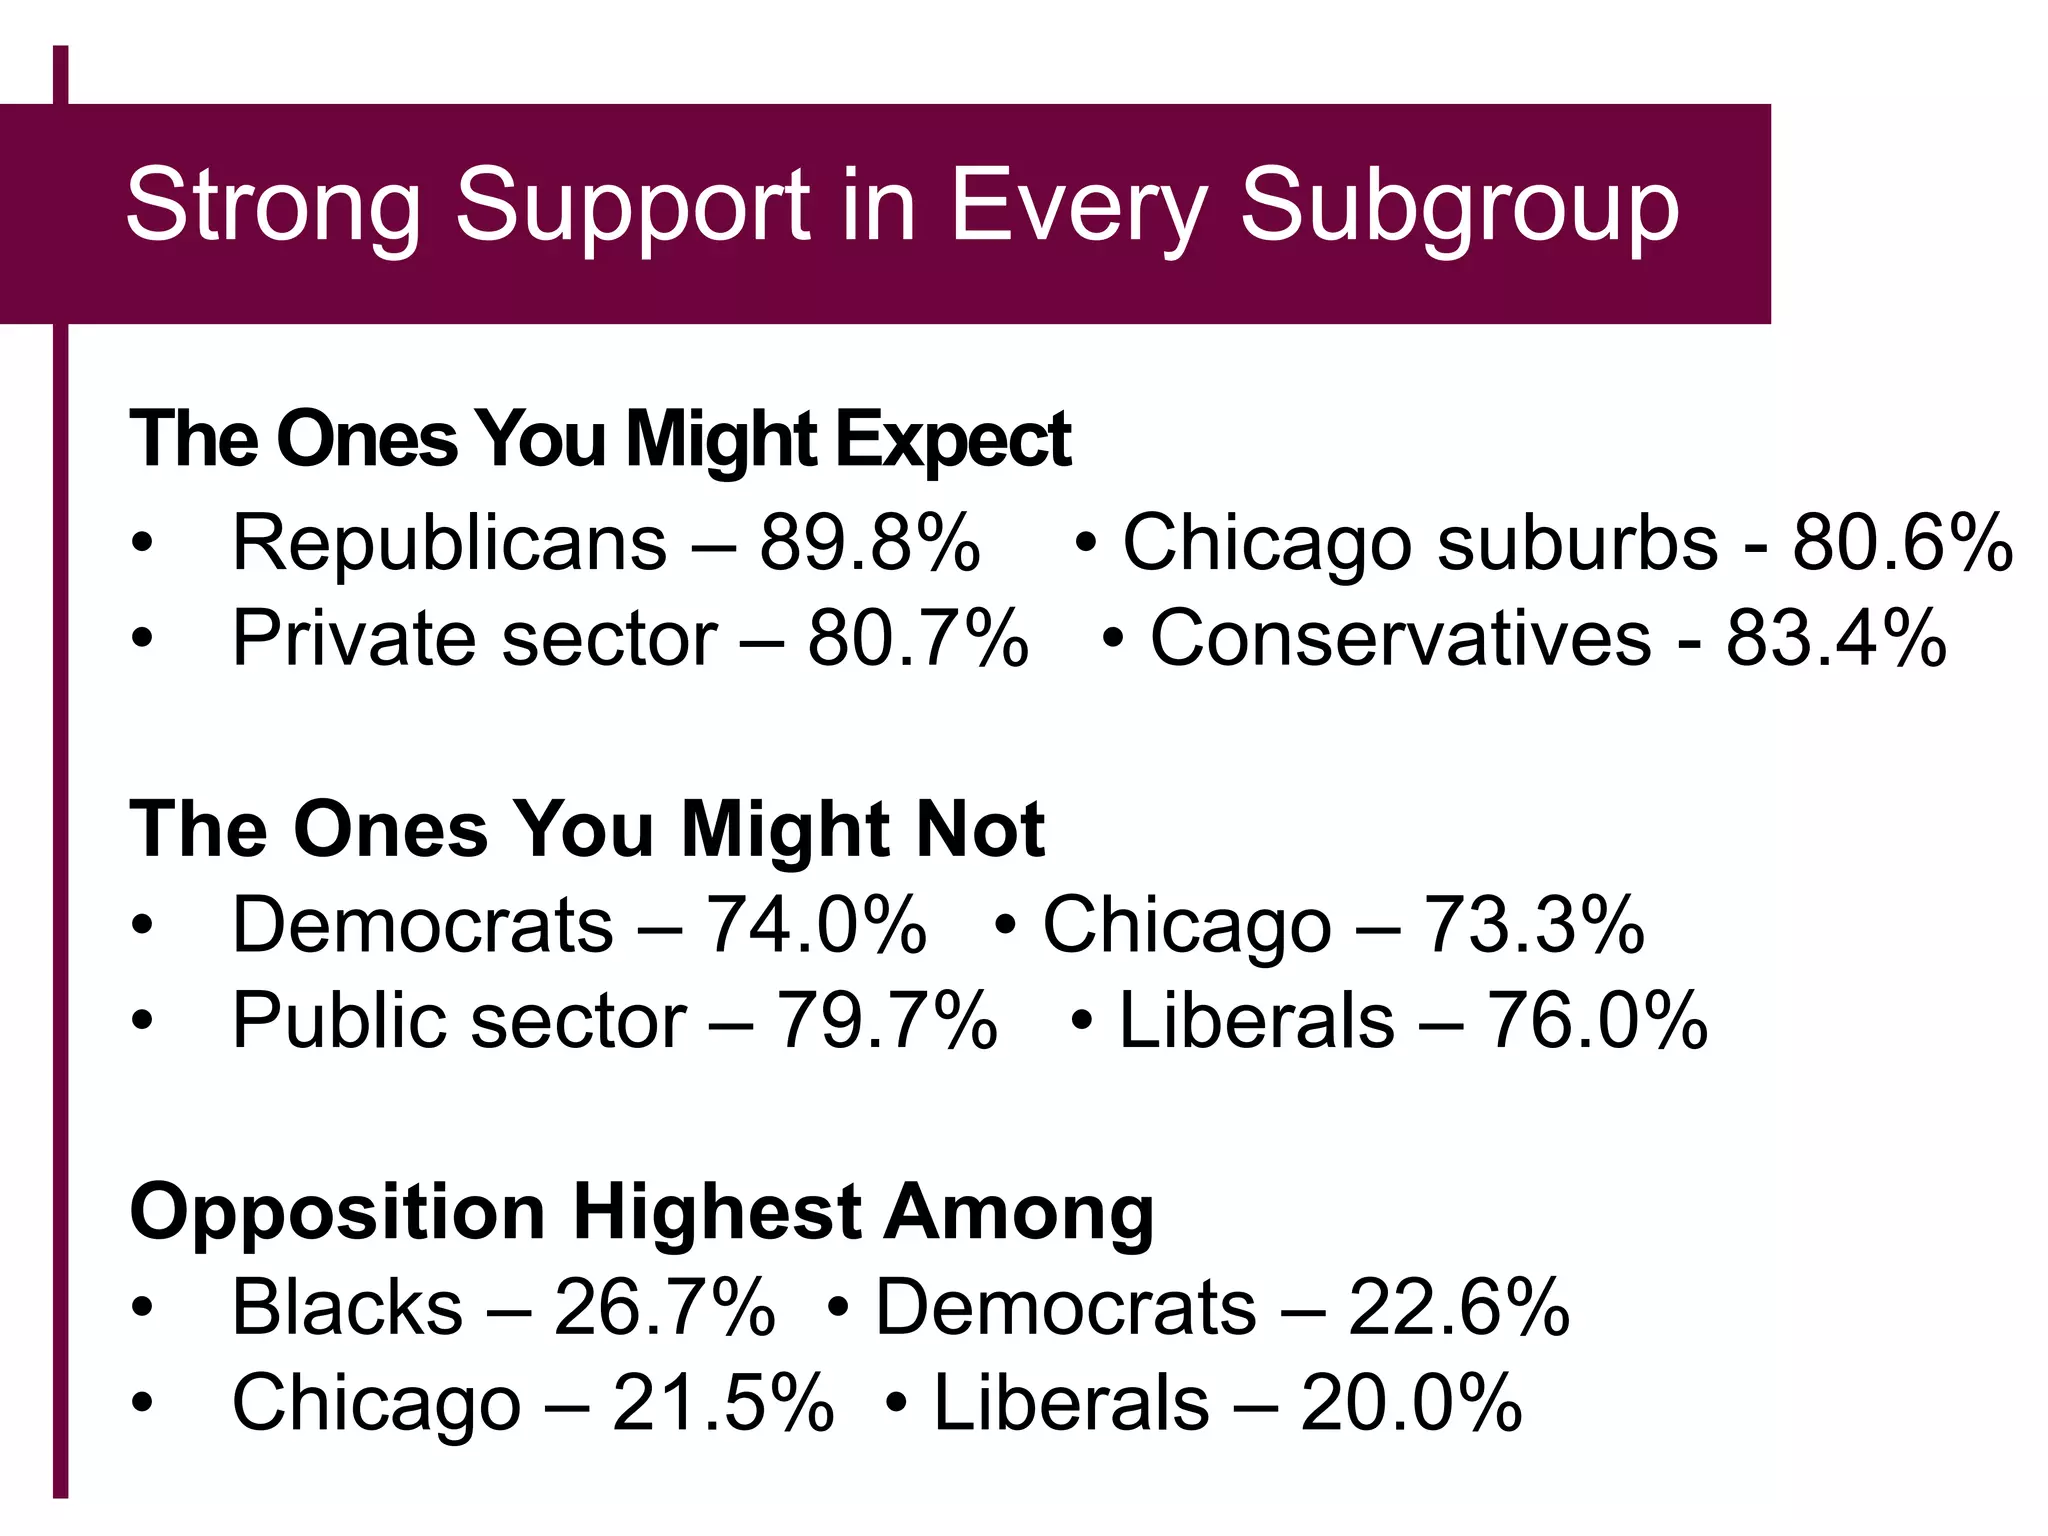
- Support was consistently high across different voter subgroups, including Democrats, Chicago residents, and those in the public sector.
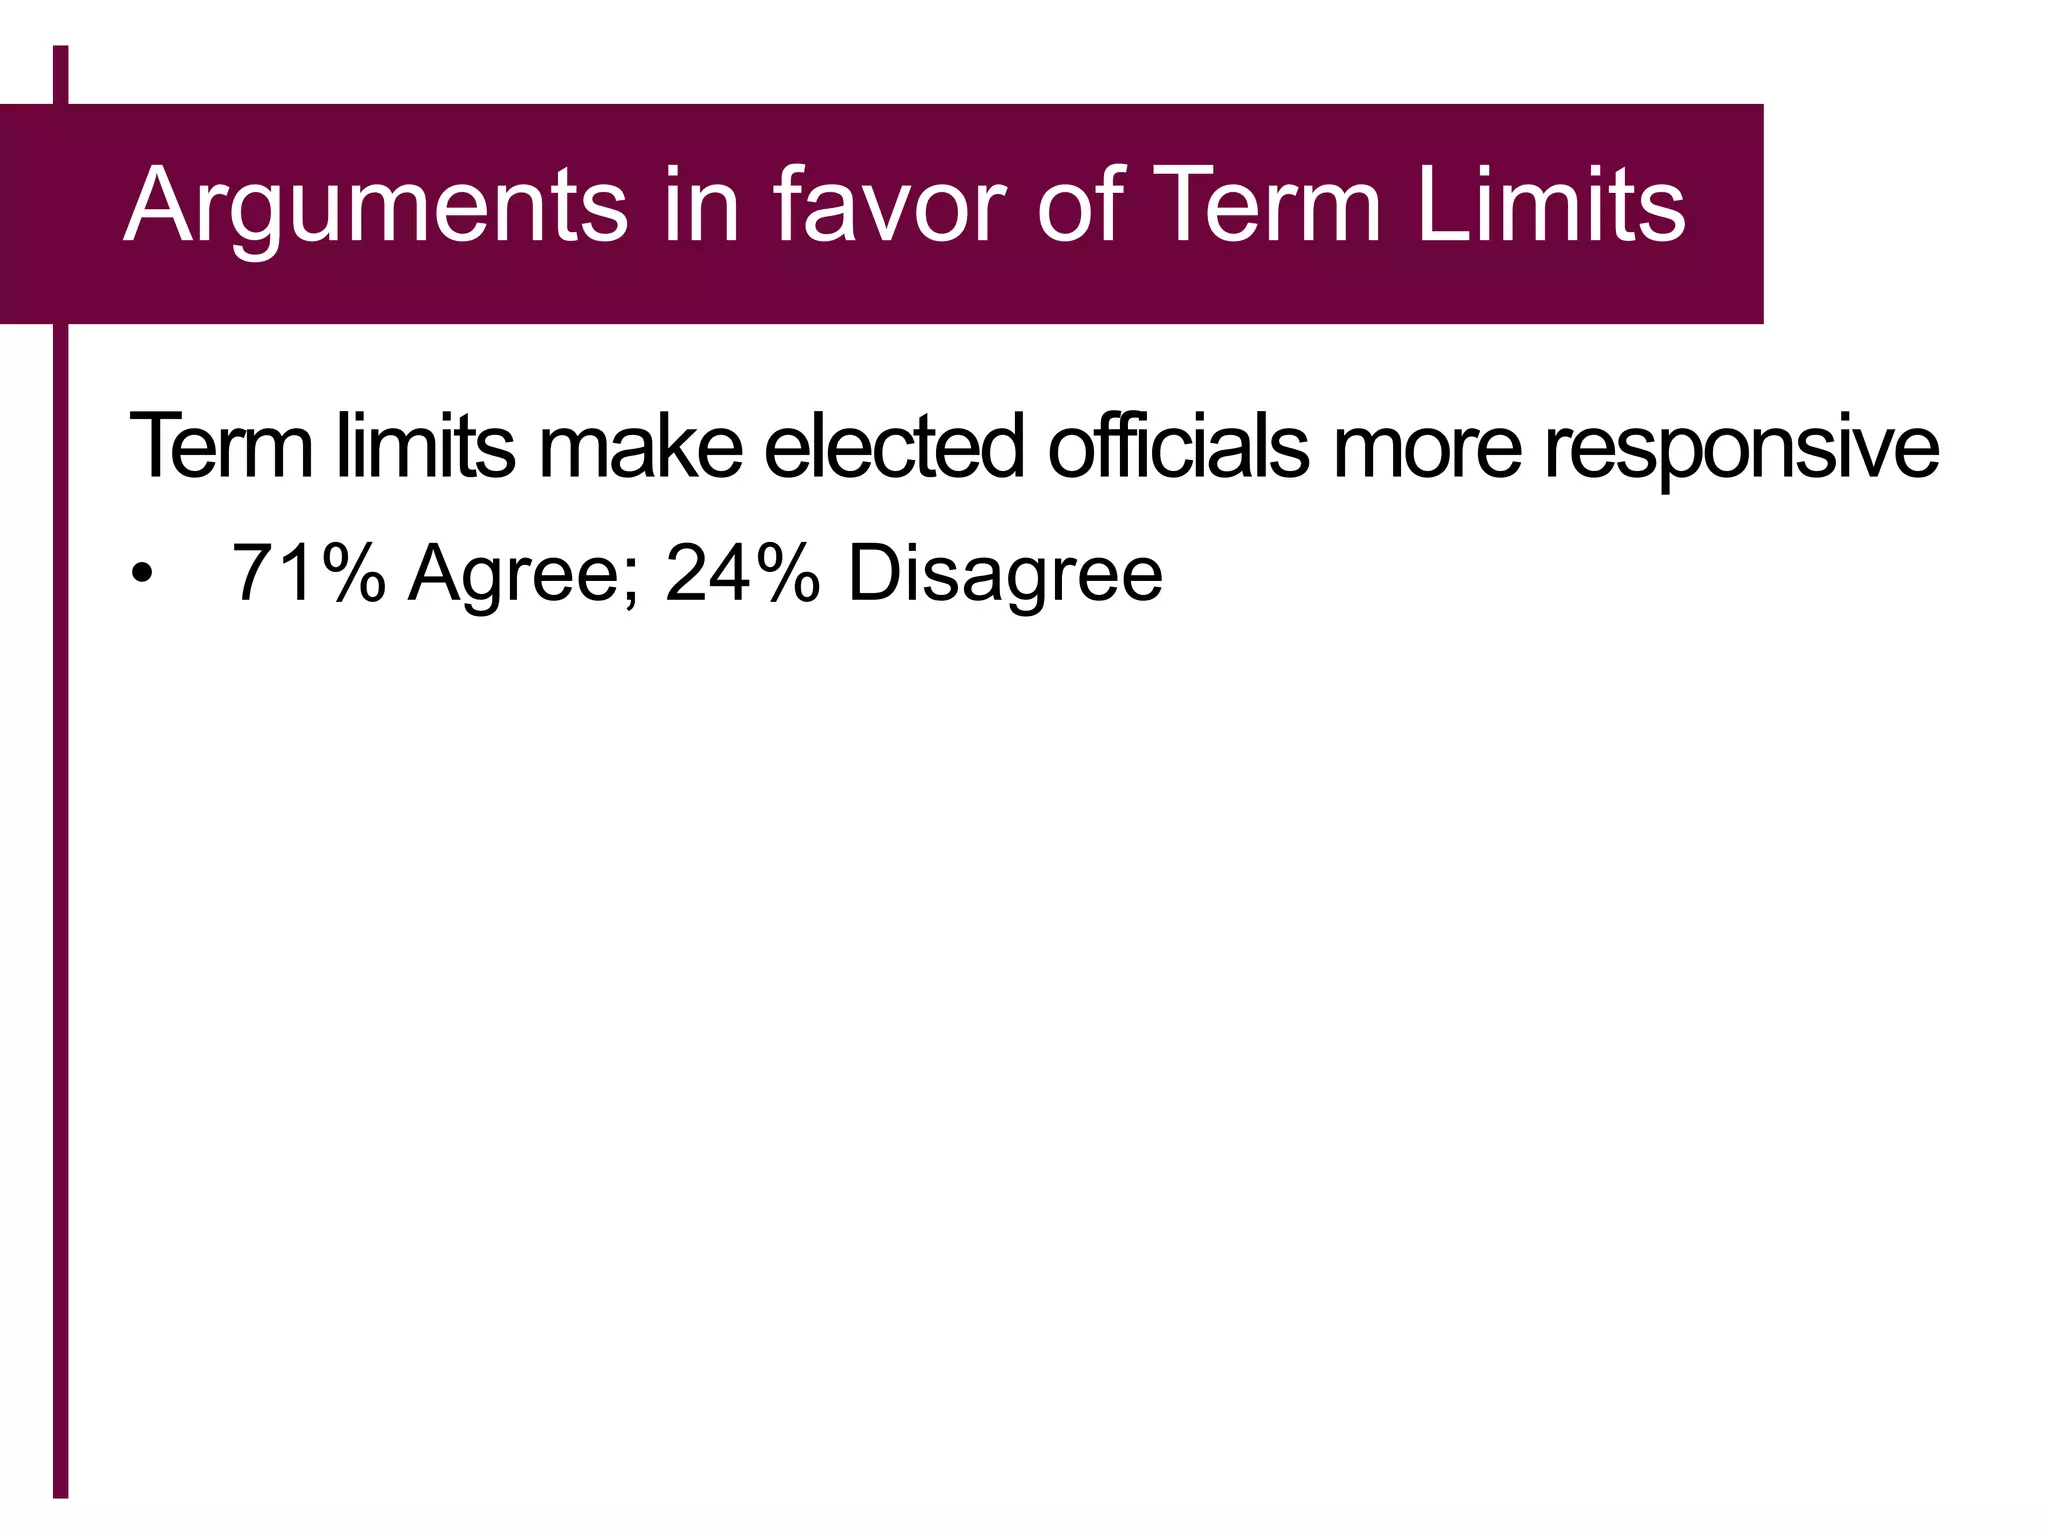
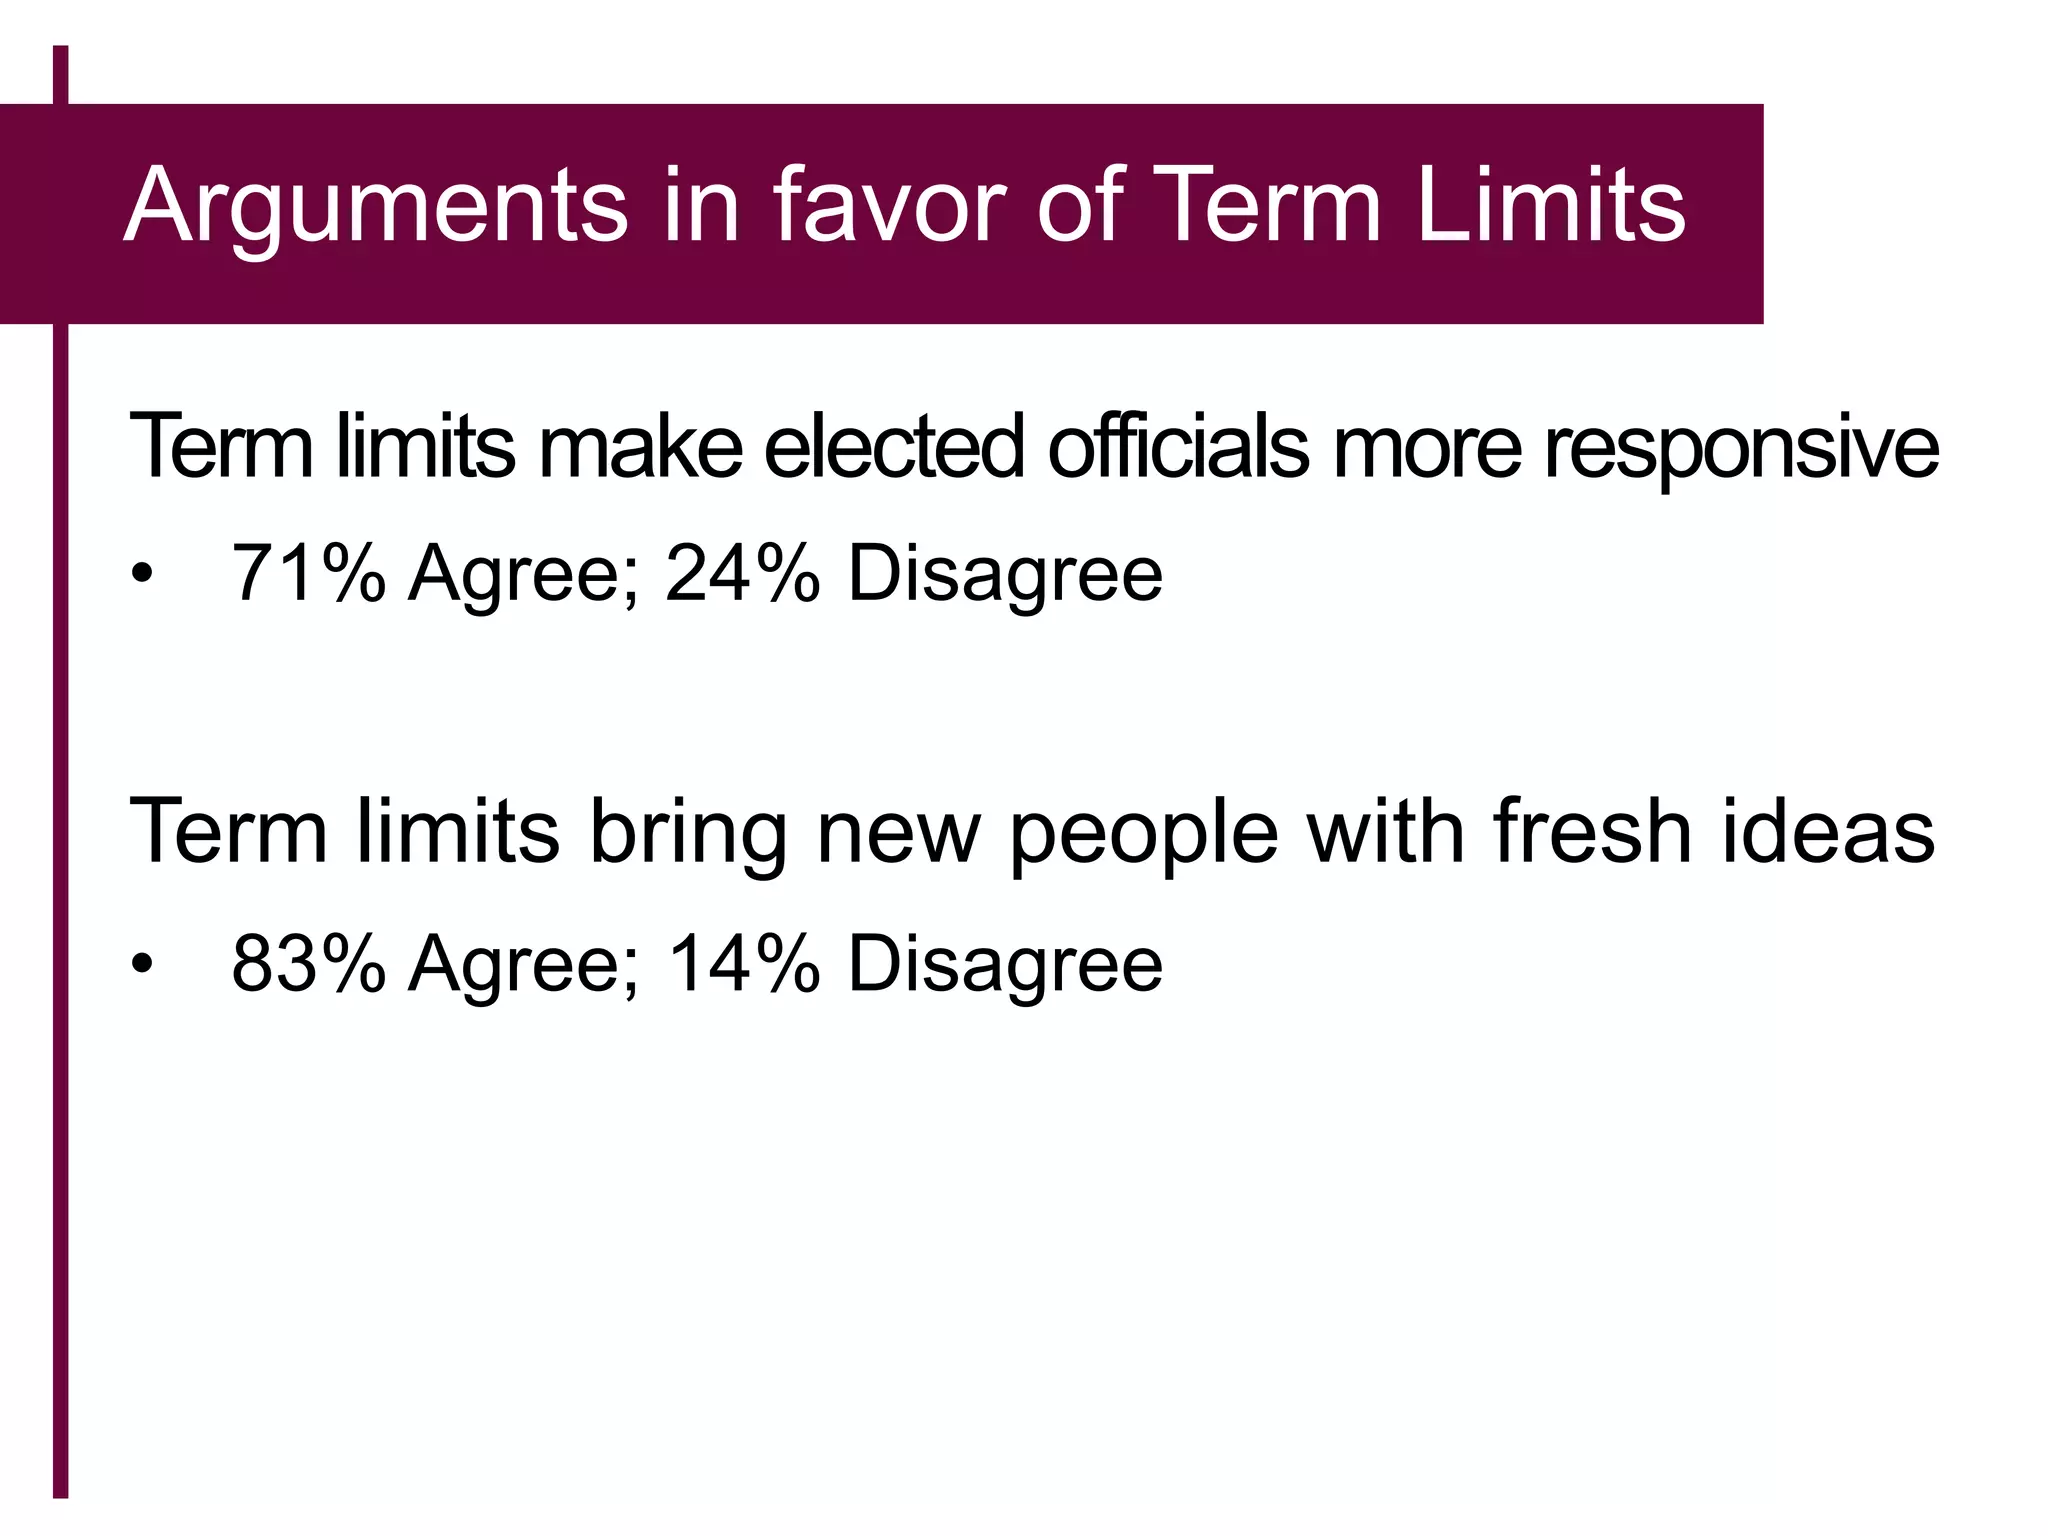
- The main arguments cited in favor of term limits were that it would make elected officials more responsive and bring in new people with fresh ideas, which over 70% and 80% of voters agreed with, respectively.