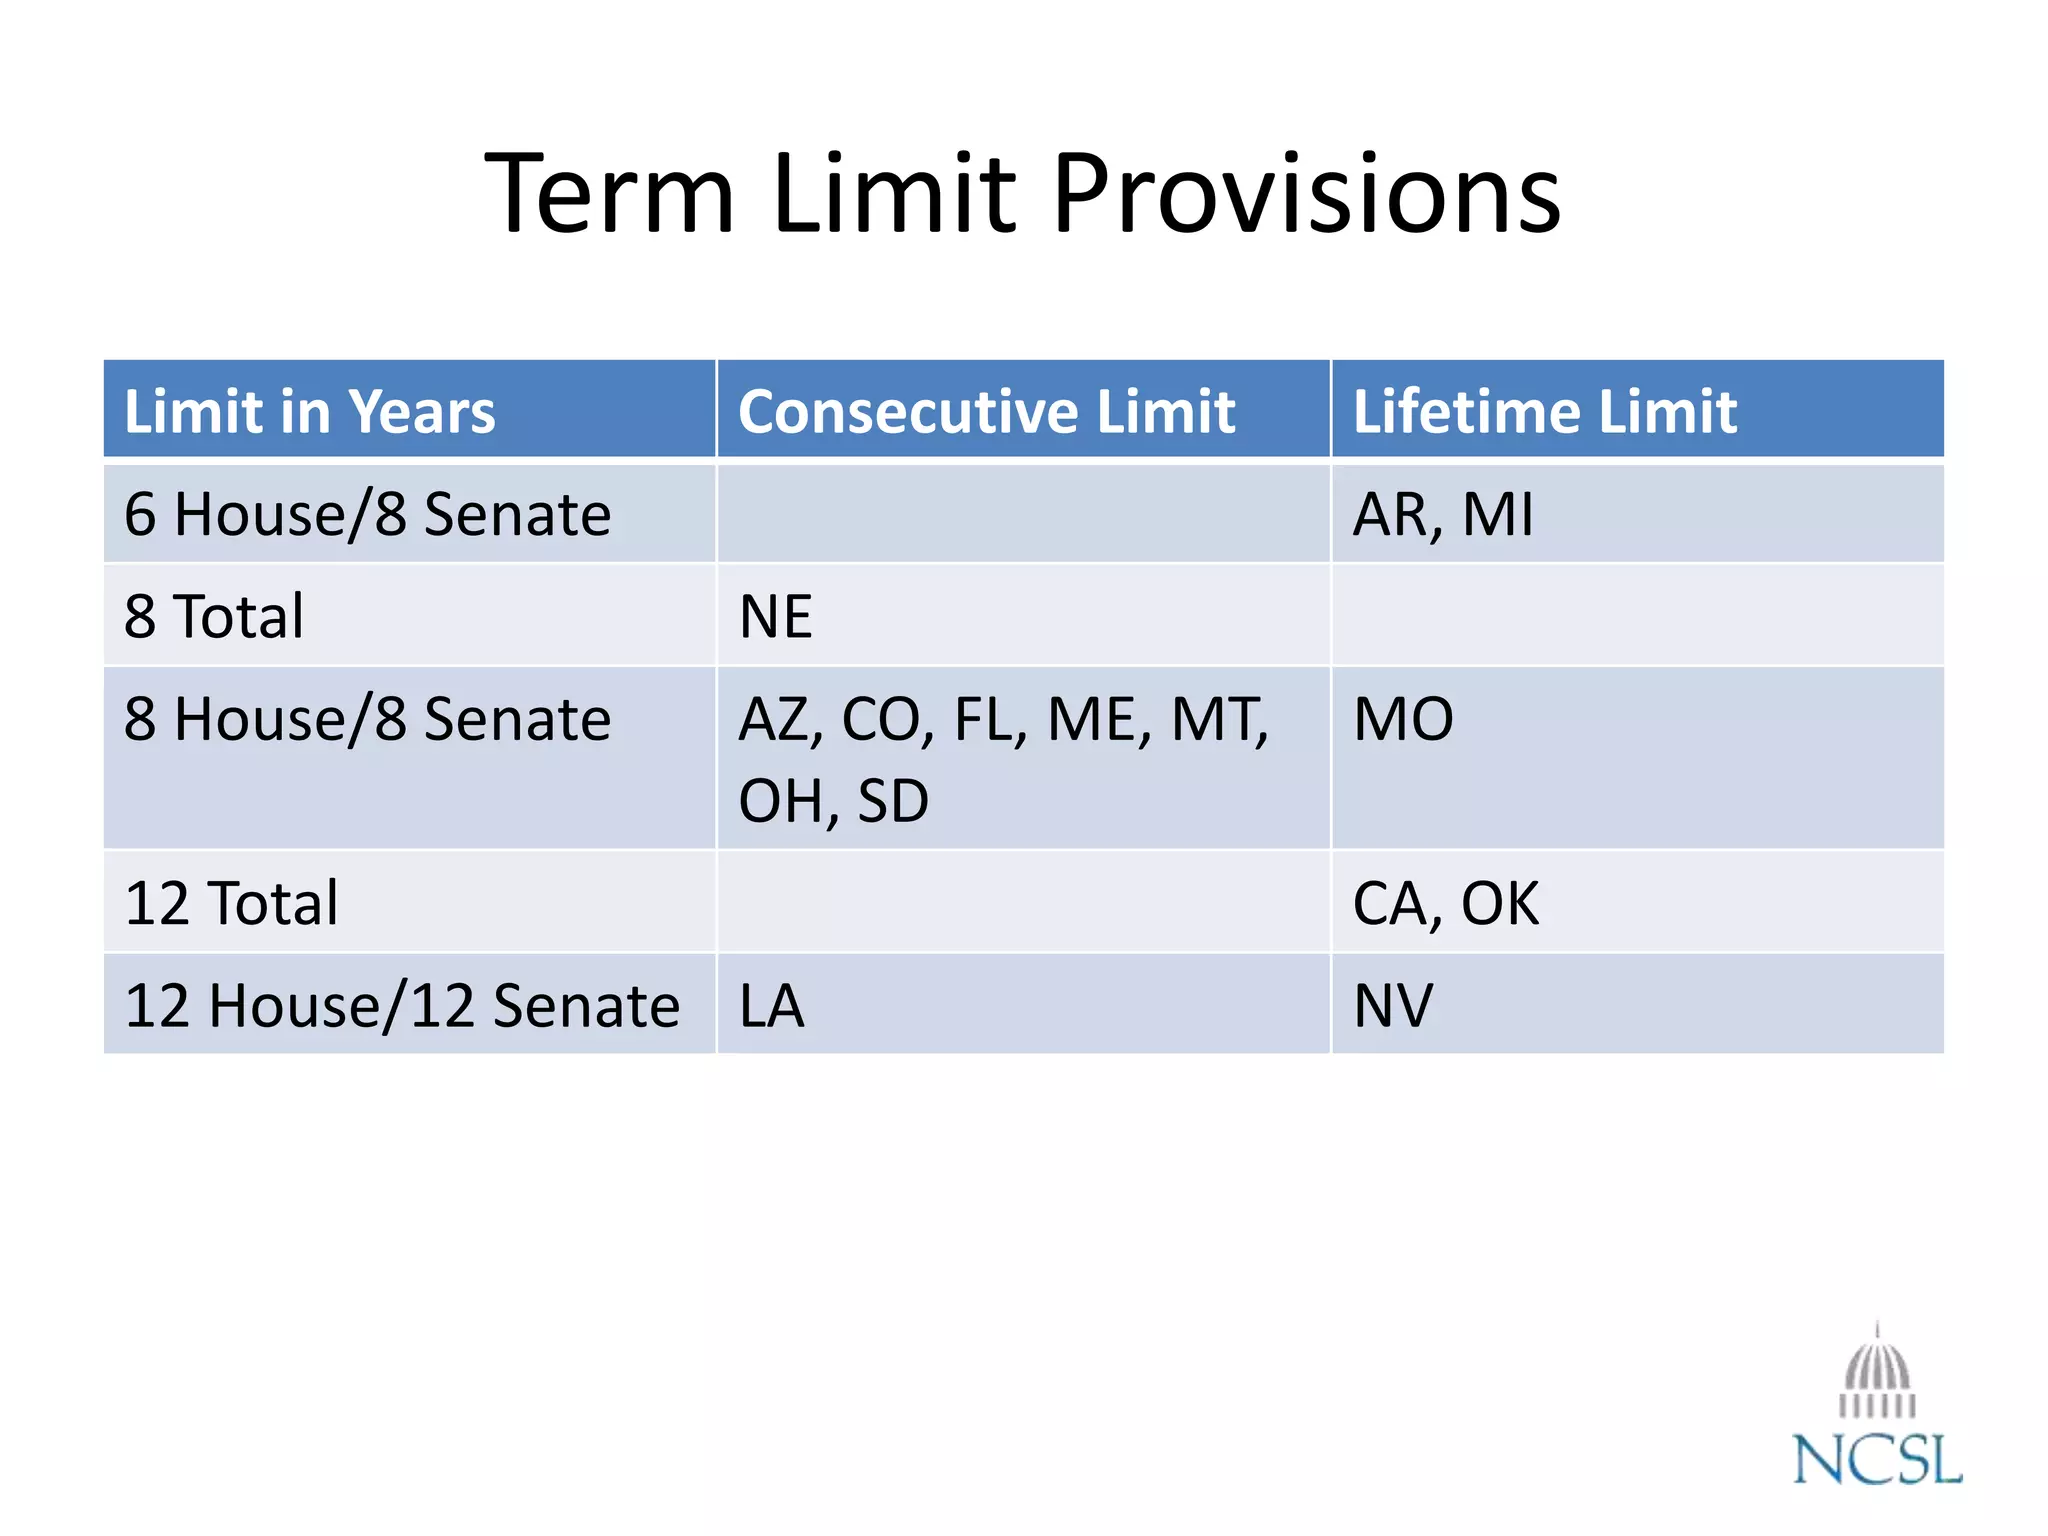
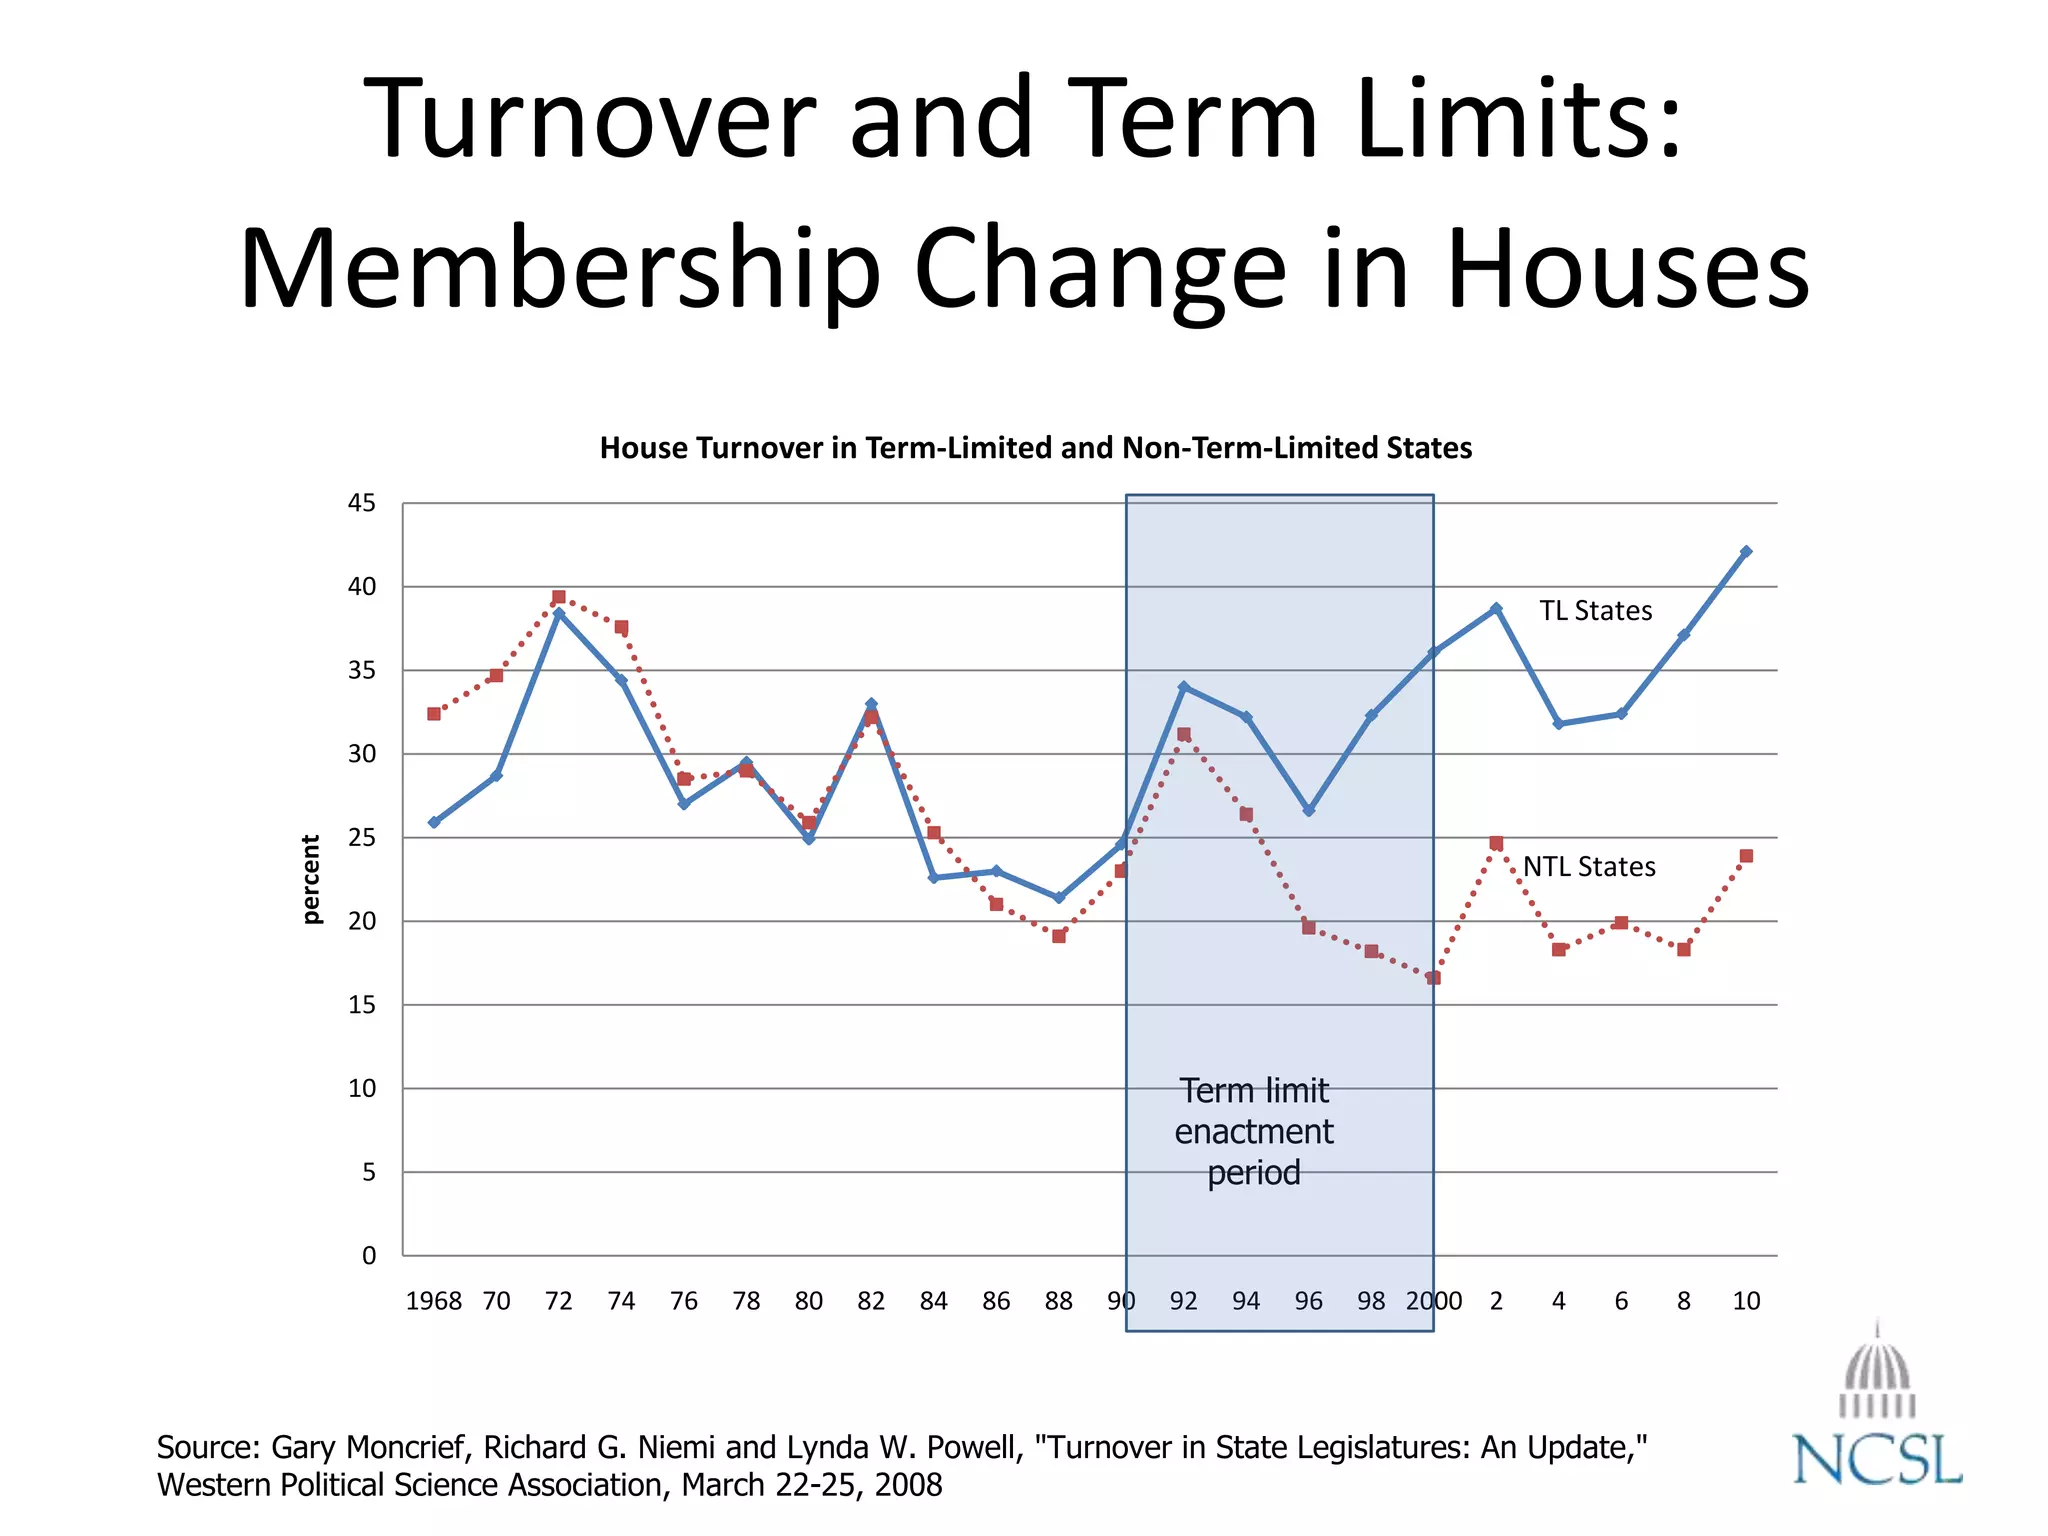
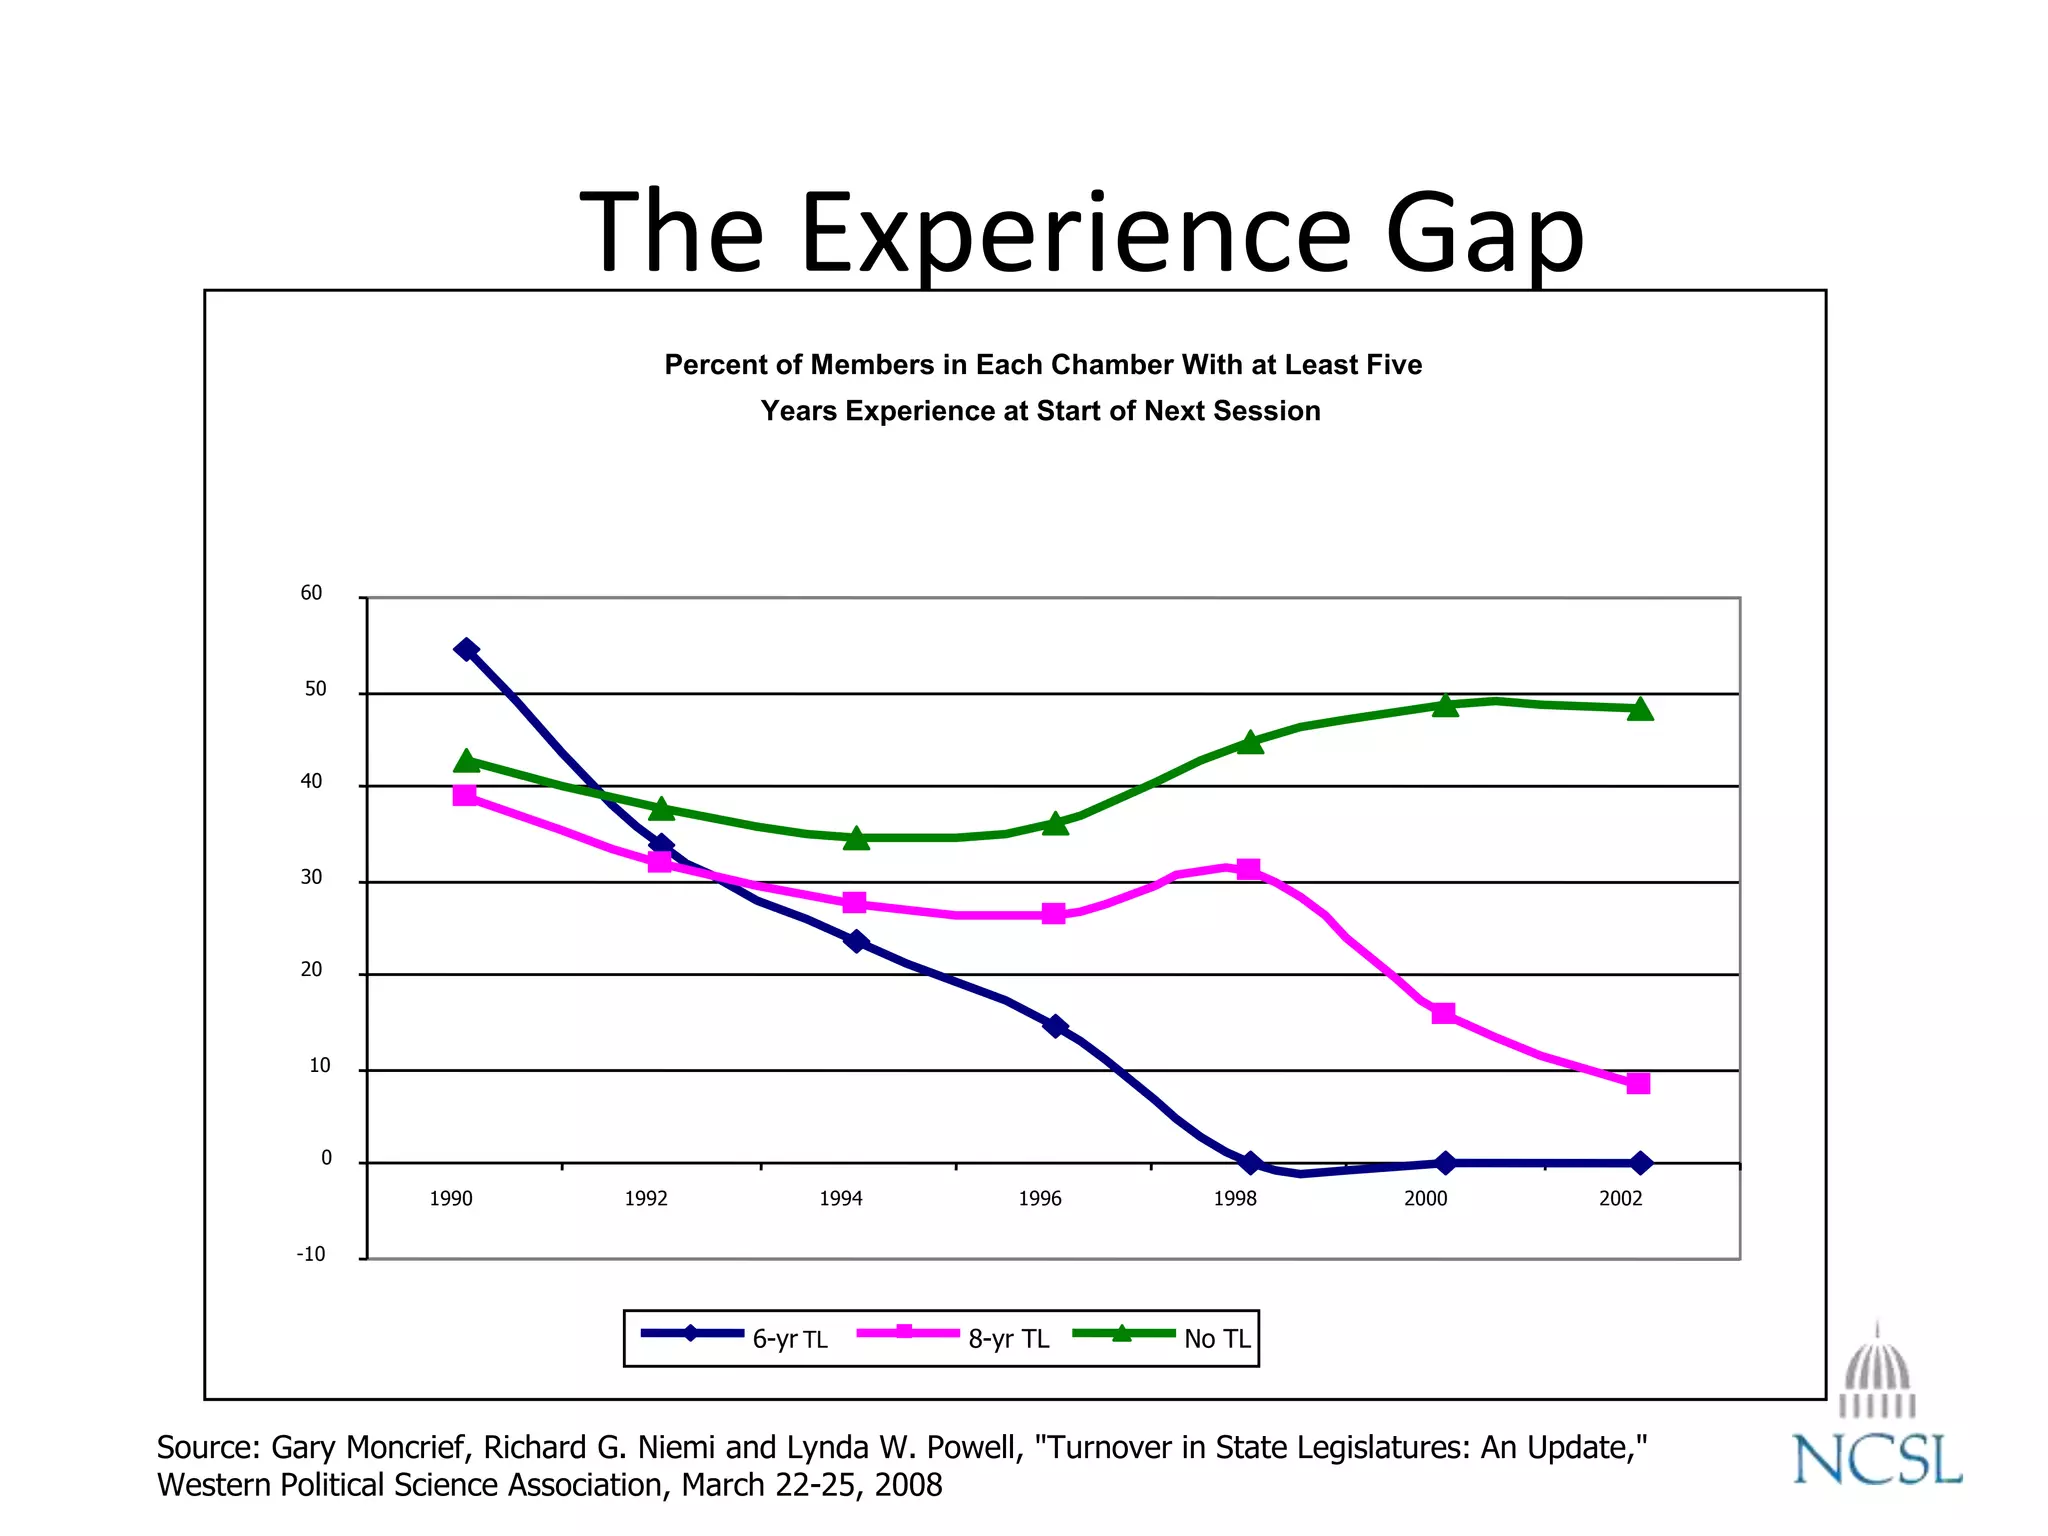
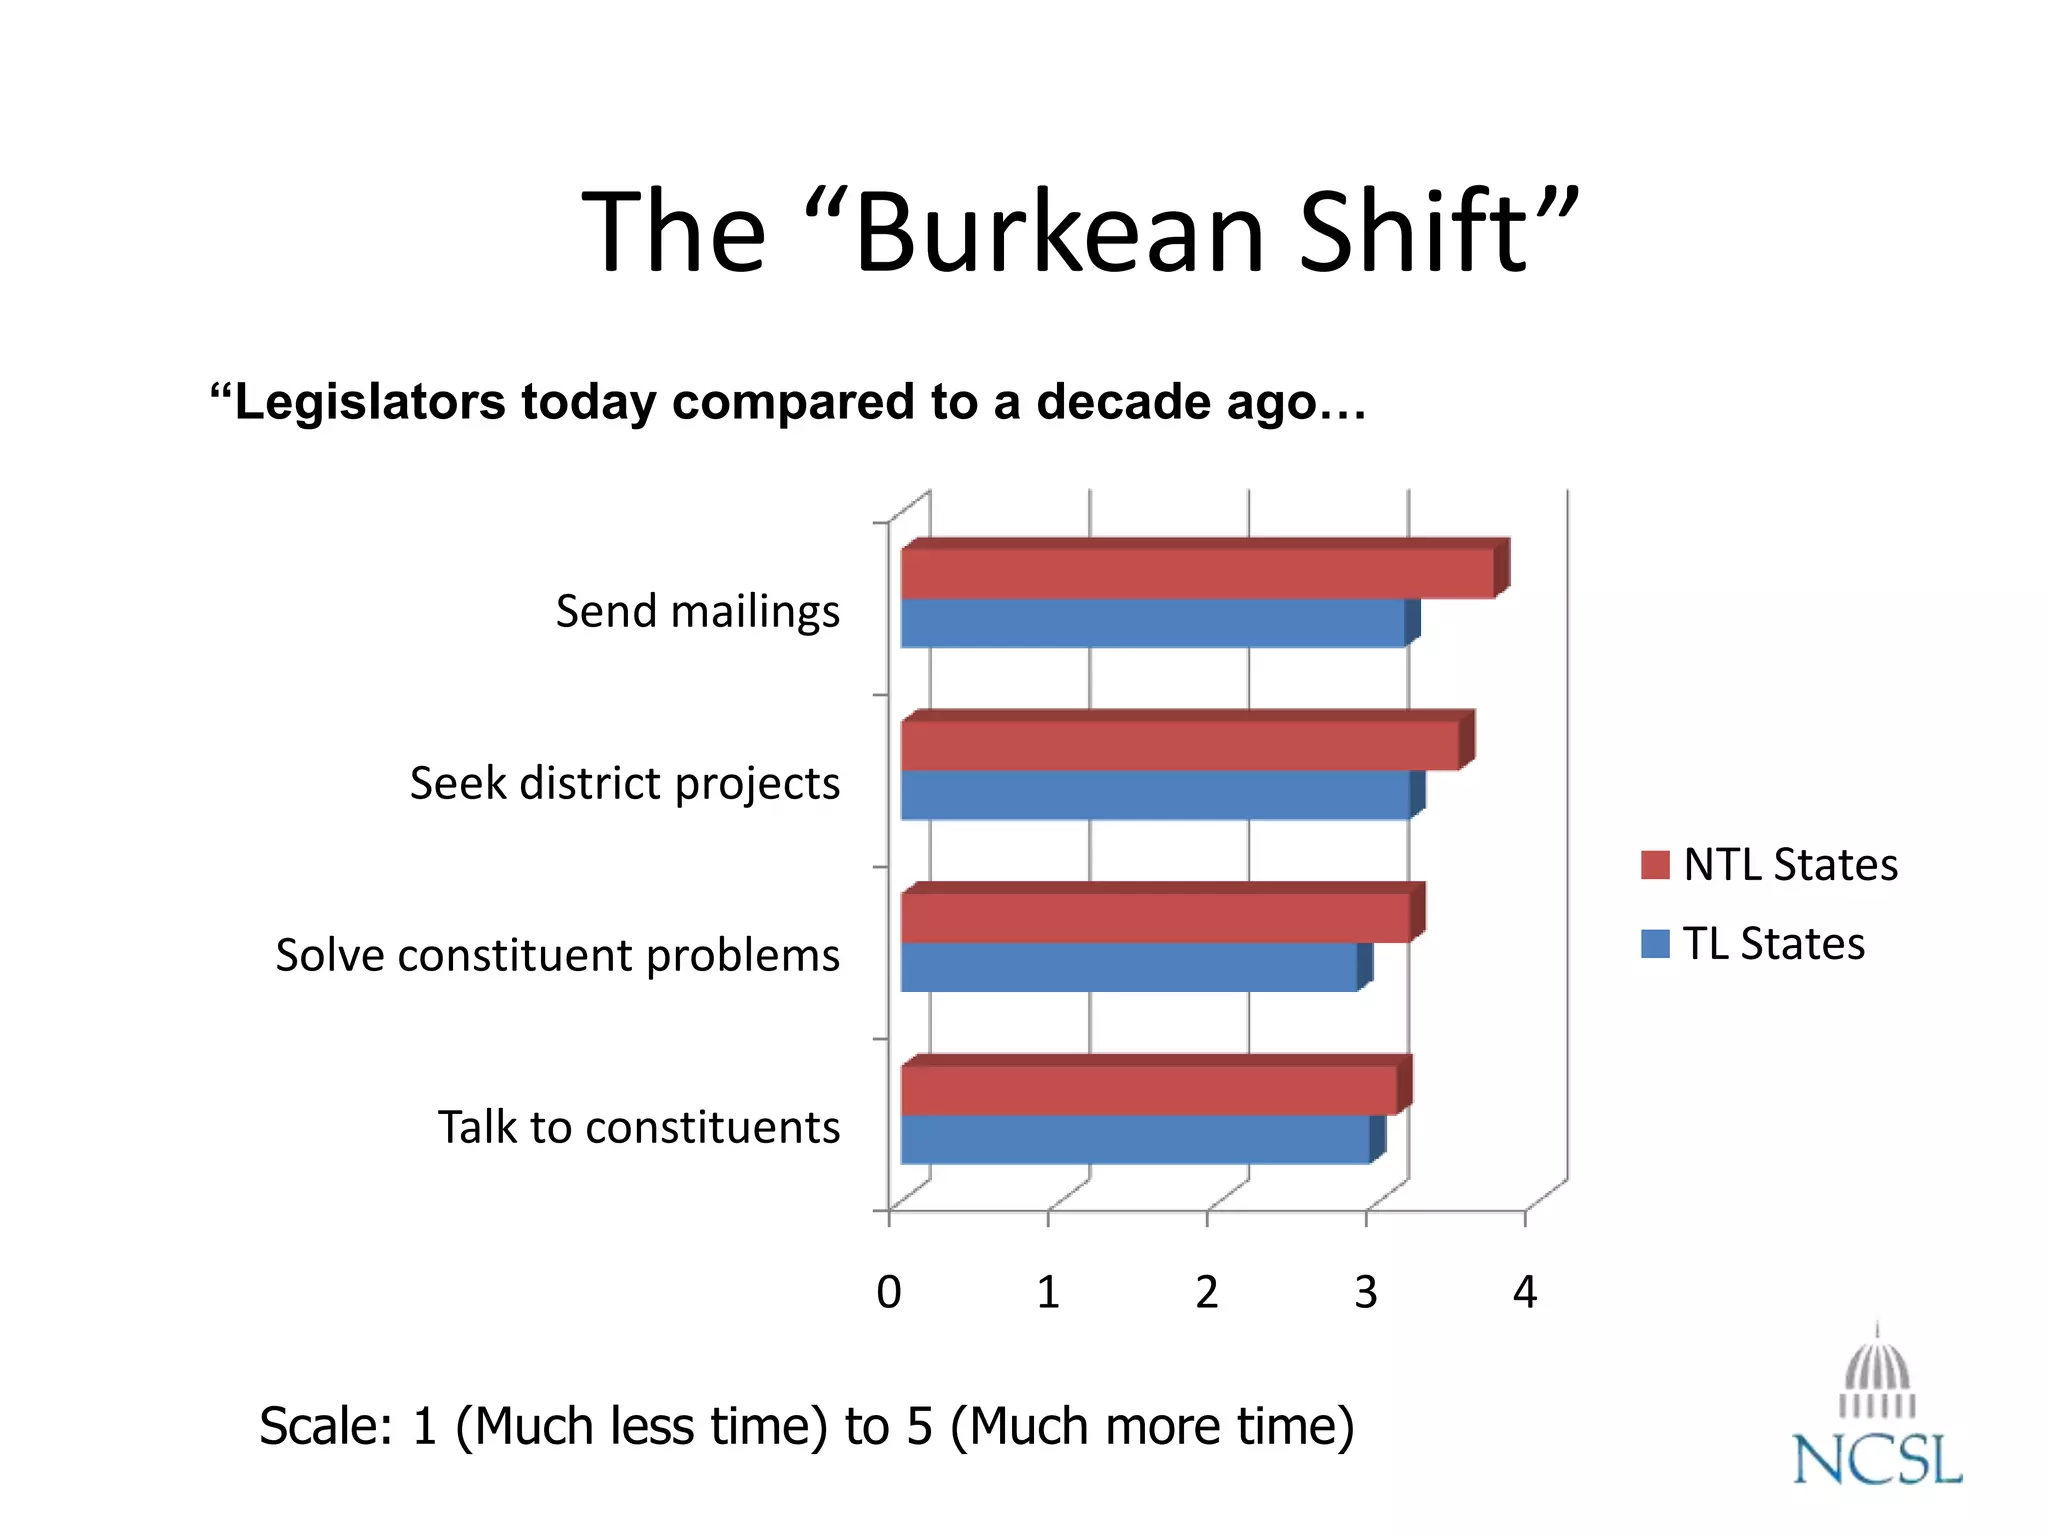
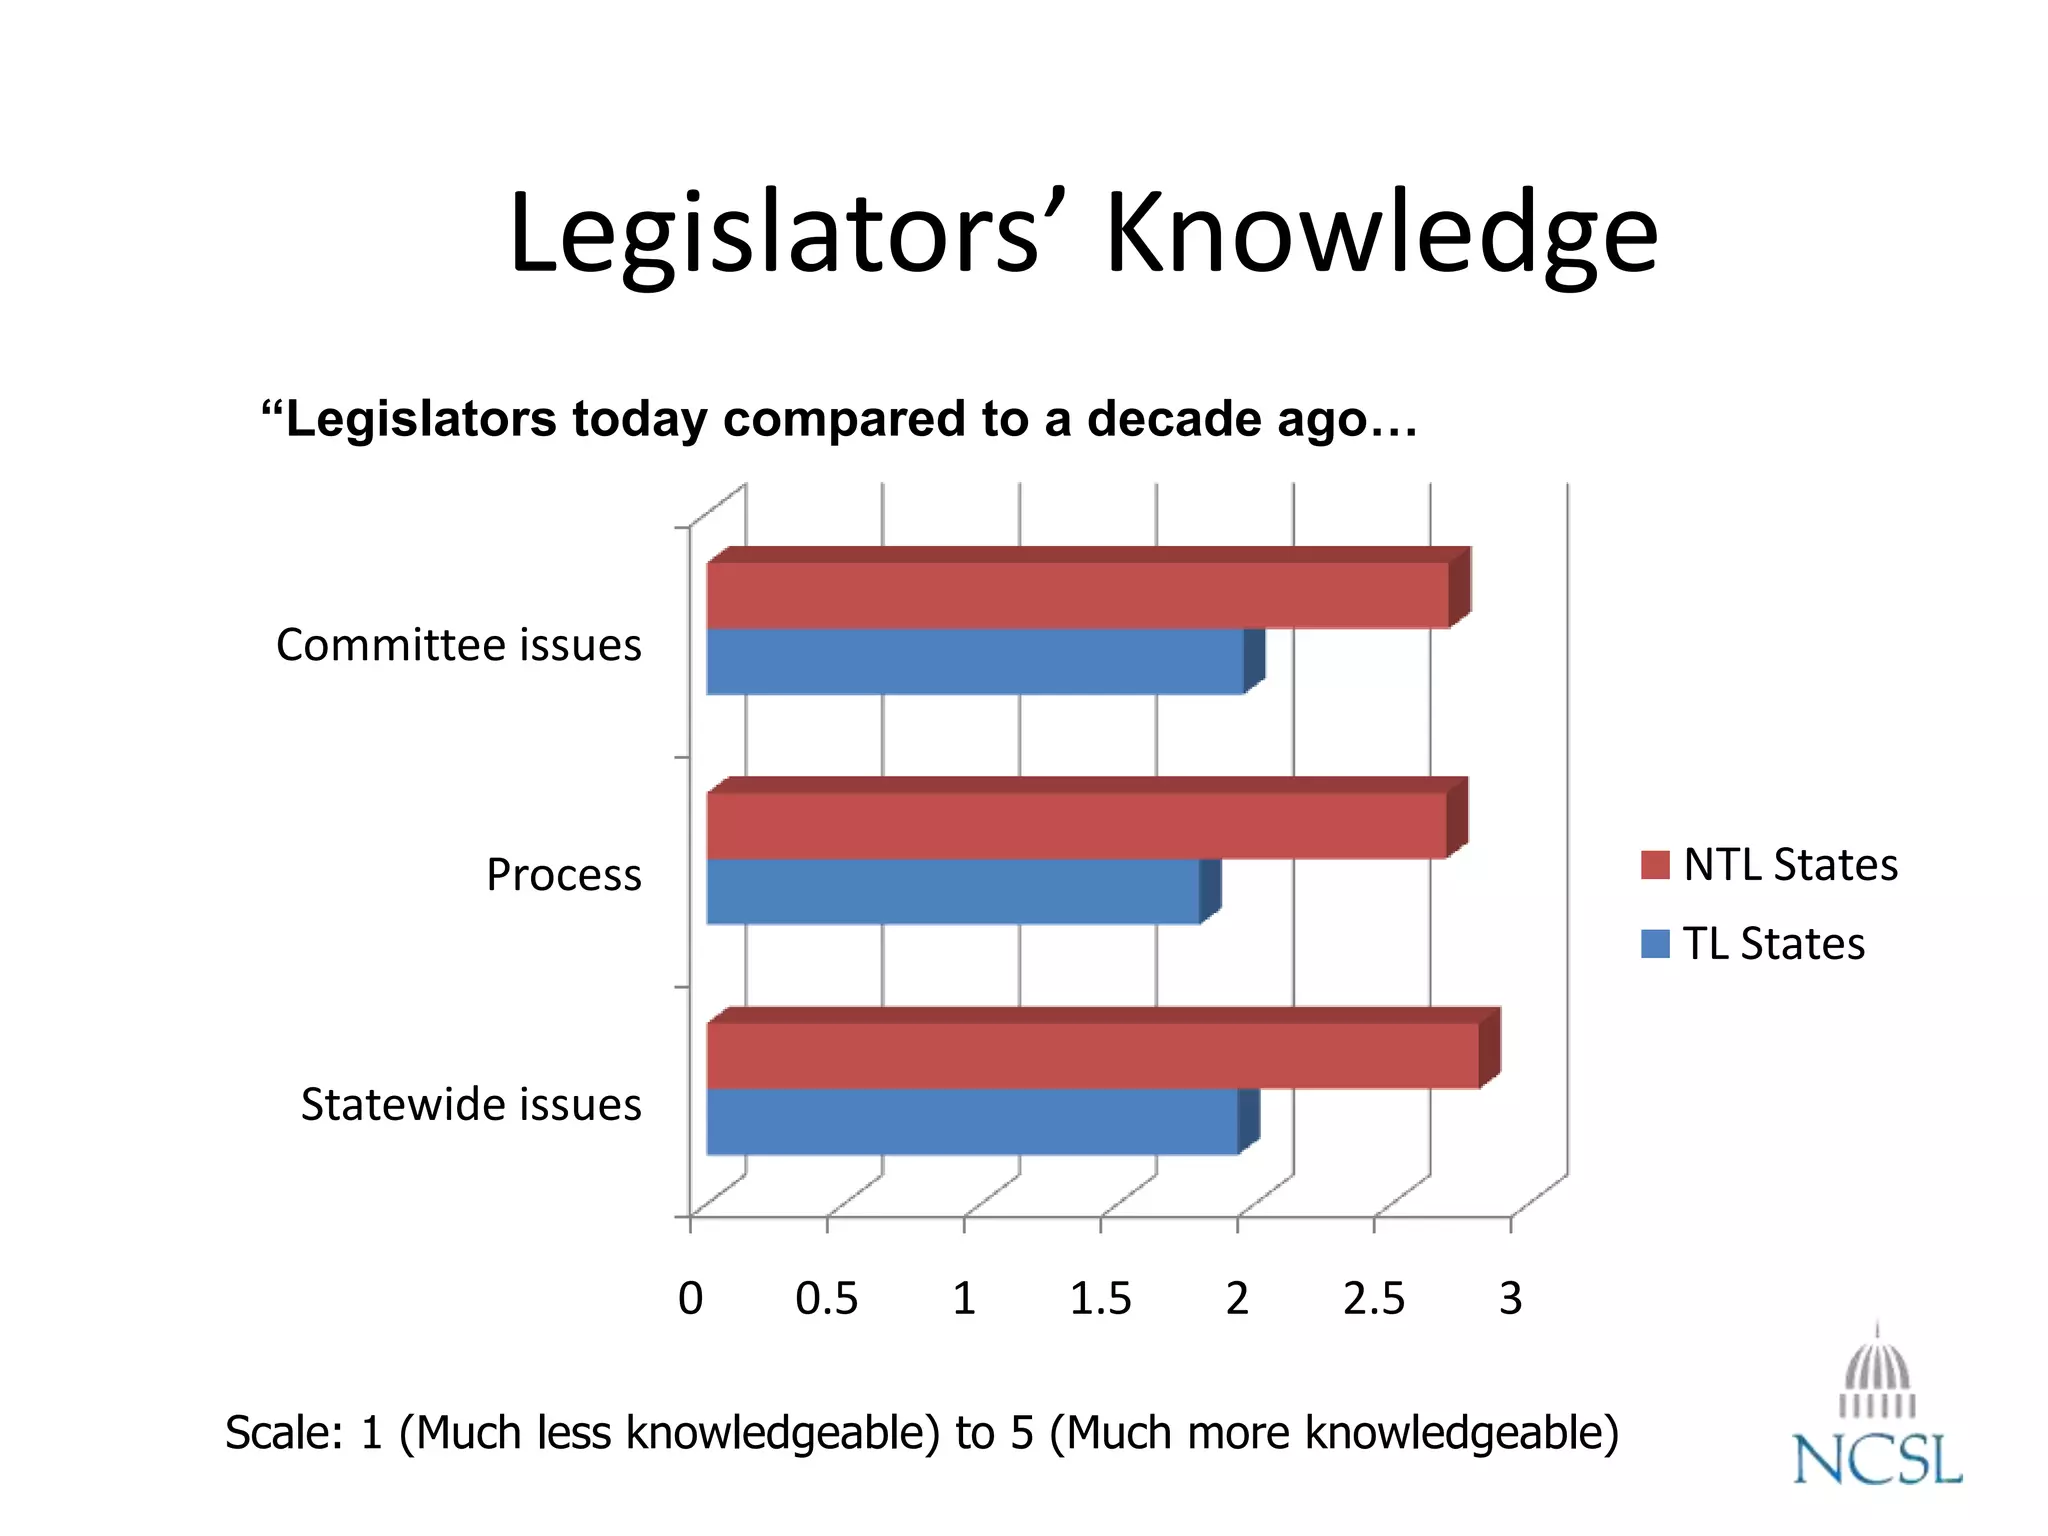
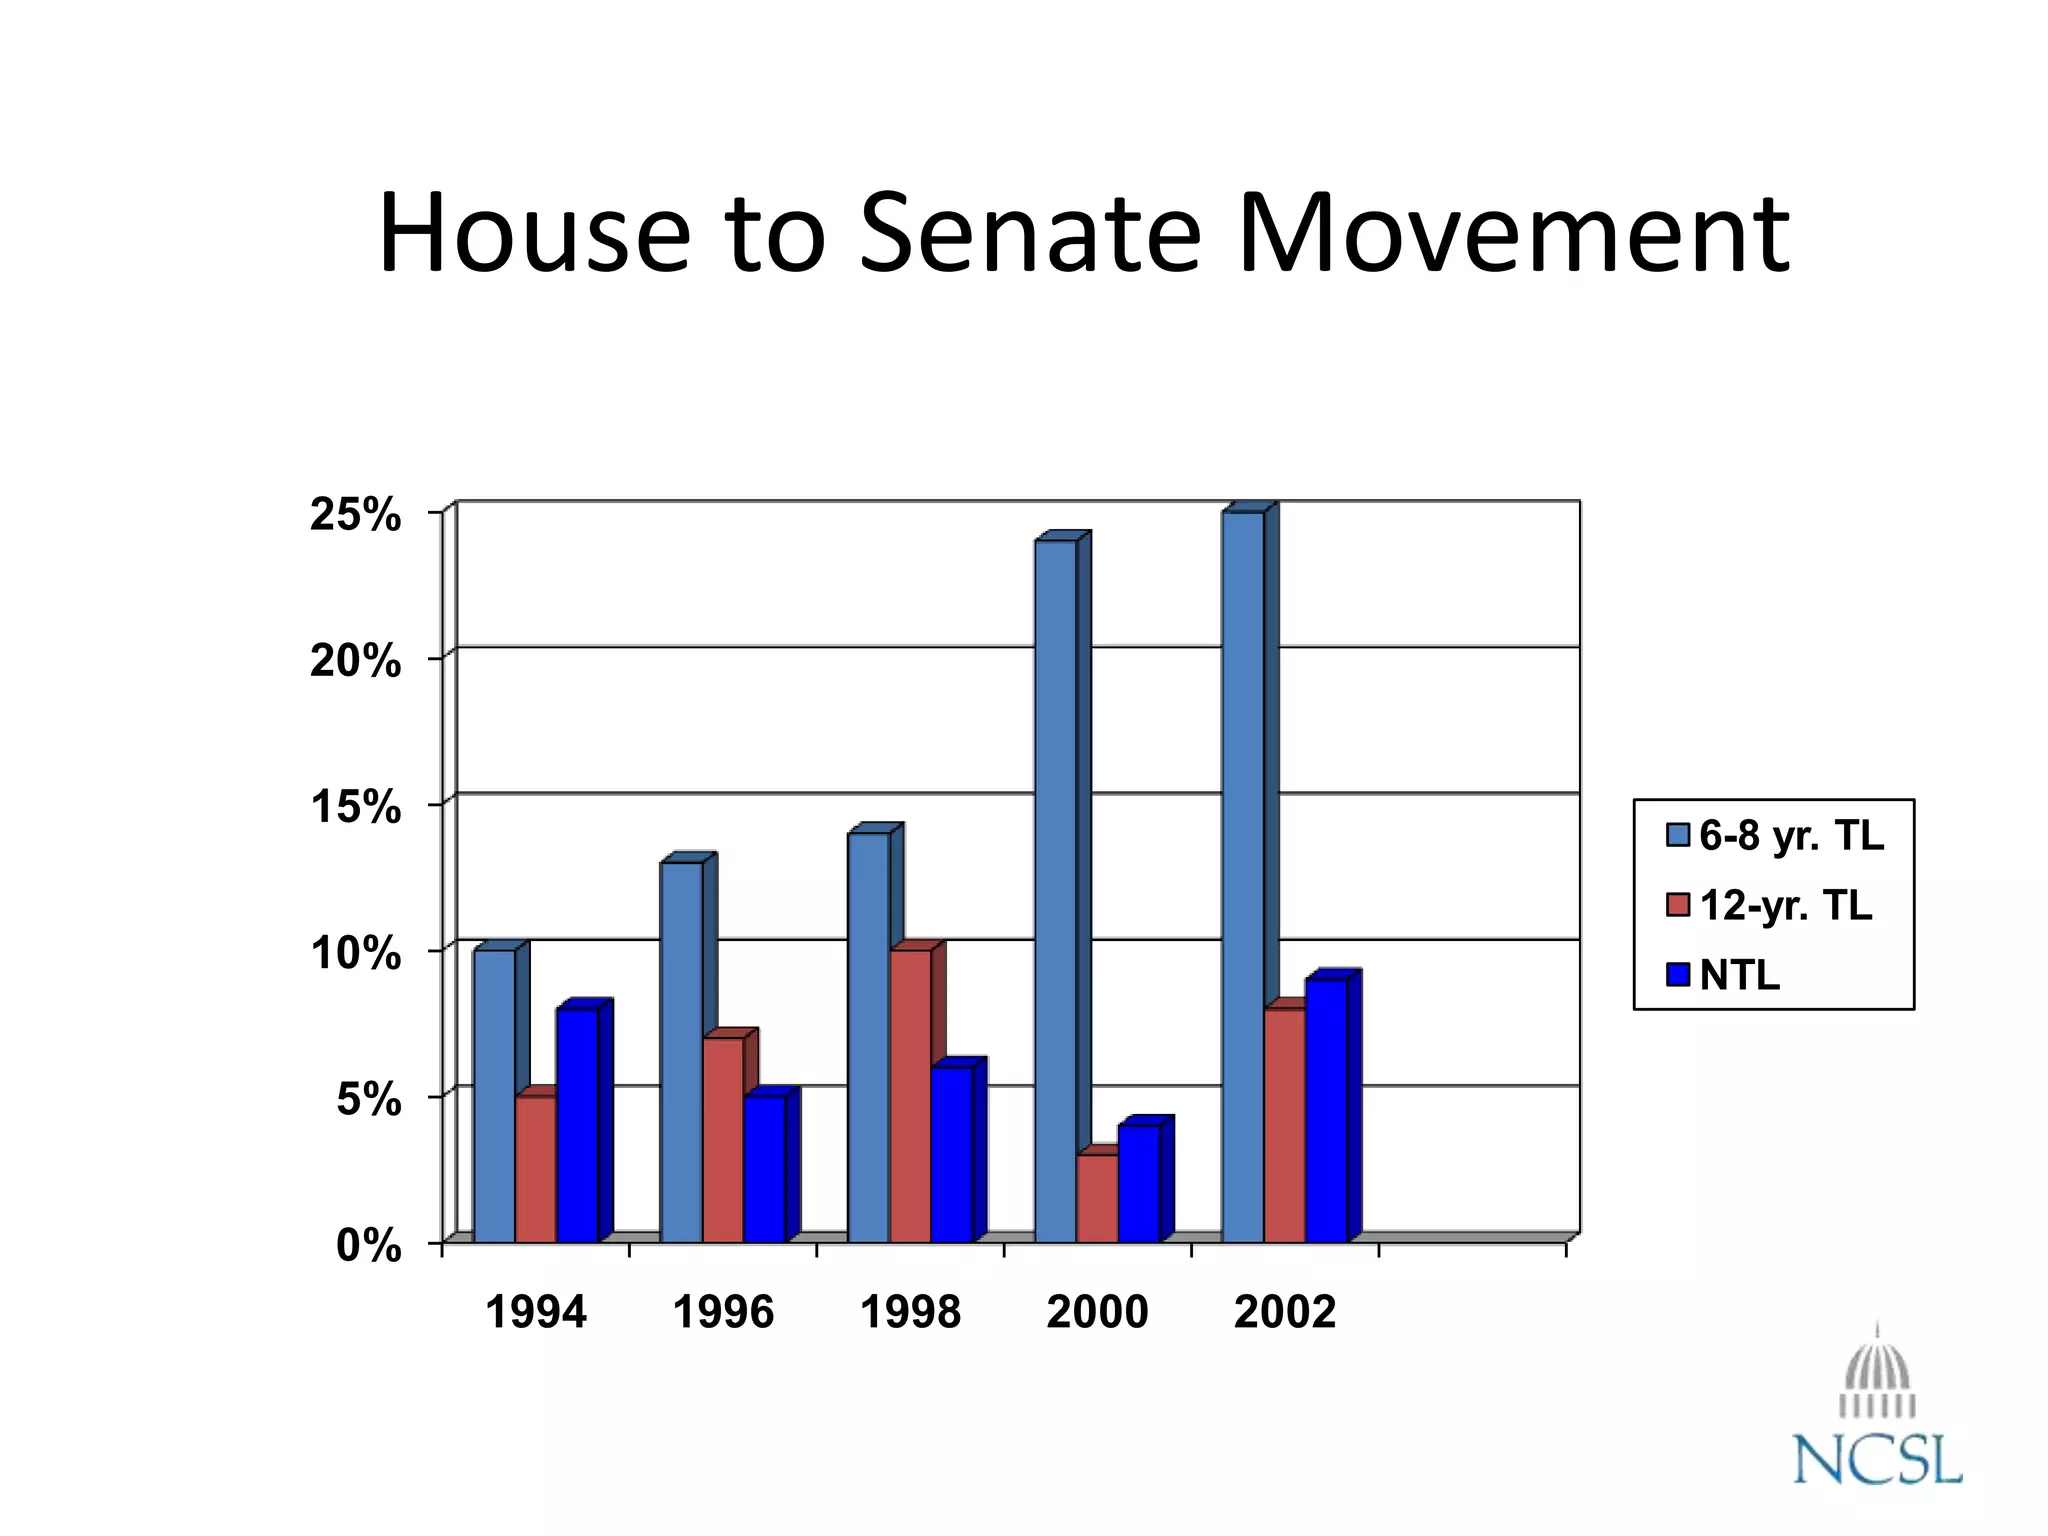
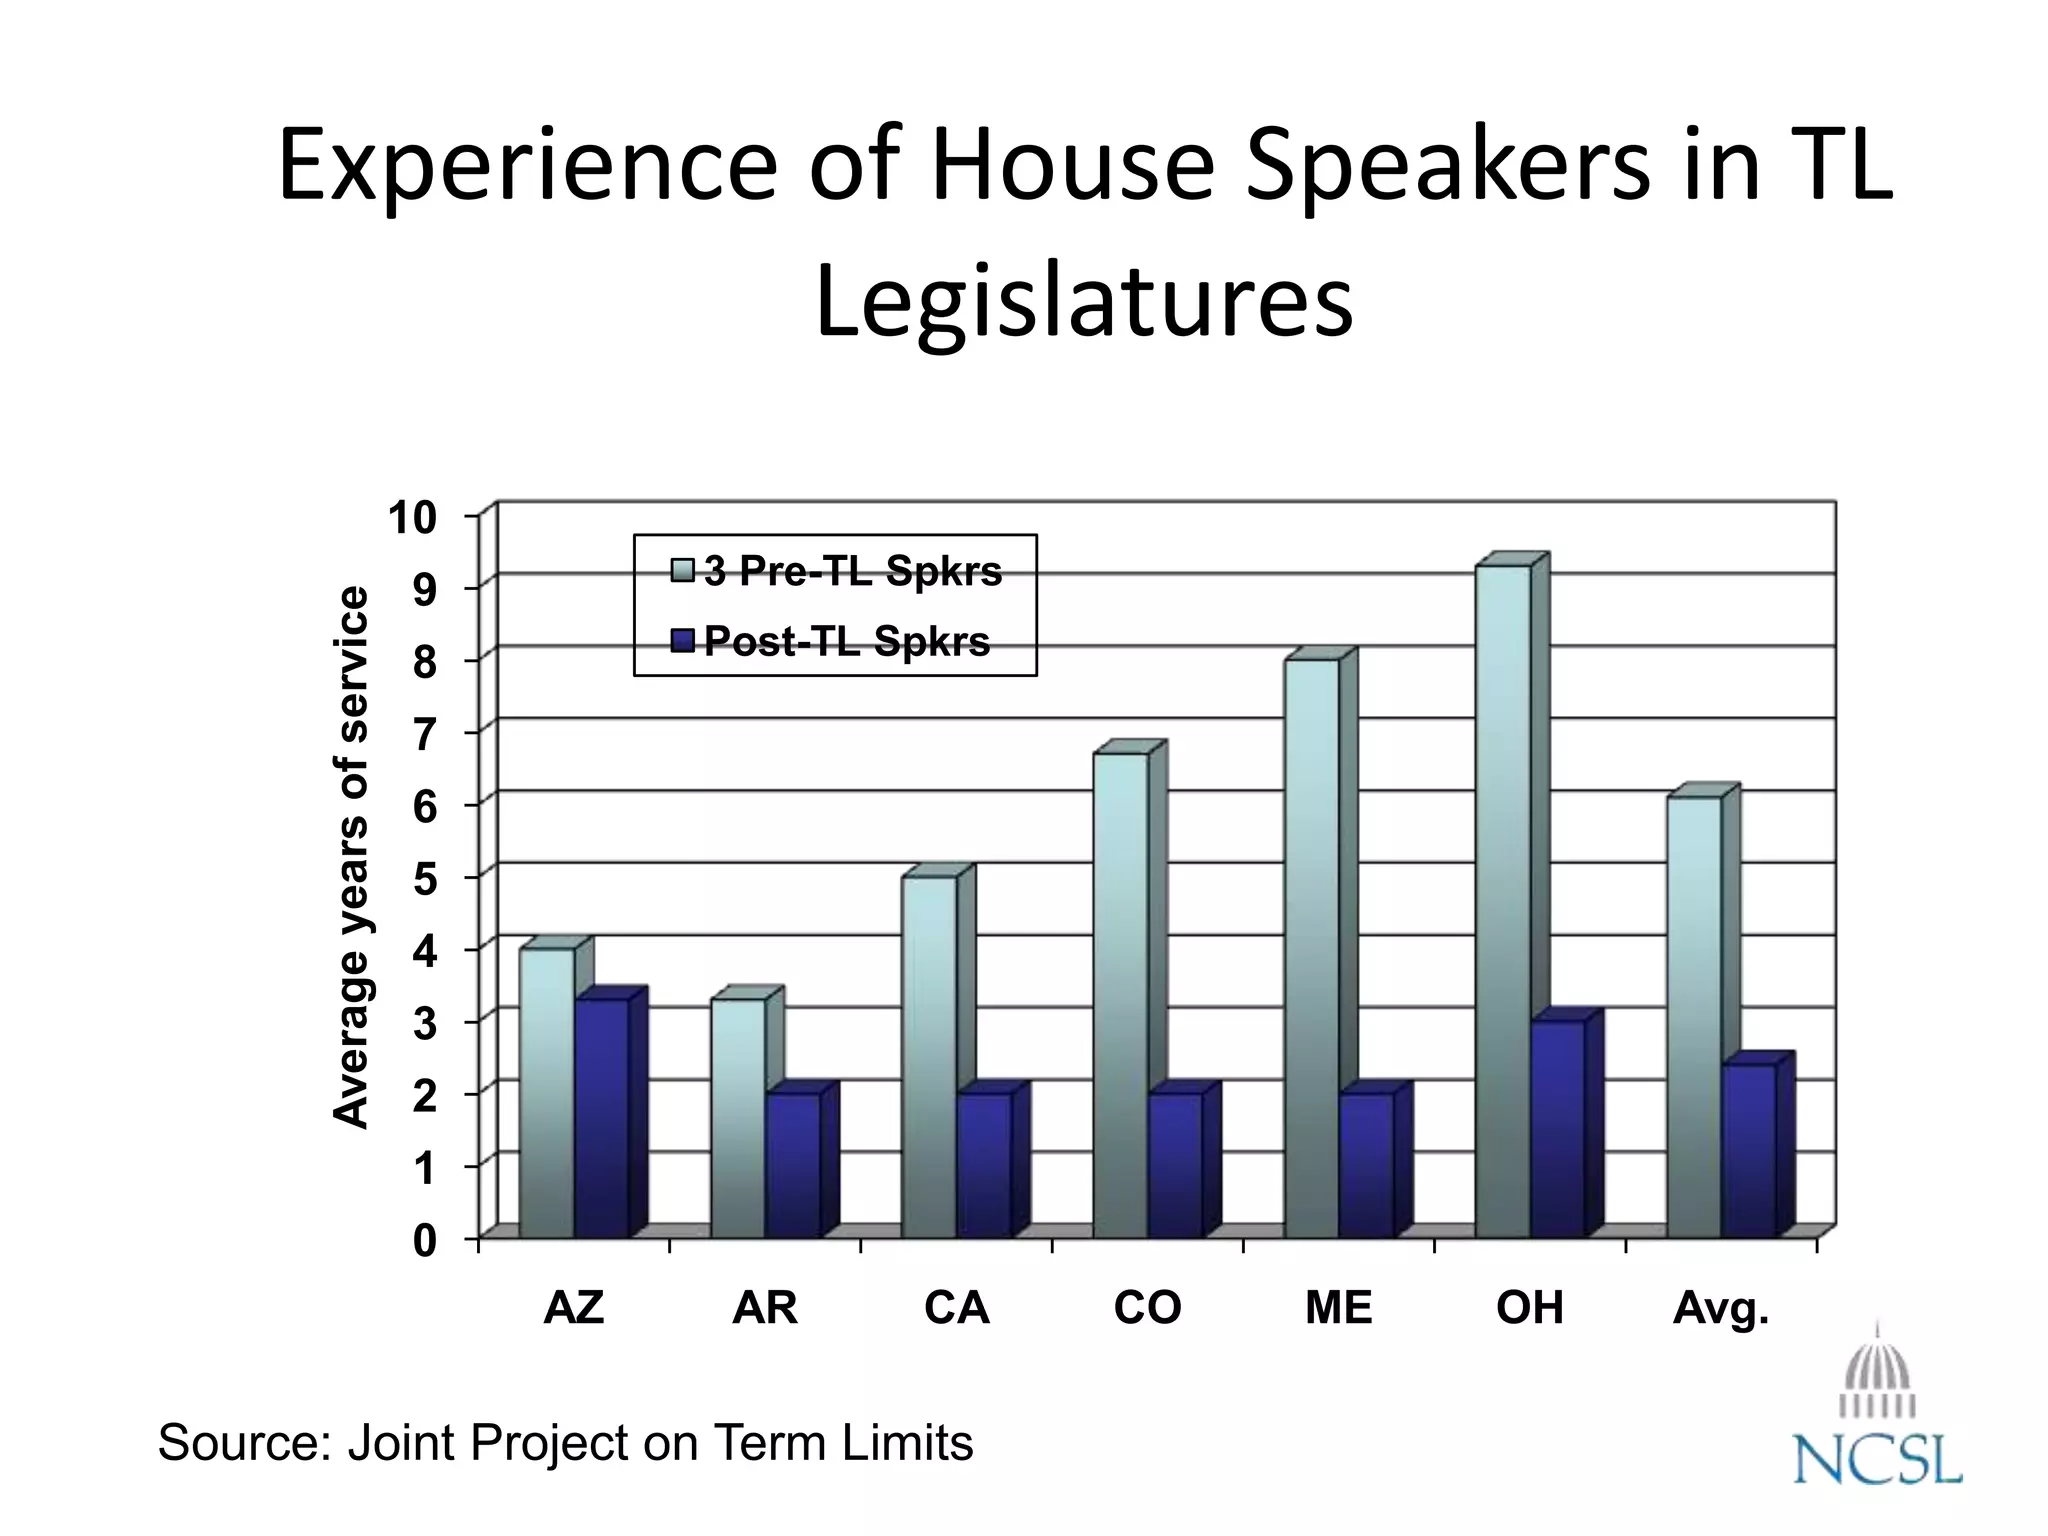
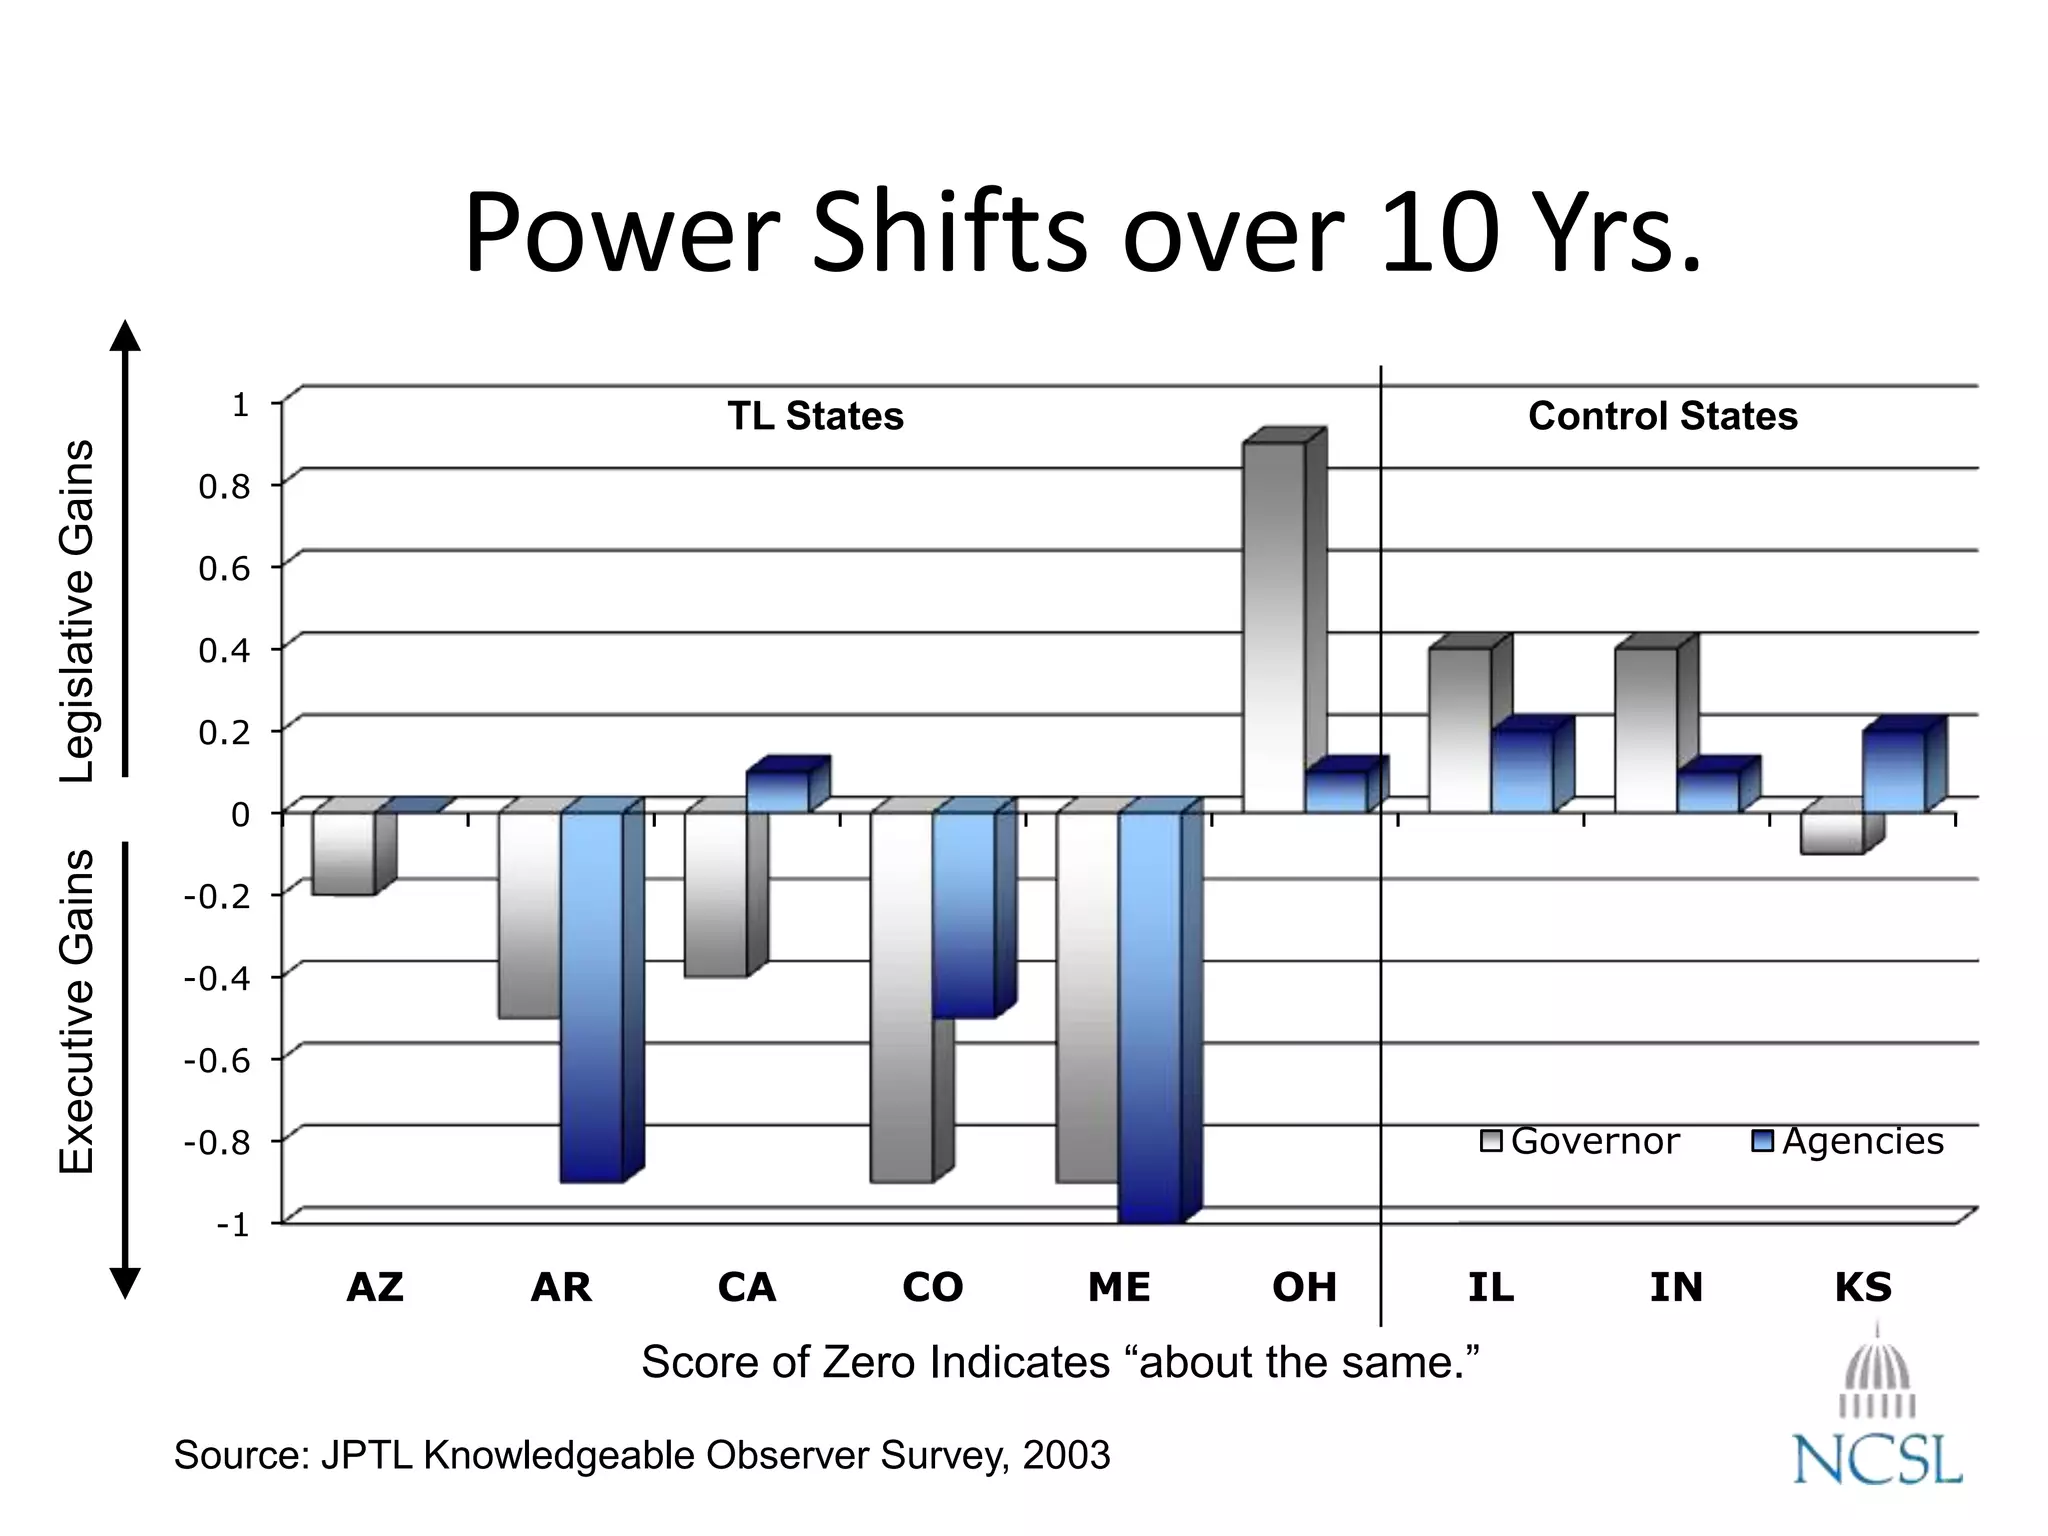
The Effects of Term Limits
Karl Kurtz
National Conference of State Legislatures
Term Limit Provisions
Limit in Years Consecutive Limit Lifetime Limit
6 House/8 Senate AR, MI
8 Total NE
8 House/8 Senate AZ, CO, FL, ME, MT,
OH, SD
MO
12 Total CA, OK
12 House/12 Senate LA NV
Turnover and Term Limits:
Membership Change in Houses
0
5
10
15
20
25
30
35
40
45
1968 70 72 74 76 78 80 82 84 86 88 90 92 94 96 98 2000 2 4 6 8 10
percent
House Turnover in Term-Limited and Non-Term-Limited States
TL States
NTL States
Source: Gary Moncrief, Richard G. Niemi and Lynda W. Powell, "Turnover in State Legislatures: An Update,"
Western Political Science Association, March 22-25, 2008
Term limit
enactment
period
The Experience Gap
Percent of Members in Each Chamber With at Least Five
Years Experience at Start of Next Session
-10
0
10
20
30
40
50
60
1990 1992 1994 1996 1998 2000 2002
6-yr TL 8-yr TL No TL
Source: Gary Moncrief, Richard G. Niemi and Lynda W. Powell, "Turnover in State Legislatures: An Update,"
Western Political Science Association, March 22-25, 2008
The “Burkean Shift”
0 1 2 3 4
Talk to constituents
Solve constituent problems
Seek district projects
Send mailings
NTL States
TL States
“Legislators today compared to a decade ago…
Scale: 1 (Much less time) to 5 (Much more time)
Legislators’ Knowledge
0 0.5 1 1.5 2 2.5 3
Statewide issues
Process
Committee issues
NTL States
TL States
“Legislators today compared to a decade ago…
Scale: 1 (Much less knowledgeable) to 5 (Much more knowledgeable)
House to Senate Movement
0%
5%
10%
15%
20%
25%
1994 1996 1998 2000 2002
6-8 yr. TL
12-yr. TL
NTL
Experience of House Speakers in TL
Legislatures
0
1
2
3
4
5
6
7
8
9
10
AZ AR CA CO ME OH Avg.
Averageyearsofservice
3 Pre-TL Spkrs
Post-TL Spkrs
Source: Joint Project on Term Limits
Power Shifts over 10 Yrs.
-1
-0.8
-0.6
-0.4
-0.2
0
0.2
0.4
0.6
0.8
1
AZ AR CA CO ME OH IL IN KS
Governor Agencies
TL States Control States
Score of Zero Indicates “about the same.”
ExecutiveGainsLegislativeGains
Source: JPTL Knowledgeable Observer Survey, 2003
Summary: Effects of Term Limits
• Vary depending on type of legislature
• Loss of experienced legislators
– Less knowledge of substantive issues
– Less institutional knowledge
– More chaotic legislatures
• No effect on who is elected
• Less attention to constituents
• Senates have more experience
• Governors gained power
Limits on Leaders’ Terms
Years By Custom By Rule By Statute
2 Florida House
Florida Senate
North Dakota House
South Dakota House
Wyoming House
Arkansas Senate
Wyoming Senate
4 Kansas House
Kansas Senate
Oklahoma House
6 Connecticut House Maine House
Maine Senate
8 Massachusetts House
Massachusetts Senate

The Effects of Term Limits

  • 1.
    The Effects ofTerm Limits Karl Kurtz National Conference of State Legislatures
  • 2.
    Term Limit Provisions Limitin Years Consecutive Limit Lifetime Limit 6 House/8 Senate AR, MI 8 Total NE 8 House/8 Senate AZ, CO, FL, ME, MT, OH, SD MO 12 Total CA, OK 12 House/12 Senate LA NV
  • 3.
    Turnover and TermLimits: Membership Change in Houses 0 5 10 15 20 25 30 35 40 45 1968 70 72 74 76 78 80 82 84 86 88 90 92 94 96 98 2000 2 4 6 8 10 percent House Turnover in Term-Limited and Non-Term-Limited States TL States NTL States Source: Gary Moncrief, Richard G. Niemi and Lynda W. Powell, "Turnover in State Legislatures: An Update," Western Political Science Association, March 22-25, 2008 Term limit enactment period
  • 4.
    The Experience Gap Percentof Members in Each Chamber With at Least Five Years Experience at Start of Next Session -10 0 10 20 30 40 50 60 1990 1992 1994 1996 1998 2000 2002 6-yr TL 8-yr TL No TL Source: Gary Moncrief, Richard G. Niemi and Lynda W. Powell, "Turnover in State Legislatures: An Update," Western Political Science Association, March 22-25, 2008
  • 5.
    The “Burkean Shift” 01 2 3 4 Talk to constituents Solve constituent problems Seek district projects Send mailings NTL States TL States “Legislators today compared to a decade ago… Scale: 1 (Much less time) to 5 (Much more time)
  • 6.
    Legislators’ Knowledge 0 0.51 1.5 2 2.5 3 Statewide issues Process Committee issues NTL States TL States “Legislators today compared to a decade ago… Scale: 1 (Much less knowledgeable) to 5 (Much more knowledgeable)
  • 7.
    House to SenateMovement 0% 5% 10% 15% 20% 25% 1994 1996 1998 2000 2002 6-8 yr. TL 12-yr. TL NTL
  • 8.
    Experience of HouseSpeakers in TL Legislatures 0 1 2 3 4 5 6 7 8 9 10 AZ AR CA CO ME OH Avg. Averageyearsofservice 3 Pre-TL Spkrs Post-TL Spkrs Source: Joint Project on Term Limits
  • 9.
    Power Shifts over10 Yrs. -1 -0.8 -0.6 -0.4 -0.2 0 0.2 0.4 0.6 0.8 1 AZ AR CA CO ME OH IL IN KS Governor Agencies TL States Control States Score of Zero Indicates “about the same.” ExecutiveGainsLegislativeGains Source: JPTL Knowledgeable Observer Survey, 2003
  • 10.
    Summary: Effects ofTerm Limits • Vary depending on type of legislature • Loss of experienced legislators – Less knowledge of substantive issues – Less institutional knowledge – More chaotic legislatures • No effect on who is elected • Less attention to constituents • Senates have more experience • Governors gained power
  • 11.
    Limits on Leaders’Terms Years By Custom By Rule By Statute 2 Florida House Florida Senate North Dakota House South Dakota House Wyoming House Arkansas Senate Wyoming Senate 4 Kansas House Kansas Senate Oklahoma House 6 Connecticut House Maine House Maine Senate 8 Massachusetts House Massachusetts Senate