More Related Content
Similar to Affluent Austerity: Is Your Business Feeling It? What to Do About It.
Similar to Affluent Austerity: Is Your Business Feeling It? What to Do About It. (20)
Affluent Austerity: Is Your Business Feeling It? What to Do About It.
- 2. 5
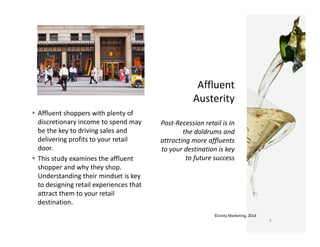
© Unity Marketing, 2014
1,147,500 1,143,031 1,097,323 1,125,548 1,169,181 1,209,964 1,228,710
‐0.4%
‐4.0%
2.6%
3.9%
3.5%
1.5%
‐5.0%
‐4.0%
‐3.0%
‐2.0%
‐1.0%
0.0%
1.0%
2.0%
3.0%
4.0%
5.0%
1,000,000
1,050,000
1,100,000
1,150,000
1,200,000
1,250,000
2007 2008 2009 2010 2011 2012 2013
GAFO = General Merchandise, Apparel and Accessories, Furniture and Other Sales
GAFO Retail Sales & Percent Change
GAFO Retail Sales Iin millions) % Chg Previous Year
- 3. 6
© Unity Marketing, 2014
87,020 90,003 100,275 97,877 375,175 373,271
0
50,000
100,000
150,000
200,000
250,000
300,000
350,000
400,000
Jan‐14 Feb‐14 Mar‐14 Apr‐14 YTD '14 YTD '13
Source: U.S. Census; Advanced Monthly Retail Trade Report
in millions
GAFO Store Sales 2014 Up less than 1% over
previous year ‐‐only +.51%
- 4. BEA shows significantly less robust personal
consumption from 2010‐2013, as compared to 1998‐
2000 and 2004‐2006.
Dismal 1Q2014 GDP report
Real gross domestic product ‐‐ the output of goods
and services produced by labor and property located
in the United States – actually fell at a 2.9% rate from
first quarter from the fourth quarter of 2013, the
worse report since 2009..
Personal consumption rose only 1% in 1Q14, after
rising 2.0% in 2013.
7
© Unity Marketing, 2014
5.3%
5.9%
5.1%
2.5% 2.5%
3.1%
3.8%
3.5%
3.0%
2.2%
‐0.4%
‐1.6%
2.0%
2.5%
2.2% 2.0%
1.0%
‐2.0%
‐1.0%
0.0%
1.0%
2.0%
3.0%
4.0%
5.0%
6.0%
7.0%
'98 '99 ; ; 00 '01 '02 '03 '04 '05 '06 '07 '08 '09 '10 '11 '12 '13 1Q14
SOURCE: BEA
PERSONAL CONSUMPTION EXPENDITURES PERCENT
CHANGE FROM PRECEDING YEAR