This paper presents a technique to detect exudates in fundus images, which are crucial for diagnosing diabetic retinopathy to prevent vision loss. The detection process utilizes the green channel of RGB images, applies preprocessing steps, discrete wavelet transform, and features extracted for classification through methods like KNN, SVM, and Neural Networks. If exudates are identified, the regions of interest are extracted using Canny edge detection and morphological operations to assess their severity.
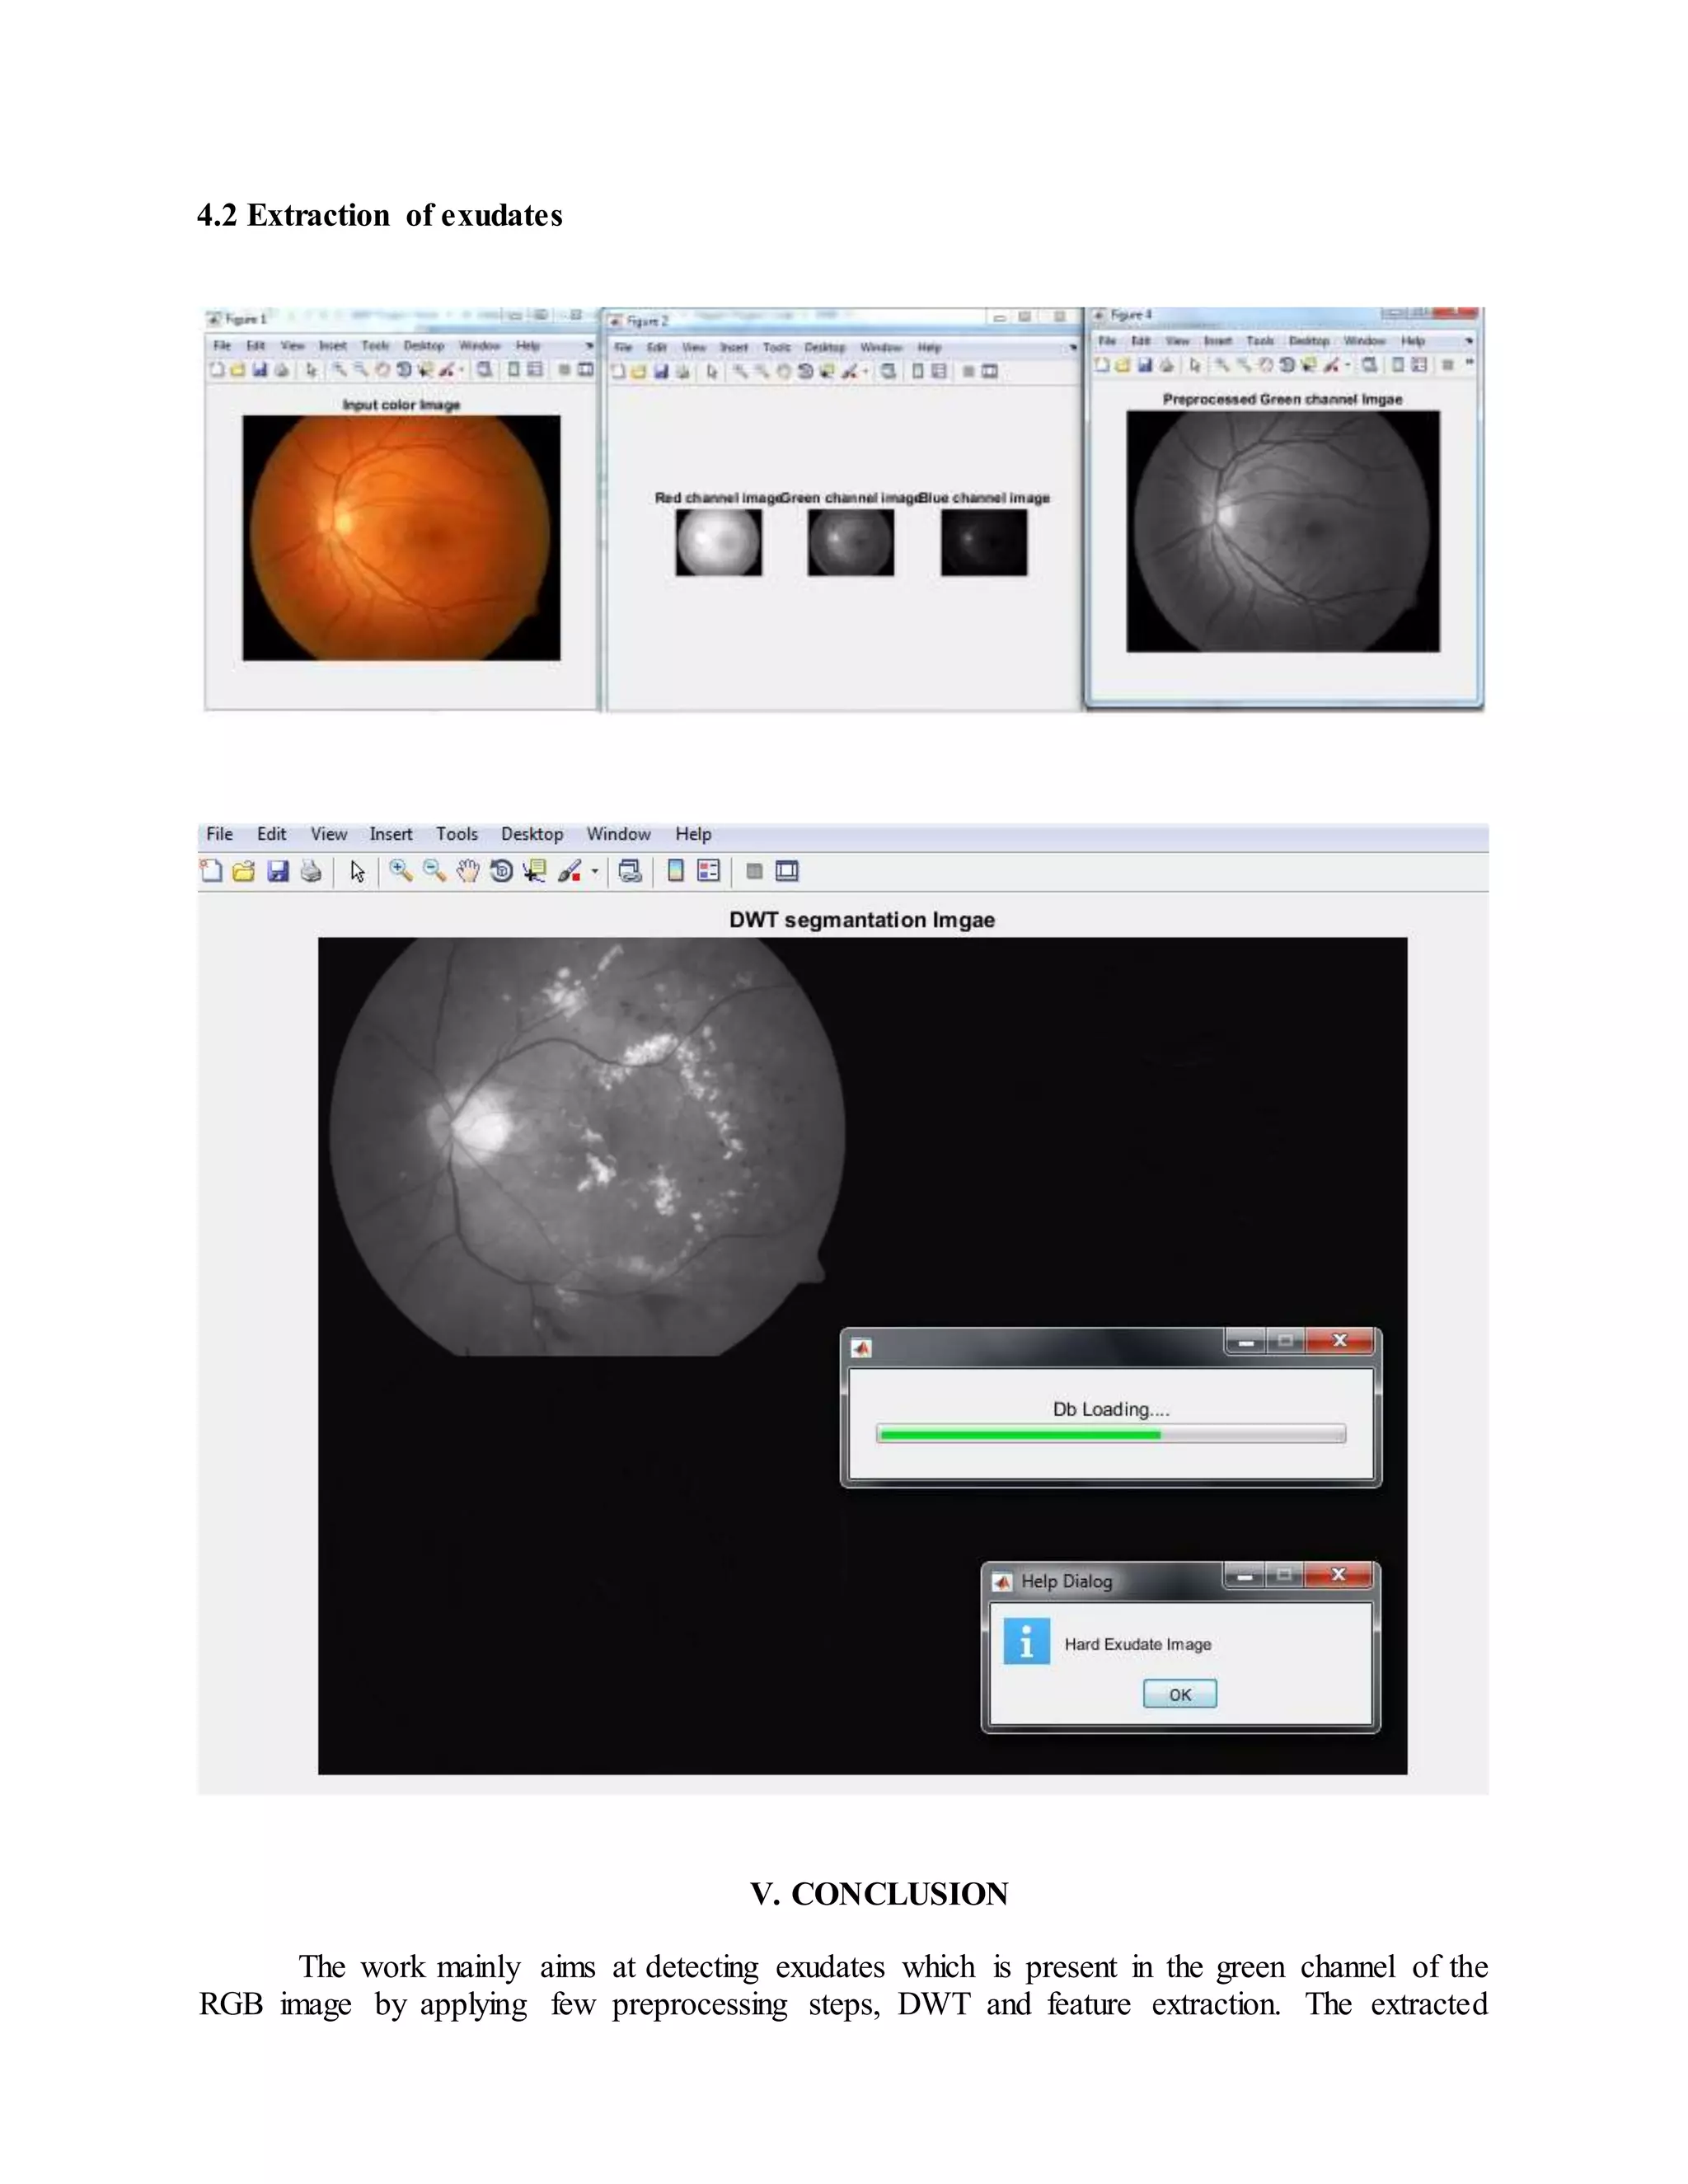
![The paper as a whole speaks about extracting the Exudate region from the loaded test image.
Initially green channel from the loaded colored retina image is extracted. Further segmentation of
green channel using discreet wavelet transformer which is pre-processed using histogram analysis
and feature extraction is initiated. Following extracting of feature for all the database images in the
same process is functioned. The database features and extracted test image feature are applied for
3 different classifiers, the classifier results are compared in terms of accuracy sensitivity and
specificity. Finally if an exudate is present in the test image, the extraction of exudate region ROI
is done based on canny edge detection and morphological operations
Organization of the paper is done as follows: A brief idea about diabetic retinopathy is given in
introduction section. In literature survey section we have explained few existing methodologies
and their outcomes. Proposed methodologies is explained in section 3, followed by results and
comparison. The reference papers are given in last section.
II. LITERATURE SURVEY
There are several algorithms available in the literature for detection of exudates in fundus
images. Exudates regions show higher gray level intensity and contrast in fundus images. Some
work using image processing algorithms on Fundus image to find exudates has been reported.
Morphological and Neural Network Based Approach by Sangita Bharkad et.al [1], In this work,
optic disc (OD) is extracted with the help of morphological operators. OD is masked in green
component image to avoid the misclassification between OD region and hard exudates region.
Then features of green component image are computed and applied to neural network for detection
of hard exudates. Experimental results show the better competency of algorithm 100% sensitivity
95.45% specificity and 97.46% accuracy. This work can be extended for lesion based detection of
hard exudates in retinal images.
3σ Control Method by Mohammed Shafeeq Ahmed et.al [2], the work presented in this is to detect
the exudates (yellowish fat deposit on the retinal surface) from fundus images in RGB color space,
thereby facilitate a realistic diagnosis close to the method adopted by ophthalmologist. A Statistical
measure-three sigma is used to compute the color intensity range of exudates pixels. The retinal
images are preprocessed to enhance the color intensity and optic disk (OD) is eliminated because,
it shares similar features with exudates. The aim and objective of this work is to detect the exudates
from RGB fundus images, the pre-processed images are then classified based on the information
extracted from threesigma control method. The elimination of optic disc is also a key step in
preprocessing; Hough Transform method assures that the eliminated part is OD not exudates and
it also used to obtain good results. The method presented has yielded encouraging results with
sensitivity of 99.93% and specificity of 99.99 %. The results so obtained are promising and also
facilitates the ophthalmologist in diagnosing the disease.
Wavelet Transform and PNN Approach by C. Nivetha et.al [3] proposes a method to find the
exudates (patches) from the blood vessels of an eye during diabetic retinopathy treatment. For
analysis, input retinal image is separated into three planes i.e., red, green and blue, from which
green channels are selected, which are further processed using Daubechies wavelet transform to
estimate the grey level co-occurrence matrix (GLCM) features. These features are processed using
probabilistic neural network (PNN) and input retinal image is compared with the database image
to classify it as normal or abnormal. Morphological operations are applied to the abnormal image](https://image.slidesharecdn.com/detectionofexudatesdraft-181221063601/75/Detection-of-exudates-draft-2-2048.jpg)
![to extract the blood vessels and then fuzzy C-means clustering is applied in the extracted blood
vessels to detect the exudates. The accuracy and sensitivity of the result obtained by the proposed
method is comparatively better and are 0.9776 and 0.9677 respectively. The method can be applied
successfully and the blood vessels and exudates can be effectively detected.
III. PROPOSED METHODOLOGY
The detailed methodology and process of the proposed exudates detection is been described
in the below block diagram.
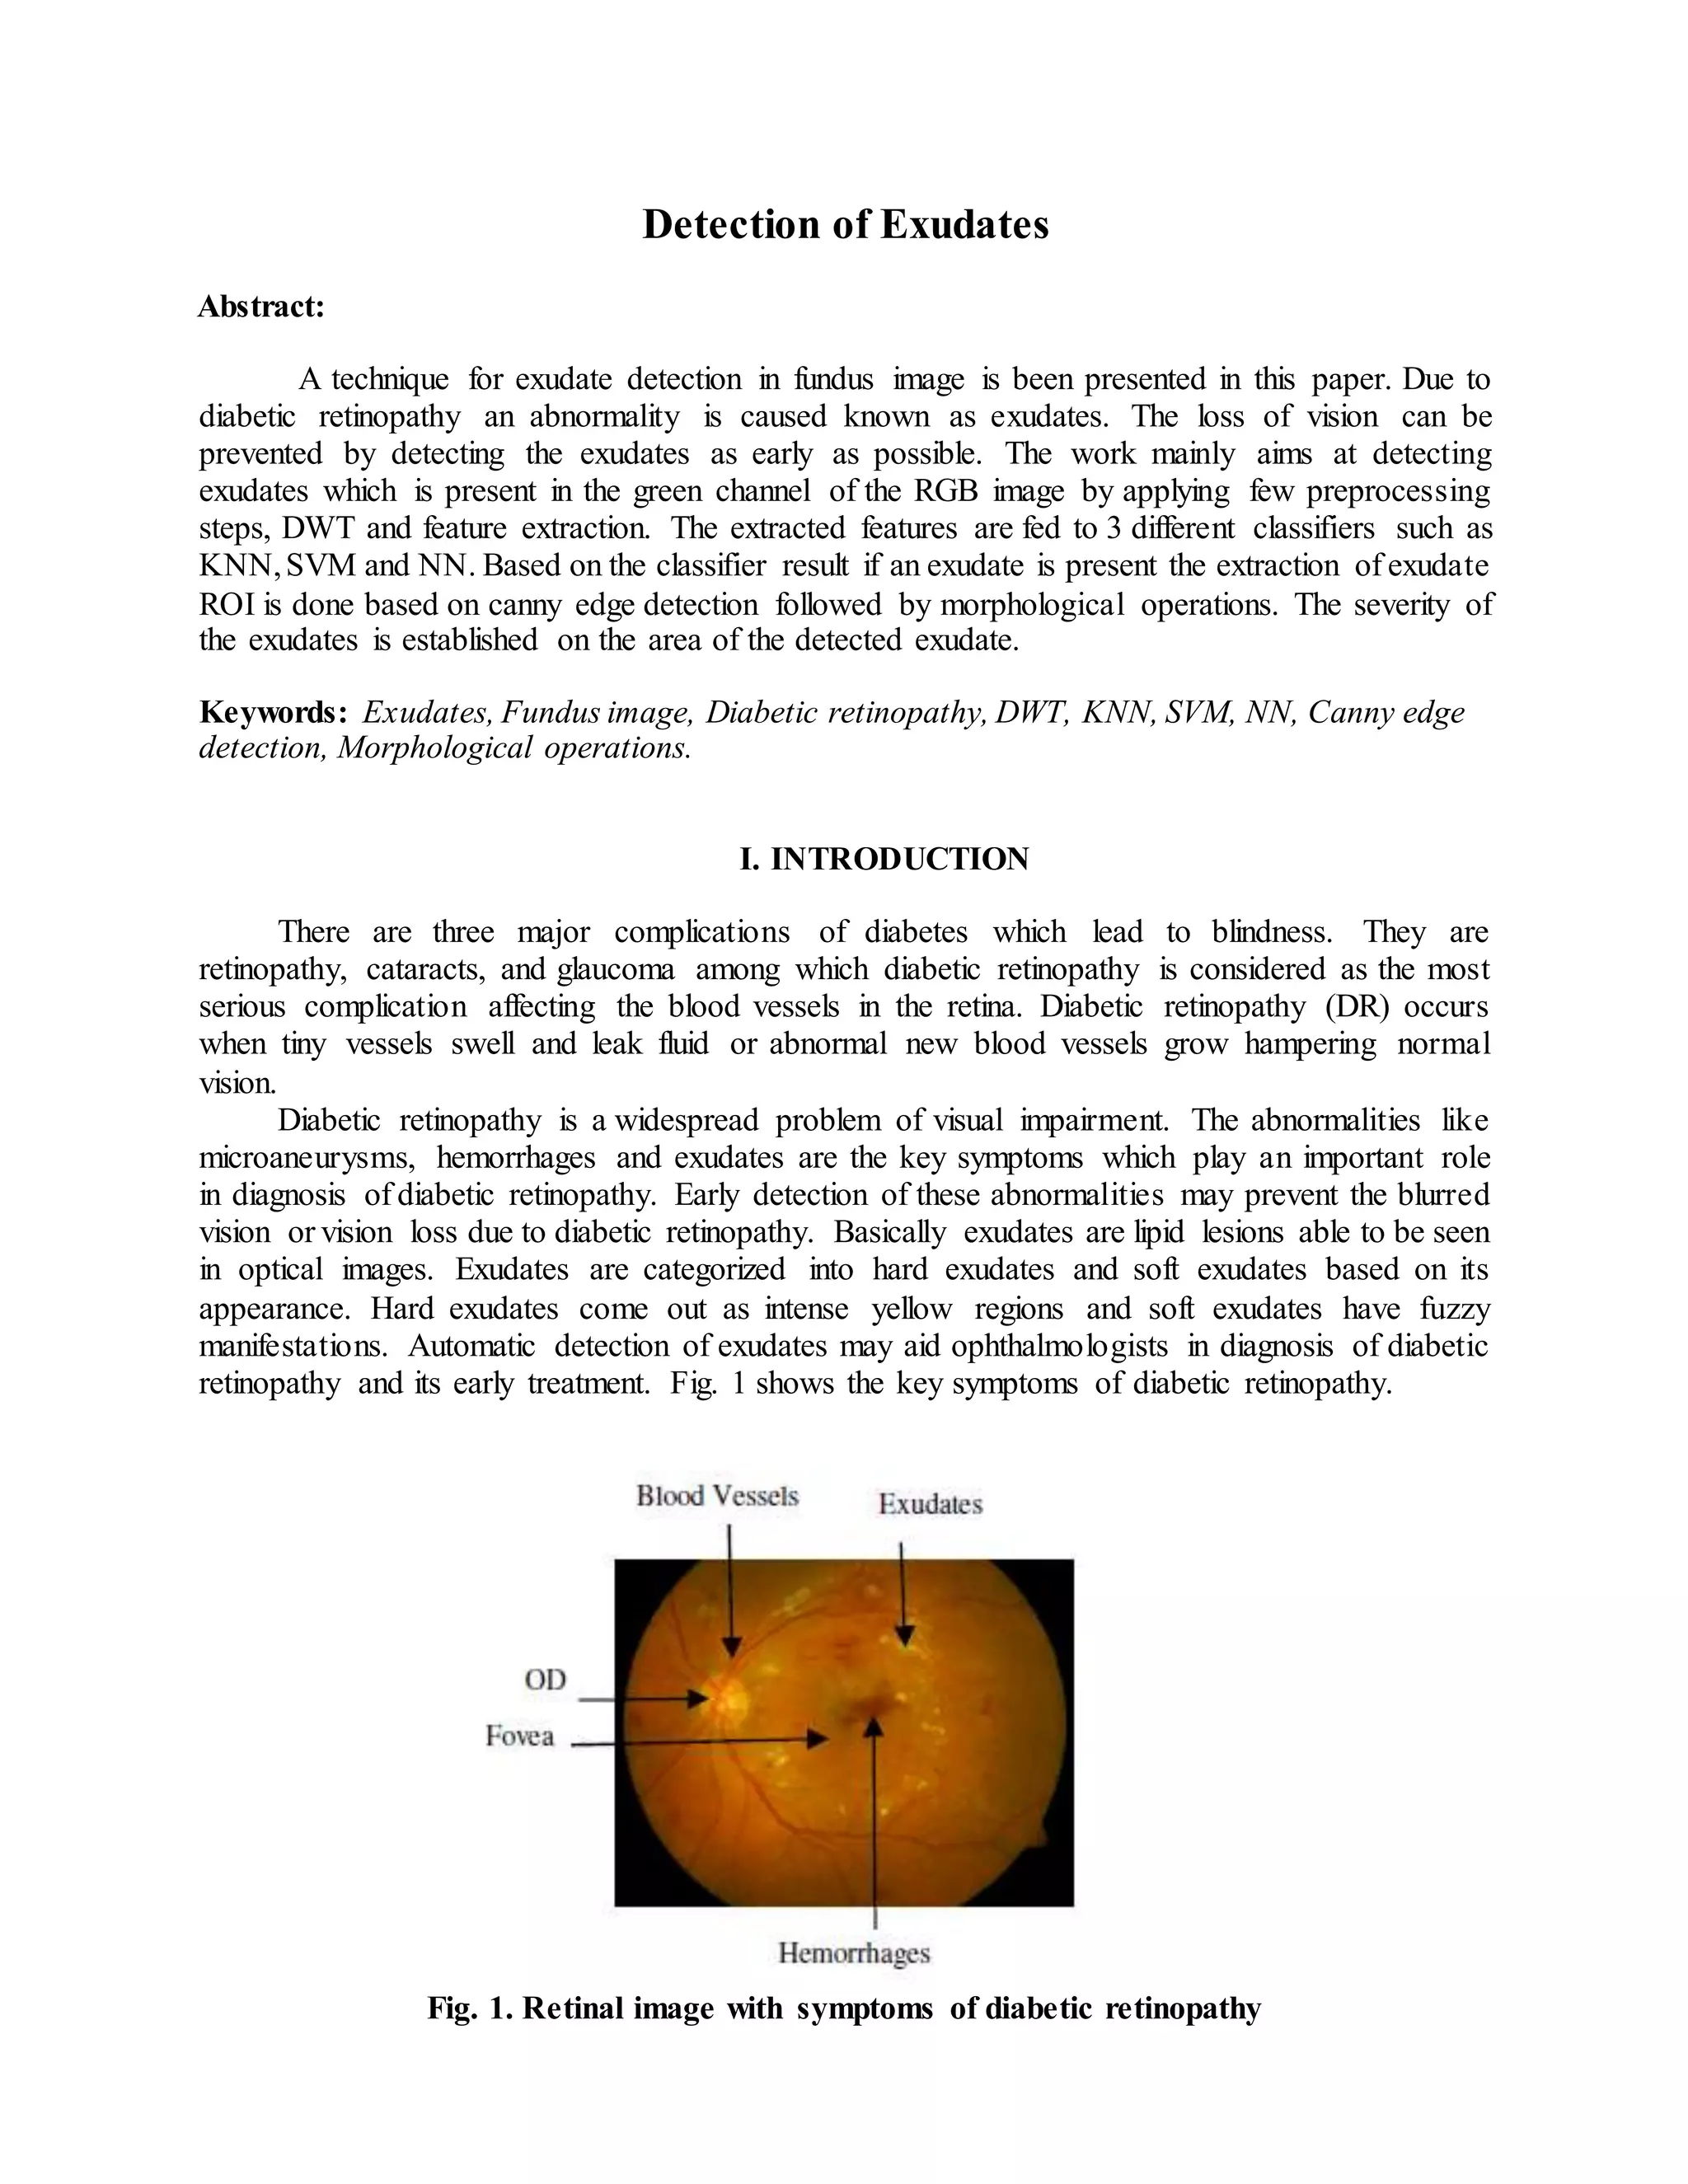
Fig. Detection and Classification of Exudates from Fundus Images
3.1 Image Acquisition (Describe of Dataset)
In this work, the input images used obtained from the DIAREDB1 database [1]. It consists
of 89 color fundus images of 1500x1152 pixels of which 84 contain non-proliferative signs of the
diabetic retinopathy, and 5 are considered as normal. Images were captured using the same 50
degree field-of-view digital fundus camera with varying imaging settings. This data set is referred
to evaluate the performance of this method.
Input
Image
Green
Channel
Pre-
processing
Segmenta
tion
Feature
Extraction
Classification
Process
Normal Image Exudate Image
Exudates Detection
Result Analysis
Database
Images
Green
Channel
Pre-
processing
Segmenta
tion
Feature
Extraction](https://image.slidesharecdn.com/detectionofexudatesdraft-181221063601/75/Detection-of-exudates-draft-3-2048.jpg)
![3.2 Pre-Processing using Histogram Equalization
An image histogram is a type of histogram that acts as a graphical representation of the
tonal distribution in a digital image. It plots the number of pixels for each tonal value. By looking
at the histogram for a specific image a viewer will be able to judge the entire tonal distribution at
a glance. This method usually increases the global contrast of many images, especially when the
usable data of the image is represented by close contrast values. Through this adjustment, the
intensities can be better distributed on the histogram. This allows for areas of lower local contrast
to gain a higher contrast. Histogram equalization accomplishes this by effectively spreading out
the most frequent intensity values.
3.3 Image Segmentation using 2-DWT
The wavelet transform has gained widespread acceptance in signal processing and image
compression. Recently the JPEG committee has released its new image coding standard, JPEG-
2000, which has been based upon DWT. Wavelet transform decomposes a signal into a set of basis
functions. These basis functions are called wavelets. Wavelets are obtained from a single prototype
wavelet called mother wavelet by dilations and shifting[8]. The DWT has been introduced as a
highly efficient and flexible method for sub band decomposition of signals. The 2DDWT is
nowadays established as a key operation in image processing .It is multi-resolution analysis and it
decomposes images into wavelet coefficients and scaling function. In Discrete Wavelet Transform,
signal energy concentrates to specific wavelet coefficients. This characteristic is useful for
compressing images[9].
3.4 Feature Extraction
Shape feature extraction used in this paper are solidity, extent, minor axis length and
eccentricity. This features taken Shape feature extraction used in this paper are solidity, extent,
minor axis length and eccentricity. This features taken from research [3] in order to extract shape
feature in diseased region.
Eccentricity is used to recognize whether the rust shape is a circle or line segment.
Eccentricity is the ratio of the distance between the foci of the ellipse and its major axis length. An
ellipse whose eccentricity is 0 can recognized as a circle, while an ellipse whose eccentricity is 1
can recognized as a line segment.
Gray Level Co-occurrence Matrix (GLCM) extract second order statistical texture features.
Texture feature extraction used in this research are contrast, correlation, energy and homogeneity.
This features taken from research [3] to extract texture feature in leaf diseased region.
Contrast of the pixel and its neighbors is calculated over all of the image pixels. Contrast
is used to measure contrast between neighborhood pixels.
Color is a distinctive feature for image representation that is invariant with respect to
scaling, translation and rotation of an image [9]. Mean, skewness and kurtosis are used to represent
color as features.](https://image.slidesharecdn.com/detectionofexudatesdraft-181221063601/75/Detection-of-exudates-draft-4-2048.jpg)
![3.5 Classification
Data mining algorithms which carry out the assigning of objects into related classes are
called classifiers. Classification algorithms include two main phases; in the first phase they try to
find a model for the class attribute as a function of other variables of the datasets, and in the second
phase, they apply previously designed model on the new and unseen datasets for determining the
related class of each record [1].
3.5.1 KNN Classifier
Nearest neighbor classifiers are based on learning by analogy, that is by comparing a given
test tuple with training tuples which are similar to it. The training tuples are described by n
attributes. Each tuple represents a point in an n-dimensional space. In this way, all of the training
tuples are stored in an n-dimensional pattern space. When given an unknown tuple, a k-nearest
neighbor (k-NN) classifier searches the pattern space for the k training tuples which are closest to
the unknown tuple. These k training tuples are the k-nearest neighbors of the unknown tuple [20].
“Closeness” is defined in terms of a distance metric, such as Euclidean distance. The
Euclidean distance between two points or tuples X1=(x11, x12,…, x1n) and X2=(x21, x22,…, x2n)
obtained from Equation 3.
3.5.2 Support Vector Machine
A support vector machine (SVM) is an algorithm that uses a nonlinear mapping to
transform the original training data into a higher dimension. Within this new dimension, it searches
for the linear optimal separating hyperplane. A hyperplane is a “decision boundary” separating the
tuples of one class from another. With an appropriate nonlinear mapping to a sufficiently high
dimension, data from two classes can always be separated by a hyperplane. The SVM finds this
hyperplane using support vectors (“essential” training tuples) and margins (defined by the support
vectors) [20].
3.5.3 Neural Network
The term neural network was traditionally used to refer to a network or circuit of neurons.
The modern usage of the term often refers to artificial neural networks, which are composed of
artificial neurons or nodes. Thus the term may refer to either biological neural networks, made up
of real biological neurons, or artificial neural networks, for solving artificial intelligence (AI)
problems. The connections of the biological neuron are modeled as weights. A positive weight
reflects an excitatory connection, while negative values mean inhibitory connections. All inputs
are modified by a weight and summed.
3.6 Exudate segmentation
Based on the classifier results following steps are used for segmentation of the exudate in
the original image.](https://image.slidesharecdn.com/detectionofexudatesdraft-181221063601/75/Detection-of-exudates-draft-5-2048.jpg)
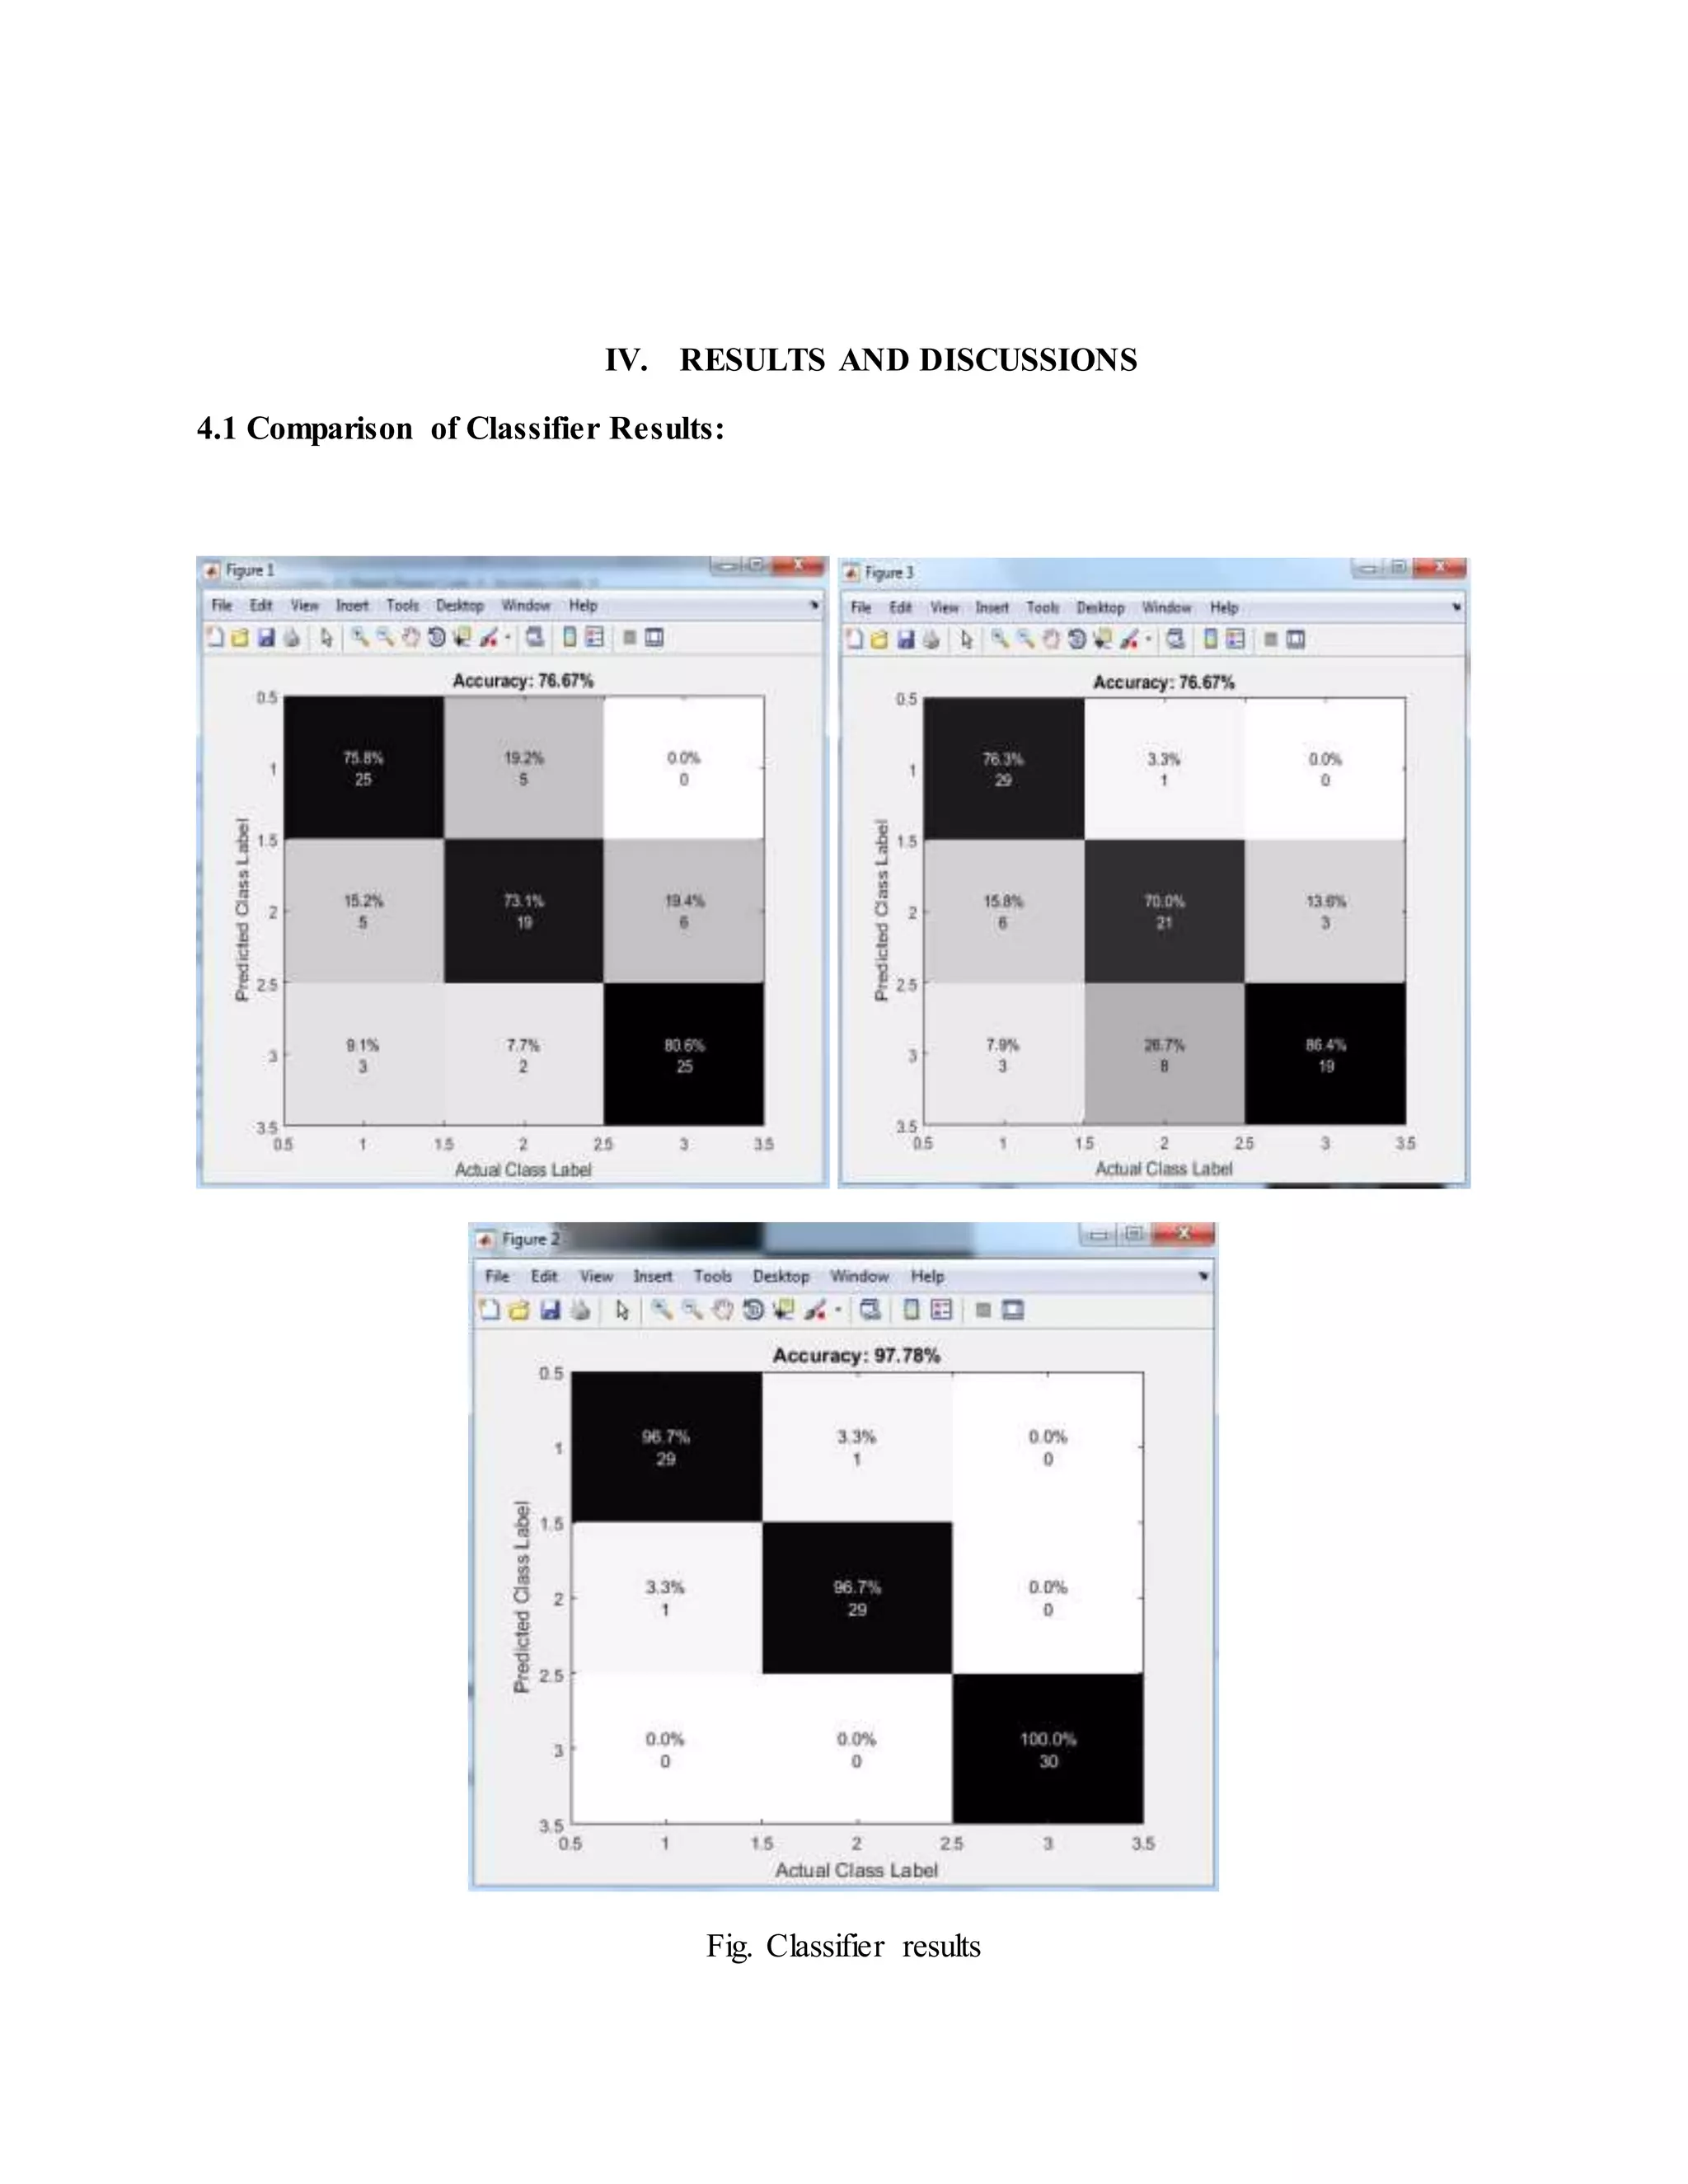
![features are fed to 3 different classifiers such as KNN, SVM and NN. Based on the classifier result
if an exudate is present the extraction of exudate ROI is done based on canny edge detection
followed by morphological operations. The severity of the exudates is established on the area of
the detected exudate.
VII. REFERENCE
[1] Sangita Bharkad, Proceedings of the Second International Conference on Computing
Methodologies and Communication (ICCMC 2018), 978-1-5386-3452-3/18/$31.00 ©2018
IEEE, P-891-894.
[2] Mohammed Shafeeq Ahmed, Mohammed Shafeeq Ahmed, 2017 International Conference on
Wireless Communications, Signal Processing and Networking (WiSPNET), 767-770
[3] C. Nivetha, S. Sumathi, and M. Chandrasekaran, International Conference on Communication
and Signal Processing, April 6-8, 2017, India, 196-1966.
[4] Dipalee Gupta1, Siddhartha Choubey, Discreet wavelet transform for image processing,
International Journal of Emerging Technology and Advanced Engineering Website:
www.ijetae.com (ISSN 2250-2459,ISO 9001:2008 Certified Journal, Volume 4, Issue 3, March
2015
[5] Reza Entezari-Maleki, Arash Rezaei, and Behrouz Minaei-Bidgoli, Comparison of
Classification Methods Based on th e Type of Attributes and Sample Size, Journal of
Convergence Information Technology (3):94-102 · September 2009.](https://image.slidesharecdn.com/detectionofexudatesdraft-181221063601/75/Detection-of-exudates-draft-9-2048.jpg)