
Recommended
Recommended
More Related Content
What's hot
What's hot (20)
Similar to 1 s2.0-s1877042816301811-main
Similar to 1 s2.0-s1877042816301811-main (20)
Recently uploaded
Recently uploaded (20)
1 s2.0-s1877042816301811-main
- 1. Procedia - Social and Behavioral Sciences 221 (2016) 211 – 217 Available online at www.sciencedirect.com ScienceDirect 1877-0428 © 2016 Published by Elsevier Ltd. This is an open access article under the CC BY-NC-ND license (http://creativecommons.org/licenses/by-nc-nd/4.0/). Peer-review under responsibility of SIM 2015 / 13th International Symposium in Management doi:10.1016/j.sbspro.2016.05.108 SIM 2015 / 13th International Symposium in Management Improving Key Performance Indicators in Romanian Large Transport Companies Cristian Dumitrachea *, Oualid Kherbasha , Marian Liviu Mocana a Faculty of Management in Production and Transportation, Department of Management Politehnica University of Timisoara, Timisoara, Romania Abstract This paper presents the results of the utilization and analysis of the key performance indicators (KPI’s) in large transport companies, applying the model of the specially developed client application for managing the performance in the transport company. Transportation is one of the most important and vital sectors of the Romanian economy. The technological advancement and the use of indicators and management principles improves the moving load, delivery speed, service quality, operation costs, the usage of facilities and energy saving; we develop indicators for this sector to identify its current state, and predict its future. Transportation takes a crucial part in the manipulation of logistics. Reviewing the current conditions, a strong system needs a clear use of indicators, proper transportation instruments and techniques to link the procedures. The objective of this paper is thus to define the role of indicators in transportation in reference to further improvement. The study was undertaken to identify the situation of freight transport companies from Romania, to find its problems and to discover new solutions for improving the utilization of the fleets, improving average daily trips and increasing the transport capacity. © 2015 The Authors.Published by Elsevier Ltd. Peer-review under responsibility of SIM 2015 / 13th International Symposium in Management. Keywords: key performance indicators; transport; large companies. * Corresponding author. Tel.: +40727310370; fax: +40256 404287 E-mail address: cristian.dumitrachetm@yahoo.ro © 2016 Published by Elsevier Ltd. This is an open access article under the CC BY-NC-ND license (http://creativecommons.org/licenses/by-nc-nd/4.0/). Peer-review under responsibility of SIM 2015 / 13th International Symposium in Management
- 2. 212 Cristian Dumitrache et al. / Procedia - Social and Behavioral Sciences 221 (2016) 211 – 217 1. Introduction The globalization of the world market and the rapidity of technical and technological developments have entirely changed the business environment, resulting in a great upheaval in the world of commerce. Nowadays, every business must be competitive worldwide to survive in the market. Competition knows no boundaries. In modern businesses, organizations are confronted with different demands from consumers, innovative technologies and the increasing pressure on cost and product development time (Željko et al., 2010). Kozlak said that the process of globalization is accompanied by changes in transport networks, transport systems, organization structures of companies, systems of values and a reduced role of the state in the economy (Koźlak, 2008). Kajal said that transportation, being an important service-providing sector, represents an important part of the Romanian economy. More significantly, transportation plays a vital role in facilitating economic activity between sectors and across regions. (Kajal et al., 2004). During the last 20 years, companies aim not only for earnings but also profitability, and not just winning but retaining consumers as well. In order to do that, their own performance must be satisfactory, making the product or service available on the right place, right time, and right quantity for the right customer (Konsta and Plomaritou 2012). New methods of logistic management in the field of transportation have been forced into play due to the economic improvement of the world as well as fast capital flow and information flow. Possessing one’s own fleet of vehicles has thus become financially inefficient. Full maintenance costs of a transport system (i.e. the cost of vehicles, cost of work and amortization) were all deciding factors to delegate the transport structures beyond the organizational range of the enterprise. A significant number of enterprises have fully resigned from their “own” fleet of vehicles and decided to realize their services of transporting goods on the basis of the outsourcing. (Eglė, 2011). The English Language Dictionary describes an indicator as “an instrument which gives you information”. According to OECD/DAC, an indicator is: “A quantitative or qualitative factor or variable that provides a simple and reliable means to measure achievement, to reflect changes connected to an intervention, or to help assess the performance of a development actor” (DAC Glossary of Key Terms in Evaluation, May 2002) A transportation indicator is a measure of change over time in the transportation system or in its social, economic, or environmental effects, amongst others. (National Research Council. 1997). People working in the road freight transport sector take pride in their duty and go by the saying “If you have it, a truck probably brought it”. With numerous players ranging from large companies to single unit family owned firms, all of them strive to understand and improve customer experience by using key performance indicators, such as indicators of use of fleet, indicators for the use of trip, and Indicators of use of transport capacity etc. The challenge posed in delivering Work Package 1 (WP1), was to understand this and link it to Key Performance Indicators (KPIs) for the measurement, comparison and marketability of a hybrid-on-demand truck-(semi)trailer configuration. The aim of this paper is to examine the applicability and usefulness of performance indicators in Large Transport Companies. The paper brings the importance of KPIs closer to the reader and examines their definition, purpose and role in the transport market. The first part is devoted to overview transport market in Romanian literature review on KPIs. The second part is the methodology, where a date is taken across the tanker transport companies in Romania. The third part is the analysis of the date which showed that even though many Romanian tanker enterprises recognize the benefits of performance indicators, a small percentage of them use some types of KPIs. The final part is the conclusion. 2. Romanian Freight Transport Market After joining the EU on January 1st 2007, the Romanian Freight transport market began a new development, considering that after joining the EU, the Romanian freight transport companies can drive all over EU countries having only EU License, so the market was liberalized and this led to a quick expansion of Romanian companies, considering the competitiveness which these companies have as well as the lower costs involved. Nowadays, however, that is not sufficient anymore. The concurrence between Romanian and Eastern European companies is very high in general. In conclusion, knowing the real situation of a company regarding key performance indicators and finding new solutions for improvement plays a key role in understanding freight transport performance. Regarding the most recent data from Romanian Road Authority, there are 28040 transport companies registered
- 3. 213Cristian Dumitrache et al. / Procedia - Social and Behavioral Sciences 221 (2016) 211 – 217 in Romania with a fleet over a maximum total weight of 3500 kg. Of these, only 5 have at least 400 vehicles as well as a turnover of up to 170 million RON. The first five large freight transport companies have between 5 and 20 years of activity, being relatively new to these activities in cooperation this Western Europe companies that have more experience (Autoritatea Rutiera Romana, 2015). Transport of goods is characterized by the strong dominance of roadway which comprises around 58% of total goods transport. Rail represents less than 19% of goods transport, although it benefits of an extensive but outdated infrastructure. 3. Defining the Indicators Used The general classification of key performance indicators comprises operating and economic indicators. They show the overall picture of freight transport market performance indicators which monitor time distribution, efficiency and quality of traffic and goods storage operations. The European Commission estimates an increase in road freight traffic until 2020, about 30%, which will exacerbate the problems already faced by transport (transport axes congestion, increase road tax, tightened regulations, time spent driving and resting, labour crisis). On the other hand, considering the current economic crisis and the important variations in fuel costs, it is also estimated that large transportation companies generate data above the key performance indicators. Based on benchmarking parameters, the company can be assessed in relation to other comparable companies in the field. 3.1 Operational Indicators are Classified as: 3.1.1. Indicators of use of fleet a) The coefficient of use of fleet CUF= the number of active vehicles * number of active days / number of total vehicles * number of days of the considered period (1) Relevant if CUP >0.85 Azi = 365 – S – R; S= legal holidays, generally considered 12 days / 1 year; R= legal restriction of circulation, generally considered 6 days / 1 month This coefficient has a large impact along a freight transport company. Inadequate planning can affect all key performance indicators. (Caraiani, 2008). b) The coefficient of utilization during the working day CUD= number of vehicle * work hours / number of vehicle * 9 hours (2) Relevant if CUD> 85 % .(Ion, 2001 ) 3.1.2. Indicators for the use of trip a) Use of trip coefficient UTC = Lp/L = Lp/(L0+Lp+LNP) (3) Lp [km] - productive length (loaded); L [km] - total length of the path; L0 [km] - path length "zero" (for food, repair) incurred by the employer; LPN [km] - unproductive path length; (Ion, 2001) Relevant if UPC> 95% b) Average daily Trip ADT = L tot/ A (4) L tot [km] - total path length in the reference period, 1 [month]. A - the number of active days of the reference period. Relevant if ADR> 500 [km / day]; (Caraiani, 2008 )
- 4. 214 Cristian Dumitrache et al. / Procedia - Social and Behavioral Sciences 221 (2016) 211 – 217 3.1.3 Indicators of use of transport capacity a) The amount of freight transported by a vehicle Where: Ti [t] - the amount of freight transported by a vehicle on the period of reference, regularly 1 [day] or 1 [month] b) The coefficient of utilization of transport capacity (5) Qp [t * km] – maximum possible performance of freight transport for one vehicle; Qi [t* km ] – performance realized by the fleet ; nc = number of vehicles. (Grama, 2007) 3.1.4. Speed indicators a) Average speed Vt: Vt = ADT / tc [km / h] Where: tc [h] - the average circulation during the day; 2. (Alexa, 1995) b) Average operating speed Ve Ve = ADT / tc + ts [km / h] where: ts [h] - time for loading – unloading and others operations; (Alexa, 1995) Documents used to calculate the operating indicators: GPS – fleet management and topography. 4. Analyses of Key Performance Indicators Analyses and Methods for Improvement 4.1. Case Study on first 5 large freight transport companies from Romania Romanian market of freight transport companies include at the end of 2014 more than 28,400 companies, of which only five possess a fleet of more than 400 vehicles with a maximum weight exceeding 3500 kg, accounting for only about 7% of the market. Table 1. Analyses of the first 5 freight transport companies according to 2014 data Company Commercial Fleet Drivers Total employees Total Km. driven Net Turnover (Ron) Duvenbeck Logistik 484 532 641 685,34 mil. 251,88 mil. International Lazar 402 404 461 438,98 mil. 188,36 mil. Dunca Expeditii 461 485 630 497,88 mil. 182,45 mil. Dumagaz Transport 441 443 548 484,21 mil. 171,89 mil. Transcondor 536 584 723 742,89 mil. 321,91 mil. Source: Ministerul Finantelor Publice: mfinante.ro; Autoritatea Rutiera Romana Table 2. Area distribution and type of vehicle used in Freight Transport* Type of freight transport Fleet Company National Freight Transport (%) International Freight Transport (%) Fleet below 12 tones (%) Fleet up to 12 tonnes (%)Round-trip Communitary Duvenbeck Logistik 5 55 40 3 97 International Lazar 15 65 20 12 88 Dunca Expeditii 25 55 20 18 82 Dumagaz 13 60 27 7 93 Transcondor 2 30 68 4 96 *Case study applied to the first 5 freight transport companies during 01.03.2015 – 01.06.2015.
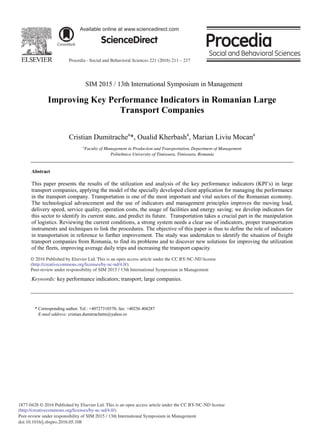
- 5. 215Cristian Dumitrache et al. / Procedia - Social and Behavioral Sciences 221 (2016) 211 – 217 Table 3. Main cause leading to the decrease of the coefficient of use of fleet according Freight Transport Companies Company Infrastructure % Deviation from schedule % Insufficient communication with client % Technical breakdown% Legal restrictions % Time at loading / unloading % Duvenbeck Logistik 20 20 15 10 25 10 International Lazar 25 10 5 15 30 15 Dunca Expeditii 28 12 5 20 30 5 Dumagaz 22 15 30 Transcondor 15 15 5 15 28 22 Source: Case study applied of first 5 freight transport companies during 01.03.2015 – 01.06.2015. The results of the evaluation show that large freight transport companies were generally standing on a level very appropriate to the minimum required level for making performance. Although on average they made a trip of only 463 km, one of the real problems is represented by the infrastructure, which has also an impact on Ve indicator and UTC. Regarding CUD and CUF we can see that Romanian companies were standing on a proper level, with only 2 companies which did not succeed in fulfilling the target. But methods for improving those indicators are also needed. In case of Ti indicators we can conclude that the Romanian companies fulfil it. But, of all the indicators this has a minimum impact on key performance indicators. Table 4. Key performance analyses Company CUF CUD UTC ADT Ti Q Vt Ve % % % Km/day T/unit % Km/h Km/h Duvenbeck Logistik 86 88 96 515 2100 85,5 79 55 International Lazar 85 87 90 435 2000 80 77 48 Dunca Expeditii 81 84 88 415 2200 90 71 44 Dumagaz 80 83 87 420 1900 77,5 71 43 Transcondor 88 90 96 530 1950 79,5 79 50 Average 84,00 86,40 91,40 463 2030 82,5 75,4 48 Minimum required level 85,00 85,00 95,00 500 2000 80 75 50 Evaluation NO YES NO NO YES YES YES NO Source: Case study applied to the first 5 freight transport companies during 01.03.2015 – 01.06.2015 (Caraiani, 2008), (Ion, 2001), (Grama , 2007). 4.2. Methods for Improving Key Performance Indicators 4.2.1. Improving key performance indictors by opening new stations and changing the drivers along round trips Romania – Germany and Romania – Italy According to this study, 53 % of all freight transports made by the first 5 competitors were made round-trips; from this 70 % were to and from Germany and Italy. In conclusion 37 % of all freight transports respect a type from where we can find a general solution for improving key performance indicators. We find a solution to improving key performance indicators along these trips. Loading : Romania ...............T.T.24h-> Custom Ro – Hu :.T.T. 20h-> Destination: Germany or Italy Drivers : 1 ...........................................-> 1th driver rest + 2 drivers.. -> rest 9 h Loading : Germany or Italy ..T.T.20h -> Custom Ro-HU : ..T.T. 24 h ->Destination : Romania Drivers : 2 ...........................................-> Rest 9 h+ 1 driver ..............-> rest 9 h Round trip Romania – Germany or Italy .................4,5 days . Working days per month .........................................23 days. Working with 1 drivers.............................................4,18 round-trips Working with 2 drivers ............................................5,11 round trips
- 6. 216 Cristian Dumitrache et al. / Procedia - Social and Behavioral Sciences 221 (2016) 211 – 217 Figure 1. Improving ADT indicator 4.2.2. Improving coefficient of use of transport capacity by purchasing new ultra – light semitrailers Standard semitrailer weight .........6,3 tones.............transport capacity ........ 24,5 tones Ultra- light semitrailer weight ......4,7 tones ............transport capacity ........ 26,1 tones Freight transport capacity ...............................................................................+ 6,5 % Q indicator after improvement ....................................................................... 87,5 % 5. Conclusion Organizational performances via Key performance indicators are a newer concept that uses companies of today. KPI are financial and non – financial indicators that help companies to testify how successful they are in their business. One of the necessary conditions for effective and efficient system for performance measurement formulation is previously constituted process organization, with all standardized processes. The target of this study was to analyse and find generally applicable resolutions for improving key performance indicators along large freight transport companies from Romania. The KPIs must be customer oriented in marketing and/or logistics terms. This analysis revealed the general situation of the market with problems regarding insufficient coefficient of use of fleet, problems with making trips without deviation from schedule and respecting legal regulations. These studies give a clear picture for how to improve large companies with a fleet of over 400 units. For example, one solution is to open new stations along Customs points, where drivers can rest, switch and make one more technical check. This solution can improve ADT 22 %, and can also increase CUF. Using ultra light semitrailers companies can benefit from increasing freight transport capacity up to 6,5%, and can immediately increase their Q indicator. References Alexa, C. (1995). Transporturi si expeditii internationale, (ed), All, Buc. Caraiani G.(2008). Logistica transporturilor. Bucureşti: Editura Universitara. Eglė ,S. (2011). The analysis of Lithuania railway transport performance in sustainable transport context. The 7th International Conference May 5–6, 2011, Vilnius, Lithuania. pp. 221-225. Konsta., K. & Plomaritou, E. (2012). Key Performance Indicators (KPIs) and Shipping Companies Performance Evaluation: The Case of Greek Tanker Shipping Companies. International Journal of Business and Management, 10, 142-155. Kozlak, A. (2008).Transport as a factor and subject of globalization.W: Globalizacja a jej socjalno-ekonomicke dosledky 08. I cast. Red. M. Gorgolova, P. Kral. Zilinska Univerzita w Zylinie, Żylina 2008. Available on line at http://logistickymonitor.sk/images/prispevky/kozlak-aleksandra.pdf. Grama I. G. (2007). Managementul transporturilor internationale, (2007ed.) Europolis, Constanta, Ing. Gheorghe ION (2001). Managementul Transporturilor - organizarea transporturilor, (ed), Bucureşti. 0 100 200 300 400 500 600 ADT KM / DAY
- 7. 217Cristian Dumitrache et al. / Procedia - Social and Behavioral Sciences 221 (2016) 211 – 217 Lahiri, Kajal and Wenxiong Yao, (2004) “A Dynamic Factor Model of the Coincident Indicators for the US Transportation Sector,” Applied Economic Letters, 11, 595-600. National Research Council (1997). Science Teaching Reconsidered: A Handbook: National Academy Press, Washington, DC. OECD (2002). ‘Glossary of Key Terms in Evaluation and Results-Based Management’, Development Assistance Committee (DAC), Paris, France,. Available on line at http://www.oecd.org/dataoecd/29/21/ 2754804.pdf. Željko, D., and Rado Maksimovi ., R. & Živoslav., A. (2010). Key performance indicators in a joint-stock company. African Journal of Business Management, 6, 890-902.